14 November 2019
Size of thunderstorm dome clouds may predict tornado intensity
Posted by larryohanlon
By Erin I. Garcia de Jesus
The size of a bulge at the top of a thunderstorm’s anvil-shaped cloud may allow researchers to forecast the strength of tornadoes that spawn from such storms, according to a new study in AGU’s journal Geophysical Research Letters.
Tornadoes, particularly those with strong winds, pose a serious threat to the property and lives of people in their path. Yet scientists have few tools at their disposal to accurately predict how powerful a forming tornado might be. Instead, meteorologists rely on their own expertise to anticipate a twister’s strength.

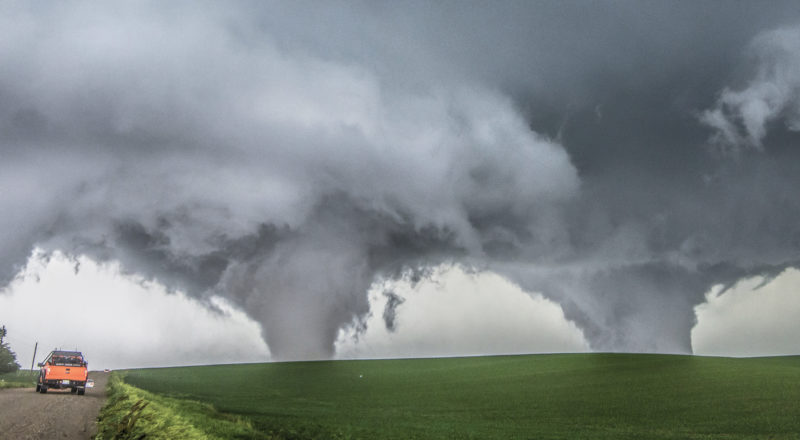
Twin violent (EF4) tornadoes outside of Wisner, Nebraska on June 16, 2014. Credit: NOAA/Ethan Schisler
“They look at the radar and think ‘the rotation in the storm looks strong, so it’s probably going to produce a strong tornado’,” said Geoffrey Marion, an atmospheric scientist at the University of Illinois at Urbana-Champaign and lead author of the new study. “What we found is that it’s not always the case. It can give you a false sense for what the strength of the tornado might be.”
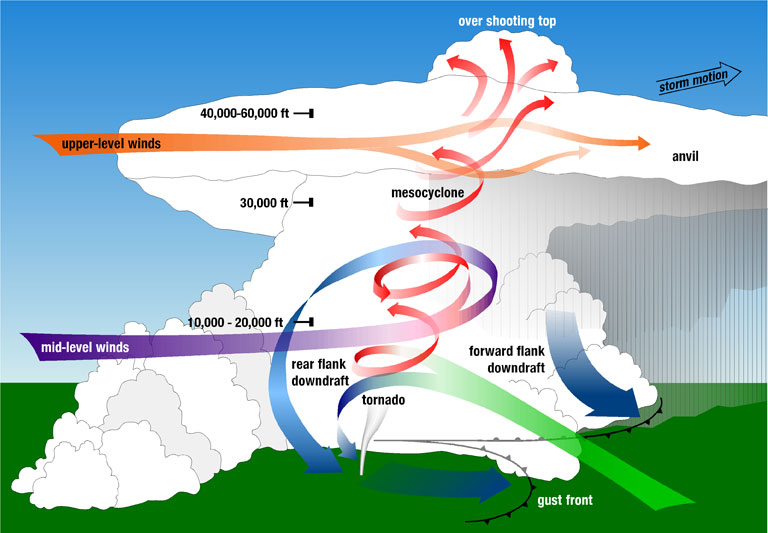
The vertical growth of a thunderstorm stops at a level in Earth’s atmosphere where the troposphere meets the stratosphere. Here, the clouds spread out and create the characteristic anvil shape of storm clouds. For strong thunderstorms, rapid rising air within the storm, called the updraft, can cross this boundary and establish an overshooting top — a dome-like structure on top of the anvil, which can sometimes look like an ice cream cone.
Tornadoes typically form below the updraft and the storm’s overshooting top. Previous work found bigger updrafts tended to create larger overshooting tops. The new findings suggest satellite imagery might be able to pinpoint which storms had the largest updrafts and, consequently, which could produce the strongest tornadoes.
From top to tornado
In the new study, Marion and his colleagues wanted to link the intensity of tornadoes forming at the bottom of the storm to events going on at cloud top. By harnessing data from high-resolution satellites, the researchers analyzed tornado-producing storms from 2017 to 2019 that hit a strip of the central U.S. from Wisconsin to Louisiana. They scanned images for the storm’s coldest clouds – those highest up in the atmosphere – and compared the size of the overshooting top to tornado severity.
The team found the larger the peak area of the storm’s overshooting top, the stronger its tornadoes tended to be. Twisters with winds whipping at more than 219 kilometers per hour (136 miles per hour, or an EF3 on the Enhanced Fujita scale) were more likely to have overshooting tops with areas greater than 90 square kilometers (34.7 square miles), an area almost the size of Disney World. Winds at this speed are strong enough to lift cars off the ground and strip roofs off homes.
A storm’s overshooting top tended to reach its peak size at the same time a tornado began to form or grow in strength. Although the study didn’t test how the technique could be applied in warning systems, the timing may provide a fleeting window for meteorologists to alert people in its path.
Marion noted the information would be potentially lifesaving, but experts should be aware of how people might respond to such notifications – particularly for weaker tornadoes.
“Telling someone that a weak tornado is coming versus a strong tornado is probably going to elicit a different response,” he said.
Relying on the overshooting top to predict tornado intensity, however, requires the storm to have one – and not all do. Ongoing work aims to use satellite images alongside data from radar, which could help scientists see multiple parts of the storm and develop an in-depth tool to link other thunderstorm features to tornado intensity, Marion said.
Erin I. Garcia de Jesus is a science writing intern at AGU. Follow her on Twitter @viruswhiz


 GeoSpace is a blog on Earth and space science, managed by AGU’s Public Information staff. The blog features posts by AGU writers and guest contributors on all sorts of relevant science topics, but with a focus on new research and geo and space sciences-related stories that are currently in the news.