October 25, 2016
Ross Ice Shelf Shear Zone-Research Focus of Gordon Hamilton
Posted by Mauri Pelto
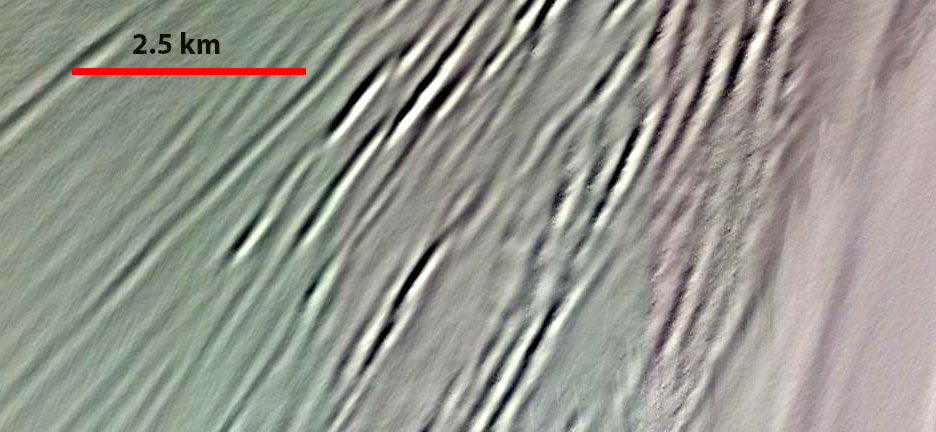
Satellite Image of the Shear Zone: The crevasses do have a surface representation, but are not generally open.
Gordon Hamilton lost his life on Saturday Oct. 22, 2016 conducting research in the shear zone between the Ross Ice Shelf and McMurdo Ice Shelf. I had the pleasure of working with and reviewing Gordon’s work; hence, it seems important to elaborate on the research that had brought researchers to this cold and hazardous corner of our planet.
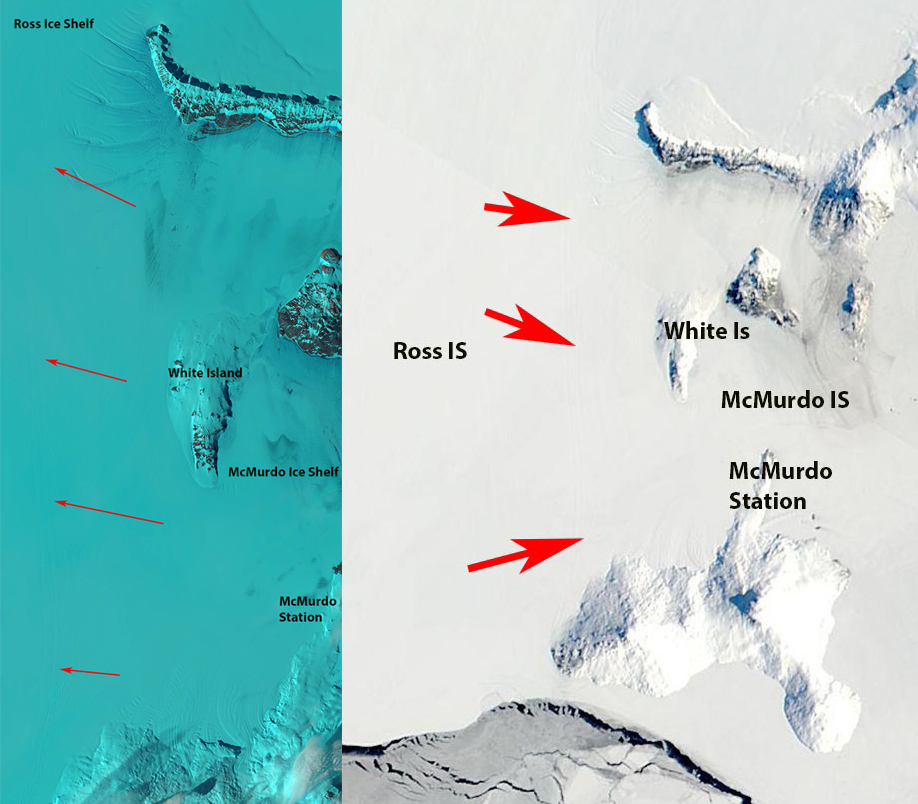
Peter Rejcek of the Antarctic Sun provided an excellent context for this work two years ago. The Ross Ice Shelf is the world’s largest ice shelf at ~470,000 square kilometers. This floating ice shelf buttresses many faster flowing outlet glaciers that feed into it. Removal of the ice shelf would allow these glaciers to accelerate as has been seen after other ice shelves are lost, which could lead to enough drainage of the ice sheet to raise sea level 4 or 5 meters. The Ross Ice Shelf is in turn stabilized by pinning points. Such pinning points include Roosevelt Island and the shear zone. This shear zone represents a region of high shear and velocity change between the two ice shelves. Shear represents friction which helps pin the ice shelf. Gordon Hamilton was the principal investigator on a three-year project to map this shear zone and determine the mechanics. His hypothesis was without the shear zone the Ross Ice Shelf further south would slowly disintegrate. Without the ice shelf a glacier like Byrd Glacier which drains an immense area, 1,070,000 square kilometers, of East Antarctica could double its speed. Gordon was quoted by Peter Rejcek “The places that really control the future of the ice sheet are hard-to-access places, like shear margins or the underside of the ice shelf or the middle of crevassed outlet glaciers,” he added. “It’s hard to get good data sets there”. But that is exactly what he was continuing to do, getting the data that would us be able to model and forecast future behavior of the this region, which in turn is crucial to both the East and West Antarctic Ice Sheets.
Left: Landsat image of field area from Feb. 2016. Red arrows indicate shear zone.
Right: MODIS image from Oct. 23, 2016 illustrating the shear zone, red arrows.
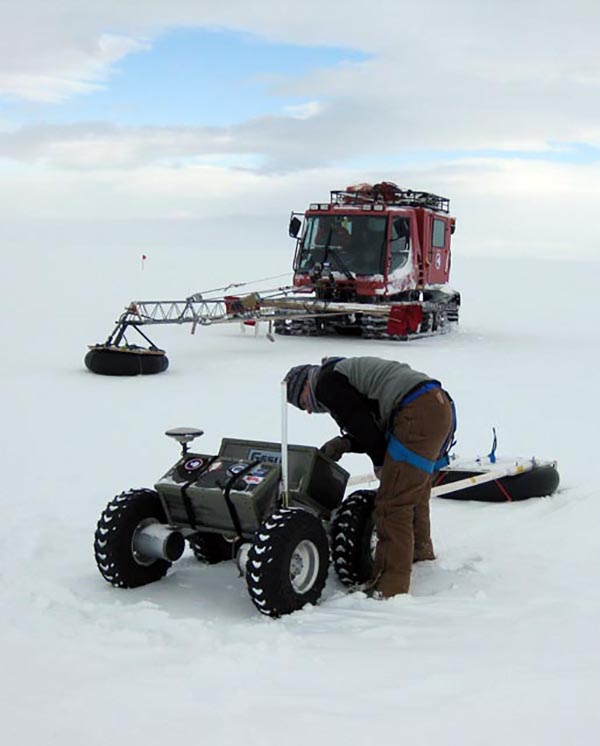
To understand what was happening required detailed mapping of the crevasses within the shear zone. Gordon had noted that the sub-surface crevasses and the visible surface crevasses did not seem to match up well in 2014. This suggested an unusual flow pattern that could indicate instability within the shear zone. To examine and map the crevasses required detailed GPS and ground penetrating radar observations (GPR). Because of the danger a pair of Robot rovers were utilized that could do the bulk of the mapping. The robot rovers were developed by Jim Lever, a mechanical engineer with the U.S. Army Cold Regions Research and Engineering Laboratory (CRREL), in conjunction with the Thayer School of Engineering at Dartmouth College. The robots were used to prepare a safe route through the shear zone for the South Pole Traverse route and research in the area. In fact the two teams last week were camped close by and working together to identify and re-mediate crevasses on the route. Arcone et al (2016) noted that the lightweight robotic vehicles had towed the GPR equipment on 100 parallel transects over a 28 km2 grid spanning the shear zone.
Some of their initial findings were presented at the AGU last fall (Kaluzienski et al, AGU, 2015). The GPR surveys had allowed detailed mapping of the internal structures of the Shear Zone. This identified crevasses both in the upper firn and in accreted marine ice at a depth of approximately 170 meters. They also found a spatial correspondence between near-surface and basal crevasses indicating that local lateral shear generated both. The distribution and orientation of the crevasses was consistent with predictions from a model. This suggests that the mismatch in crevasses that would suggest instability is not present. This work also indicates that high-resolution modeling can be used to predict the locations of basal crevassing which will lead to an improved understanding of ice-shelf mass balance processes. More images for the field area are in the field reports from Polartrec.
Deploying the robot on the ice shelf Photo Credit: Jim Lever
Insights on crevasses and what they could tell us about ice sheet behavior was a passion for Gordon. In Greenland he had been examining ways to use crevasse development to understand changing dynamics of tidewater outlet glaciers. The work conducted near Raven Camp after crevasses appeared in the skiway in 2012 was quite similar to the shear zone work in Antarctica. They installed stakes located with GPS including several continuously recording stations. This would allow determination of flow speed changes through the summer and if extensional flow had caused the formation of crevasse further inland. Understanding crevasses both for transportation needs and ice sheet behavior.


 Dean of Academic Affairs at Nichols College and Professor of Environmental Science at Nichols College in Massachusetts since 1989. Glaciologist directing the North Cascade Glacier Climate Project since 1984. This project monitors the mass balance and behavior of more glaciers than any other in North America.