
June 21, 2016
Chutanjima Glacier Retreat & High Snowline, Tibet, China 1991-2015
Posted by Mauri Pelto
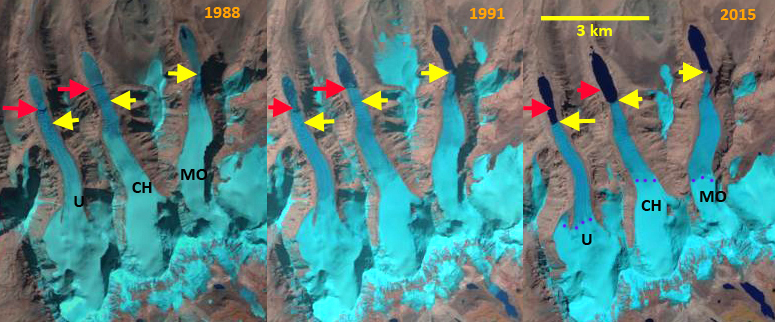
A comparison of three Tibet glaciers in 1988, 1991 and 2015 Landsat images. Red arrows are the 1988 terminus position, yellow arrow the 2015 terminus location and purple dots the snowline in late October 2015. U=unnamed, CH=Chutanjima Glacier and MO=Mogunong Glacier: which did not retreat significantly and lacks a red arrow.
A recent European Space Agency Sentinel-2A image of southern Tibet, China and Sikkim illustrated three very similar glaciers extending north from the Himalayan divide on the China-India Border. We examine these three glacier in this post. The three glaciers all drain into the Pumqu River basin, which becomes the Arun River. The largest is unnamed the two easternmost are Chutanjima and Mogunong Glacier.The glaciers all have similar top elevations of 6100 -6200 m and terminus elevations of 5260-5280 m. All three are summer accumulation type glaciers with most of the snow accumulating during the summer monsoon, though this is also the dominant melt period on the lower glacier. Wang et al (2015) examined moraine dammed glacier lakes in Tibet and those that posed a hazard, none of the three here were identified as hazardous. The number of glacier lakes in the Pumqu Basin has increased from 199 to 254 since the 1970’s with less than 10% deemed dangerous, but that still leaves a substantial and growing number (Che et al, 2014). Here we compare Landsat images from 1988, 1992 and 2015 to identify their response to climate change. The second Chinese Glacier inventory (Wei et al. 2014) indicated a 21% loss in glacier area in this region from 1970 to 2009.The pattern of retreat and lake expansion is quite common as is evidenced by other area glaciers, such as Gelhaipuco, Thong Wuk, Baillang Glacier and Longbashaba Glacier.
In the 1988 image all three glaciers terminate at the southern end of a proglacial lake with seasonal lake ice cover, red arrows. In 1991 the lakes are ice free and have some icebergs in them. By 2015 the retreat has been 500 m for the easternmost glacier, 400 m for Chutanjima Glacier and 100 m at most for Mogunong Glacier. Each glacier has remained extensively crevassed to the terminus indicating they remain vigorous. The retreat is greatest for the two ending in expanding lakes. Mogunong Glacier appears to be near the upper limit of the lake, and is not calving, which likely led to less retreat. An icefall is apparent 700 m from the front of Mogunong Glacier. The width of the glacier below this point has diminished considerably from 1988 to 2015, though retreat has been minor, indicating a negative mass balance. There is an icefall 1 km from the icefront of Chutanjima, indicating the maximum length the lake would reach.
The Sentinel image indicates an important characteristic and trend in the region. This is an early February image and the snowline is quite high on the glacier in the midst of winter. The snowline is at 5850-5900 m nearly the same elevation as in late October of 2015 seen above. This illustrates the lack of winter accumulation that occurs on these summer accumulation glaciers. It also indicates a trend toward ablation processes remaining active, though limited from November-February. The lack of snowcover on the lower glaciers as the melt season begins hastens ablation zone thinning, mass balance loss and retreat.
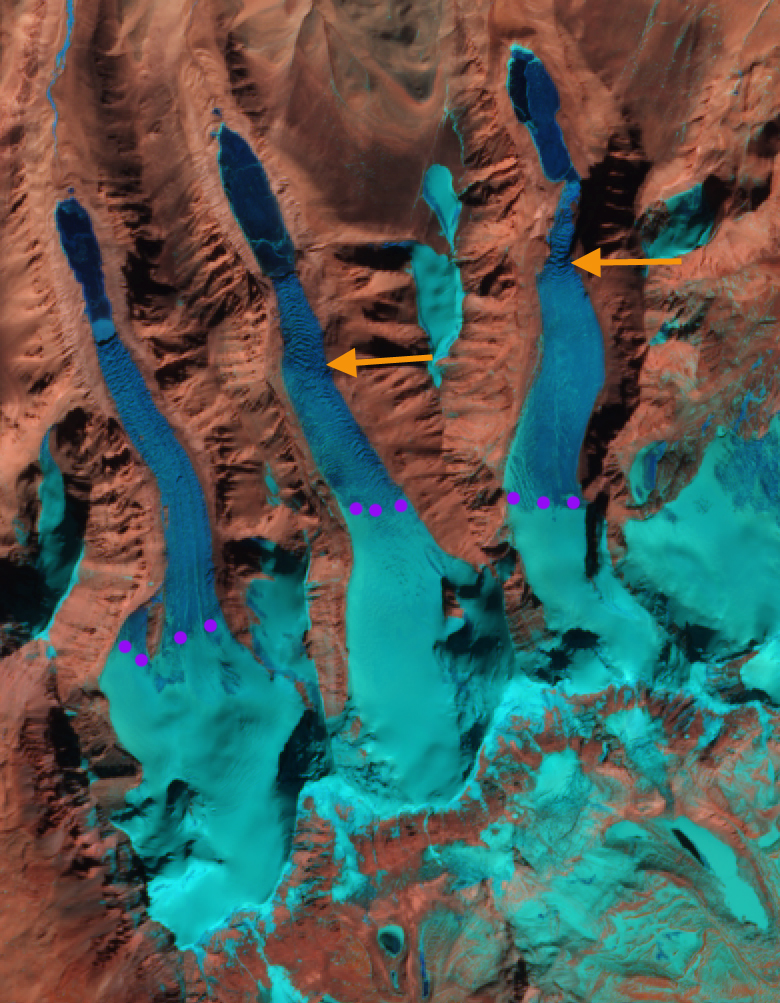
Europenan Space Agency, Sentinel-2A image from 1 February 2016. Orange arrow indicates icefalls and purple dots the snowline.
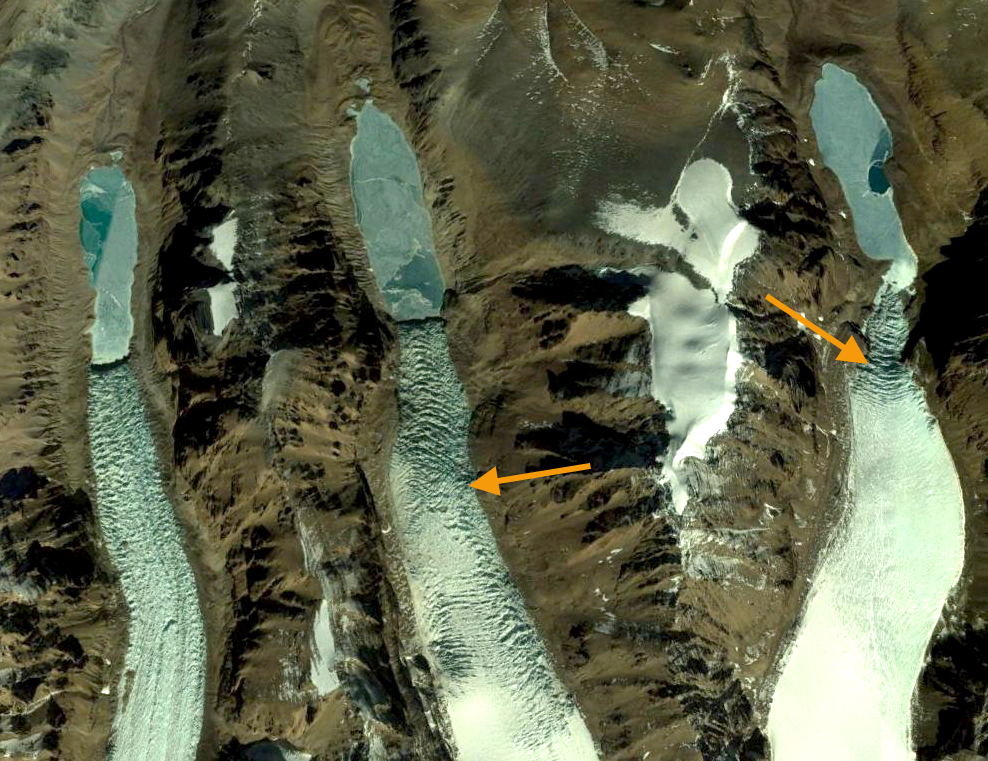
2014 Google Earth image of the region. Orange arrows indicate icefalls, note the crevassing extending to glacier front.
 Dean of Academic Affairs at Nichols College and Professor of Environmental Science at Nichols College in Massachusetts since 1989. Glaciologist directing the North Cascade Glacier Climate Project since 1984. This project monitors the mass balance and behavior of more glaciers than any other in North America.