
February 14, 2013
Tasman Glacier Retreat Update 2013
Posted by Mauri Pelto
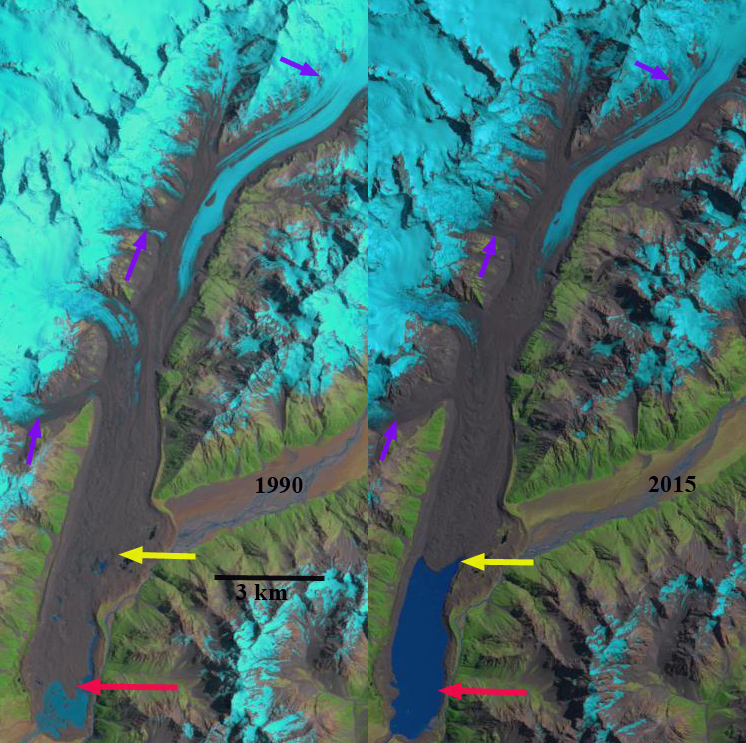
Glacier change revealed in Landsat images from 1990 and 2015.Tasman Glacier. The red arrow indicates 1990 terminus location, the yellow arrow indicates 2015 terminus location and the purple arrow indicates upglacier thinning. Illustrates the development of a proglacial lake and a 4.5 km retreat of Tasman Glacier in the last 25 years.
The New Zealand National Institute of Water and Atmospheric Research has been examining the changes in volume and snowline on New Zealand Glaciers since 1977. The Tasman Glacier is evidence of this draining from the highest mountains in New Zealand. For Tasman Glacier the retreat has been ongoing, the NIWA has noted a retreat of 180 m per year on average since the 1990’s. Dykes et al (2011) note a maximum depth of 240 m, and an expansion of 0.34 square kilometers per year in area. The proglacial lake at the terminus continues to expand as the glacier retreats upvalley. The lake is deep with most of the lake exceeding 100 metes in depth, and the valley has little gradient, thus the retreat will continue. It has been noted by researchers at Massey University that the lake can expand in this low elevation valley another 9 km, and that at the current rate this will occur over two decades.
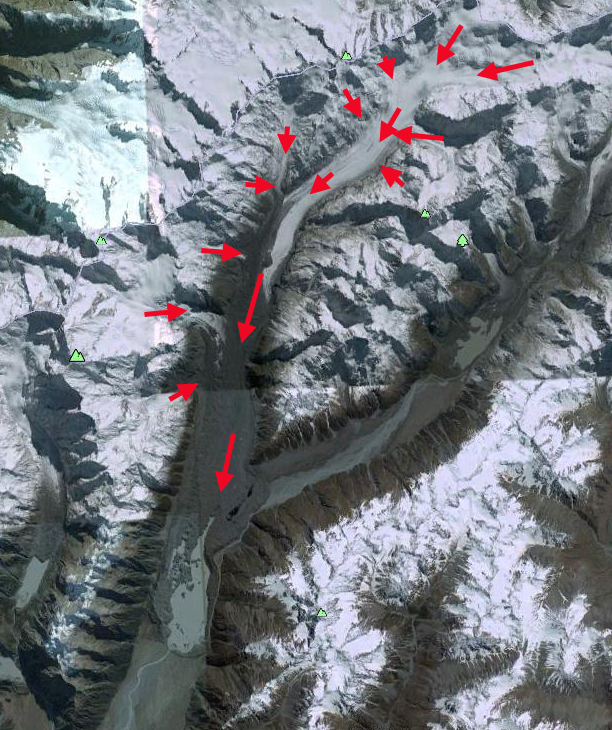
2006 Google Earth image indicating the flow of Tasman Glacier.
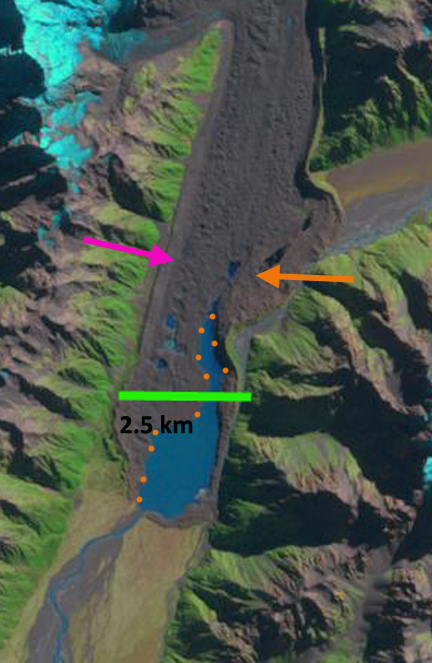
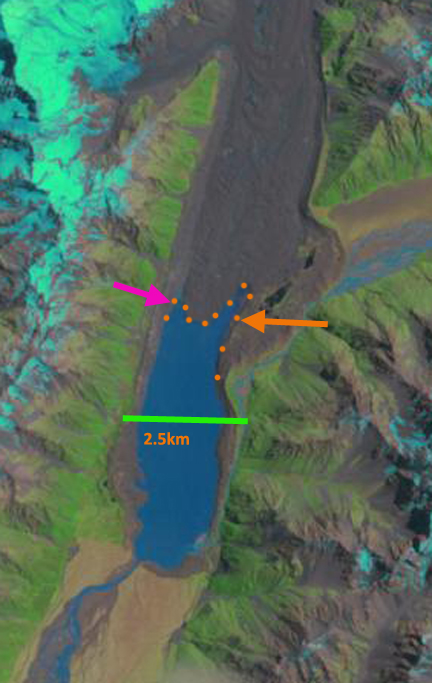
Imagery of Tasman Glacier indicates the future it faces. There was no lake in 1973 and now it is more than 5.5 km long across a width of about 2 km, and 7 km long at its longest point. Here we examine four images, the 1972 topgographic map, 2000, 2012 and 2013 Landsat images and 2006 Google Earth imagery. In each image an orange and a pink arrow indicate the 2013 terminus on the east and west respectively. In the 1972 map there is no lake at the terminus of the Tasman Glacier. In 2000 the Tasman Glacier lake was 2 km long on the west side and 4.5 km along on the east side. By 2006 the lake has expanded 2.5 km on the west side and 5.5 km long in a narrow tongue on the east side. By 2013 the Lake is 5.5 km long from bank to bank. The glacier has experienced two larger calving events in recent years the first triggered by the Christchurch earthquake in February 2011 and the second on January 30, 2012. Such events can occur because the terminus has thinned to the point that the glacier terminus is more buoyant and crevasses and rifts extend through the thinner ice.
Hooker Glacier drains into Lake Pukaki,a along with Murchison, Mueller and Tasman Glacier, where water level has been raised 9 m for hydropower purposes. Water from Lake Pukaki is sent through a canal into the Lake Ohau watershed and then through six hydropower plants of the Waitaki hydro scheme: Ohau A, B and C. Benmore, Aviemore and Waitaki with a combined output of 1340 MW. Meridian owns and operates all six hydro stations located from Lake Pūkaki to Waitaki. Reductions in glacier area in the watershed will lead to reduced summer runoff into the Lake Pukaki system.
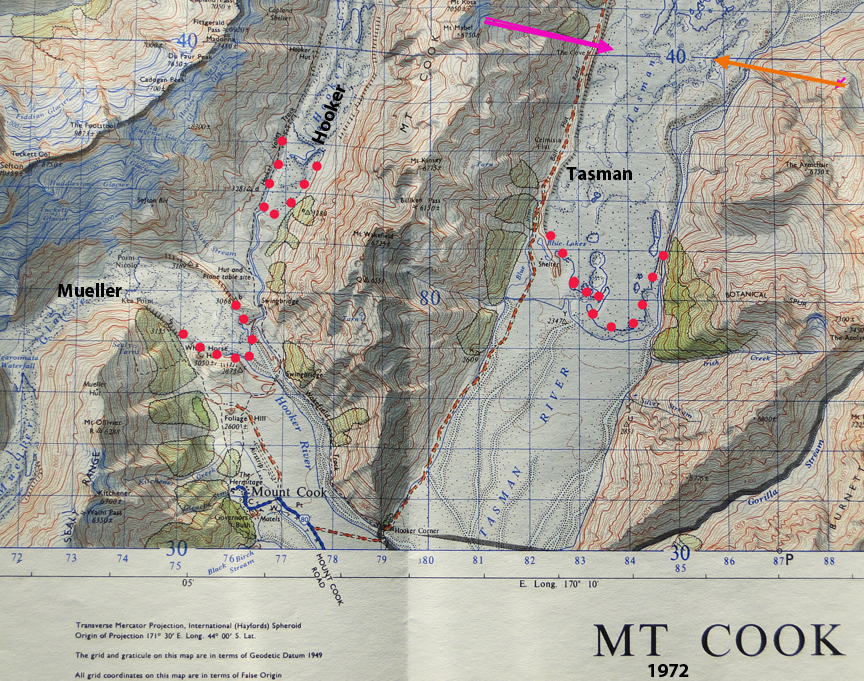
1972 Topographic map of region before there was a lake at the terminus.
2000 Landsat Image

2006 Google Earth Image
2013 Landsat Image
The last image below is a 2012 Landsat image, the blue arrow indicates the extent to which the lake is expected to extend, the snowline in this image is at 2200 m, red arrow. The glaciers retreat is the same pattern as that of Murchison, Mueller and Hooker Glacier.
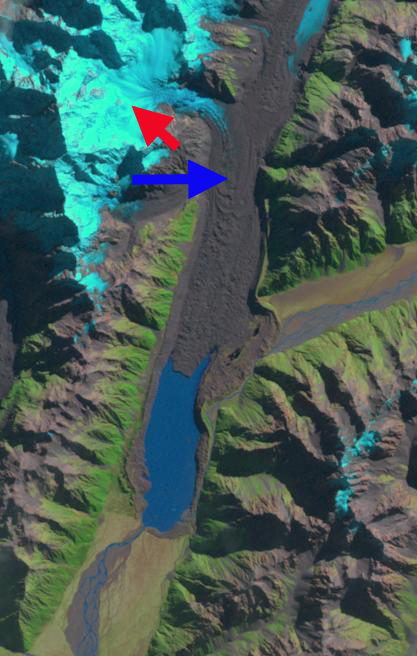
2012 Landsat Image
 Dean of Academic Affairs at Nichols College and Professor of Environmental Science at Nichols College in Massachusetts since 1989. Glaciologist directing the North Cascade Glacier Climate Project since 1984. This project monitors the mass balance and behavior of more glaciers than any other in North America.