
16 December 2014
Scientists use satellites to monitor volcano risks
Posted by kwheeling
By Kim Smuga-Otto
Copahue is a remote, but active volcano — it last erupted on July 4, 2014. Its location in the sparsely populated southern Andes Mountains near the Chile-Argentina border makes direct monitoring difficult.
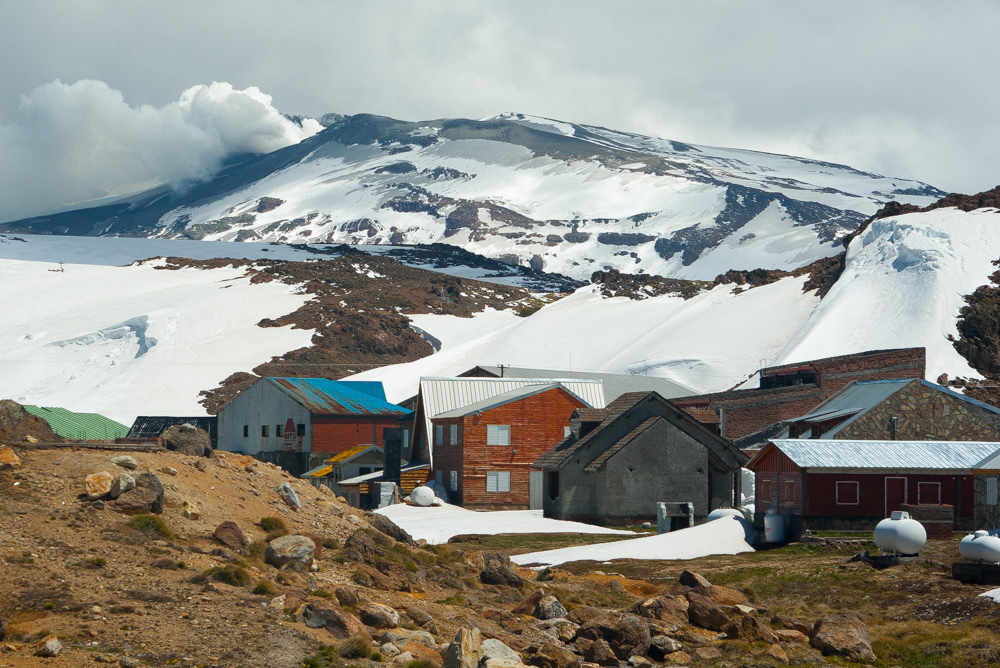
Copahue erupts on November 7, 2013.
Credit: Juan Carlos Martins
A NASA team utilized satellite data to create a map of past volcanic deposits and modeled the risk to nearby towns. They found one town on a potential lava flow path and a second town at risk for mud flows. The results were presented at Monday’s poster session at the American Geophysical Union’s Fall Meeting. The group’s methodology using satellite images can serve as a template for remotely assessing volcano risk, according to the researchers.
“Anyone, anywhere in the world can do this mapping,” said Julie Griswold, a USGS geologist who works in volcano disaster assistance and who was not involved with the study.
NASA Project Coordinator Amber Keith explained how the team used the satellites readings to identify the chemical composition of the mountain rock and classify the vegetative ground cover. From this they sussed out volcanic mineral deposits and revealed a past lava flow going southwest of Copahue. The reconstructed map matched an on-the-ground study from 2006.
They used this map and additional satellite data to analyze the risks posed from erupting volcanos. There are the obvious lava flows, burning everything in their path, and the far reaching ash that can pile up and collapse roofs, damage crops or poison water. Just as deadly are Lahars, or mud flows, that solidify like concrete when they stop moving and pyroclastic flows, a fast moving, low to the ground layer of rock and gas that can reach 1300 degrees Fahrenheit (700 degrees Celsius).
The team looked at the volcano’s three active vents and calculated the probable lava flows using their historical model. They ran the iterations 10,000 times to get a complete picture. Two of the vents flowed south, away from inhabited areas, but the primary vent “every time went in the direction of the town of Caviahue.” said Keith. Lahars flows were also extrapolated from past data and these seemed to indicate danger to the northern town of Butalelbun.
The team had less certainty when it came to modeling other dangers. In the case of the ash spread, the data was averaged monthly and they couldn’t capture the daily wind effect. And their model overestimated the distribution of pyroclastic flows.
However, Keith feels that the data, taken together will be useful for the end users of the analysis to provide them with an area of greatest risk.
Kim Smuga-Otto is a science communication graduate student at UC Santa Cruz.