
March 1, 2017
Trinity-Wykeham Glacier Retreat, Causing Separation, Ellesmere Is. Canada
Posted by Mauri Pelto
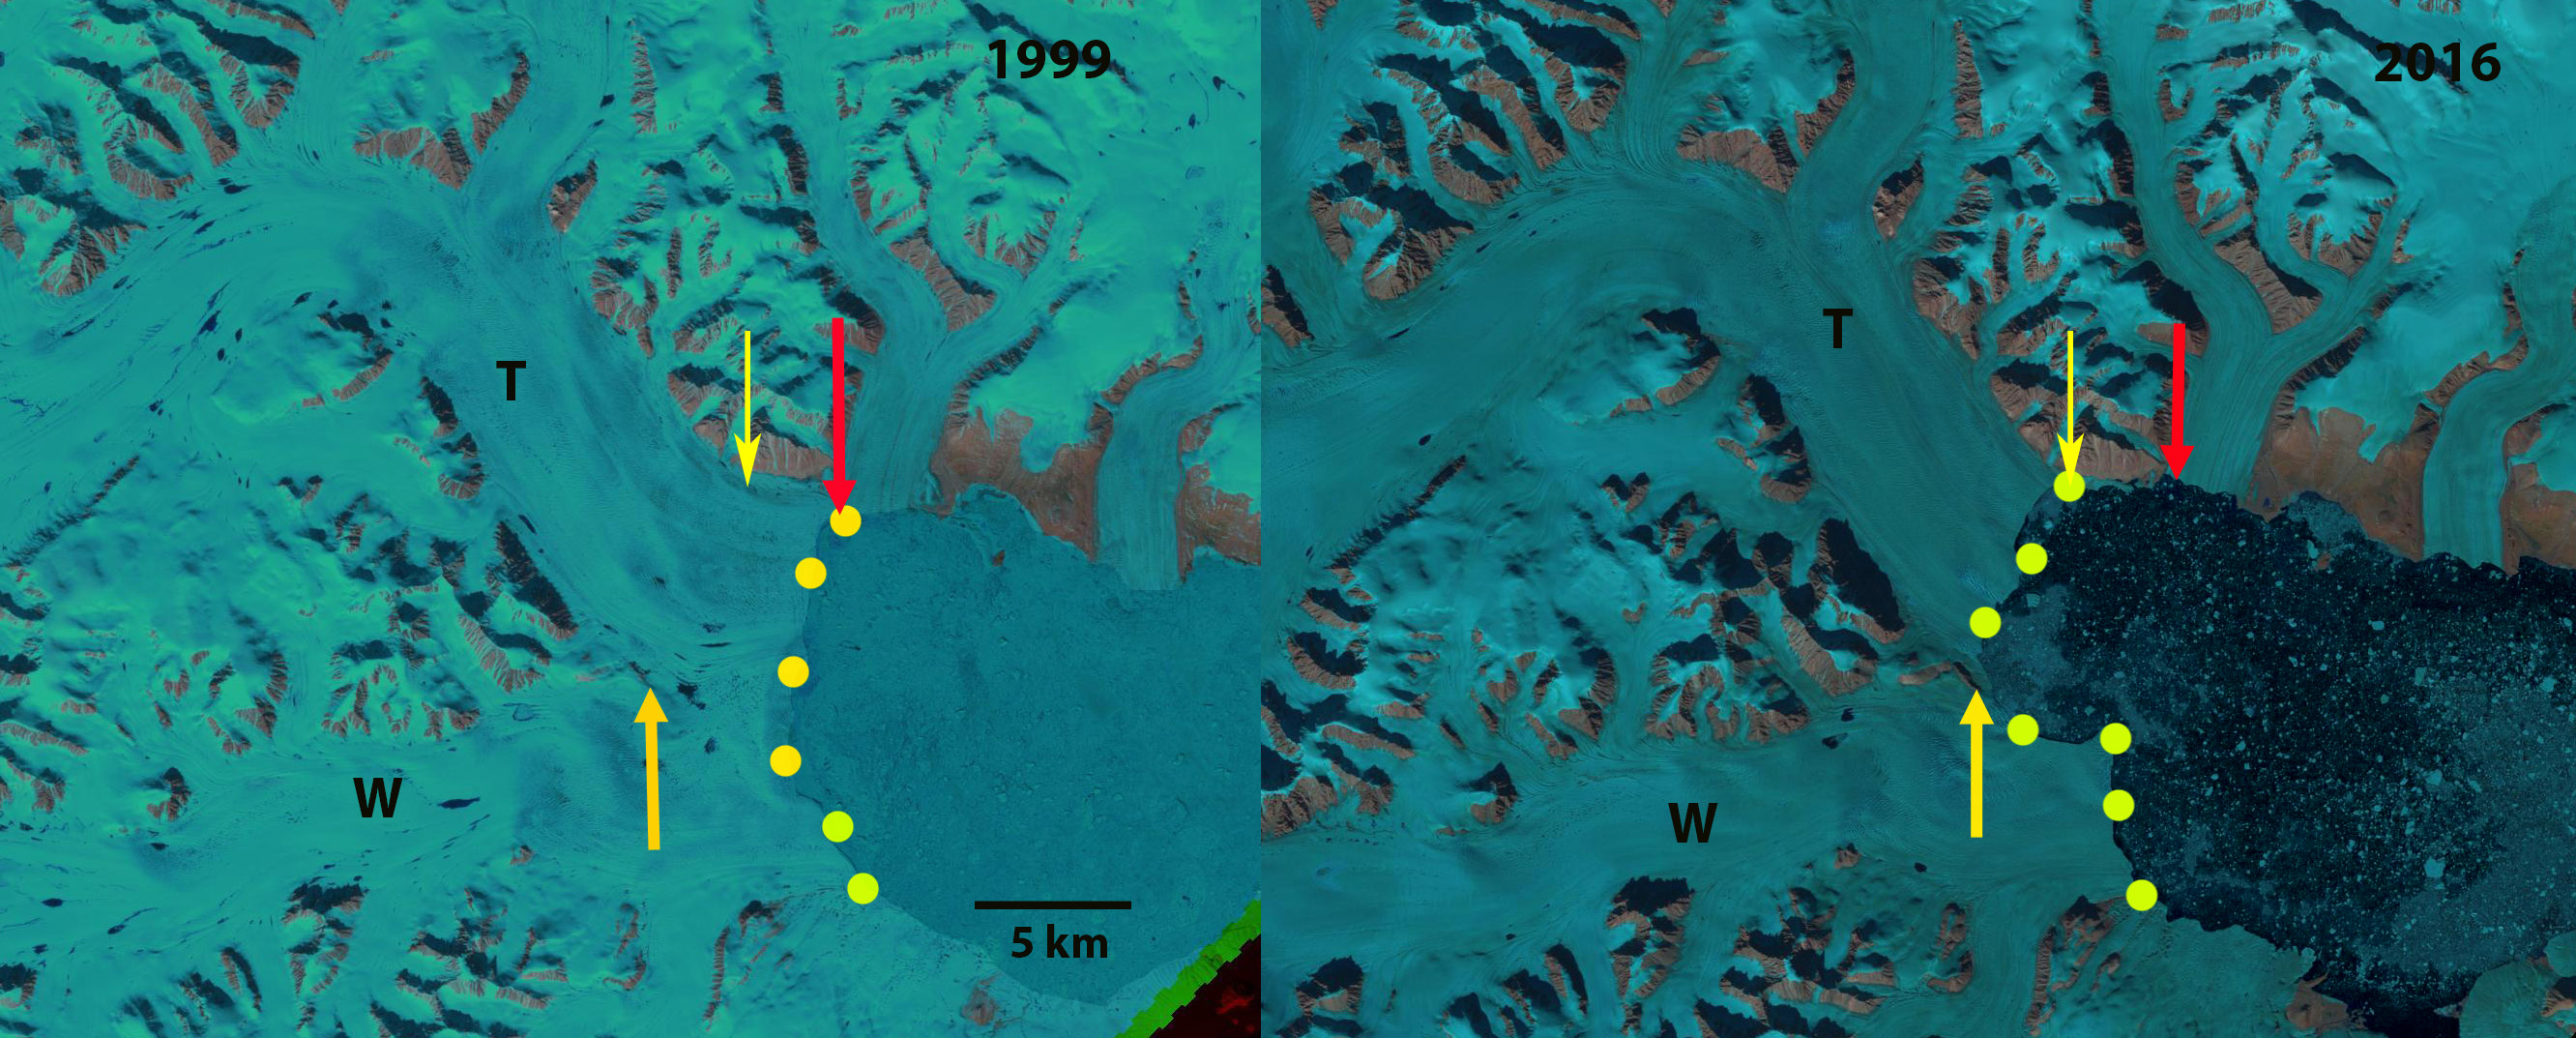
Trinity (T) and Wykeham (W) Glacier in 1999 and 2016 Landsat images. Red arrow indicates 1999 margin, yellow arrow 2016 margin, yellow dots the actual ice front.
Trinity (T) and Wykeham (W) Glacier flow east from Ellesmere Island into a fjord off of Nares Strait. Until recently the two have been joined just before the terminus. Millan et al (2017) observed glaciers in the region. They noted a change in ice loss from Queen Elizabeth Islands glaciers, during the 1991–2005 mass loss was 52% from ice discharge and 48% from surface mass balance. During 2005–2014, the mass loss increased dramatically with 10% from ice discharge and 90% from surface balance losses. They reported that Trinity and Wykeham Glacier had a stable velocity from 1991-2009 and doubled in speed by 2015. They noted a retreat of 1.8 km for Wyjkeham Glacier form 1991-2015 and 5 km for Trinity Glacier. Here we examine Landsat imagery from 1999, 2002, 2004 and 2016 to identify changes in the two glaciers.
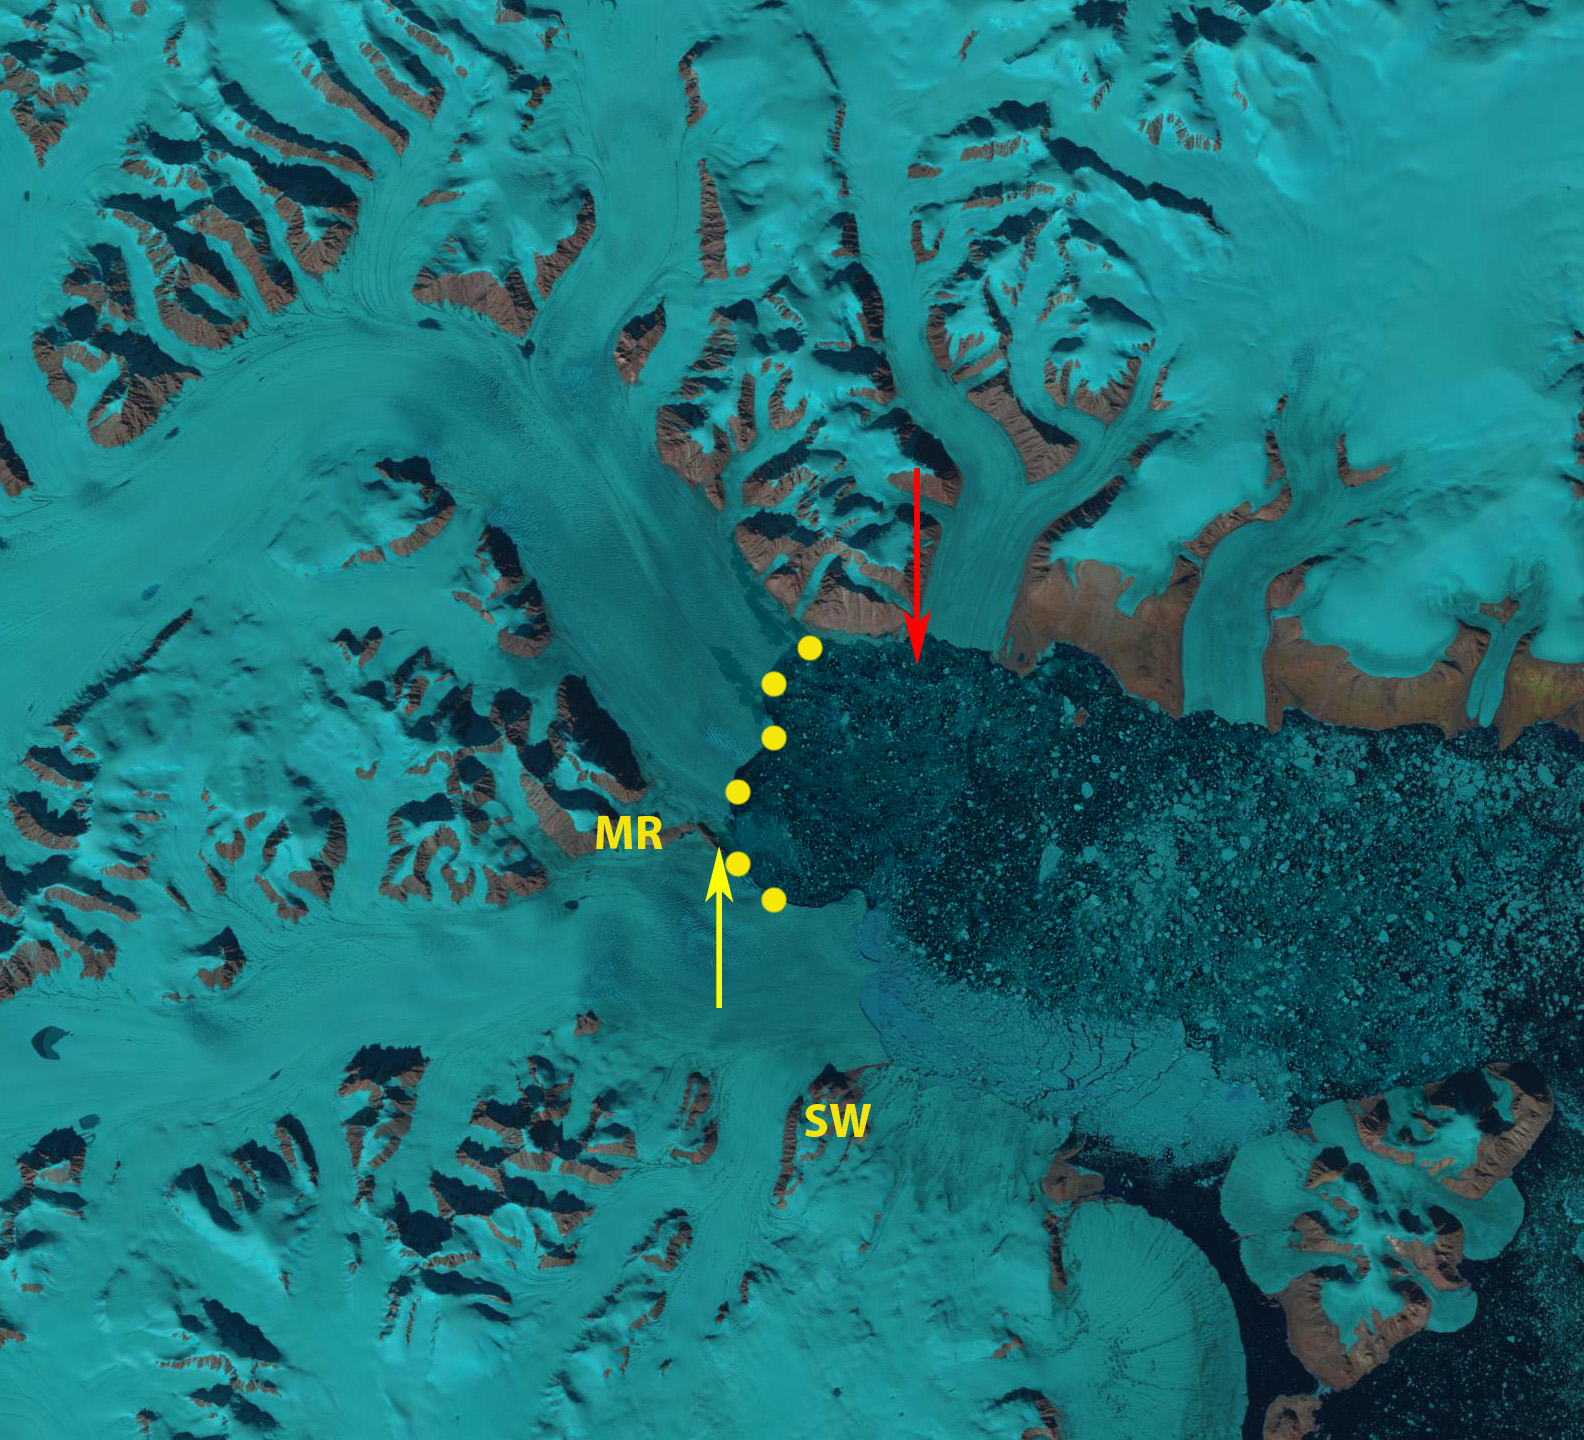
In 1999 the two glaciers are joined with a 14 km long ice front. The ice front of Trinity to the North extends to an outlet glacier entering the fjord from the north. The southern margin of the joint front extends 4 km beyond a mountain marking the southern entrance to what will be Wykeham Fjord (SW). In 2002 there is little change in the icefront. By 2004 Trinity Glacier has retreated 4 km along the northern edge and 5 km on the southern edge, now terminating at the eastern end of a ridge marked (MR). Wykeham Glacier has experienced a minor retreat. From 2004 to 2016 there is little change in the front of Trinity Glacier, while Wykeham Glacier has retreated 1.5 km along the southern margin. This illustrates the substantial ice discharge loss before 2004 of the two glaciers and limited ice discharge net loss after 2004, as Millan et al (2017) noted. The strong surface mass balance losses of recent years has led to thinning, which should drive further retreat. The two glacier will enter their own developing fjords. In 2016 it is evident that the melt area extends quite high on the glacier, bottom image. Melt ponds extend up to at least 800 m, purple arrows. The acceleration in 2015 if it continues will deliver a much higher flux further reducing volume and driving retreat. We have seen this pattern of thinning, acceleration and retreat on many glaciers typically driven by greater surface melt and frontal/basal melt, depending on flotation. The retreat here is similar to that of Mittie Glacier also on Ellesmere Island.

Trinity (T) and Wykeham (W) Glacier in 2002 Landsat image. Red arrow indicates 1999 margin, yellow arrow 2016 margin, yellow dots the actual ice front.
Trinity (T) and Wykeham (W) Glacier in 2004 Landsat image. Red arrow indicates 1999 margin, yellow arrow 2016 margin, yellow dots the actual ice front.

Trinity (T) and Wykeham (W) Glacier in 2016 Landsat image. Red arrow indicates 1999 margin, yellow arrow 2016 margin, yellow dots the actual ice front and purple arrows melt ponds.
 Dean of Academic Affairs at Nichols College and Professor of Environmental Science at Nichols College in Massachusetts since 1989. Glaciologist directing the North Cascade Glacier Climate Project since 1984. This project monitors the mass balance and behavior of more glaciers than any other in North America.