
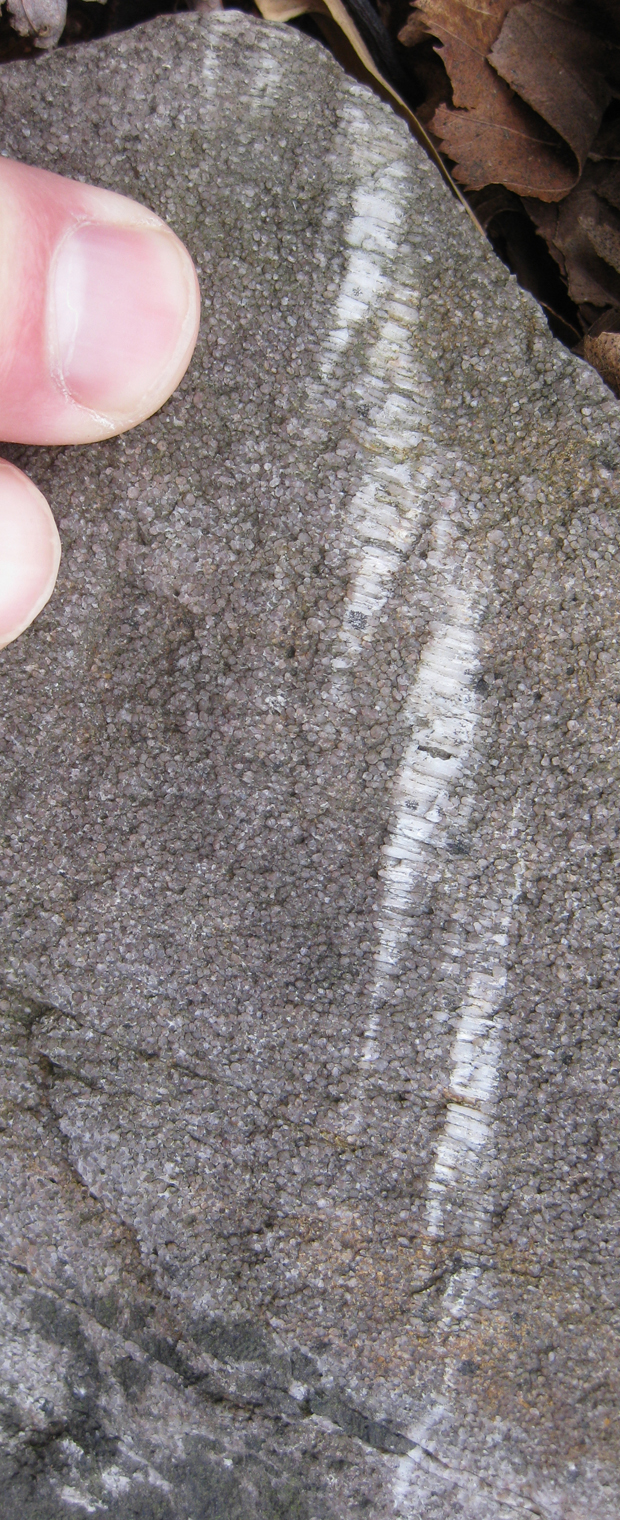
23 March 2011
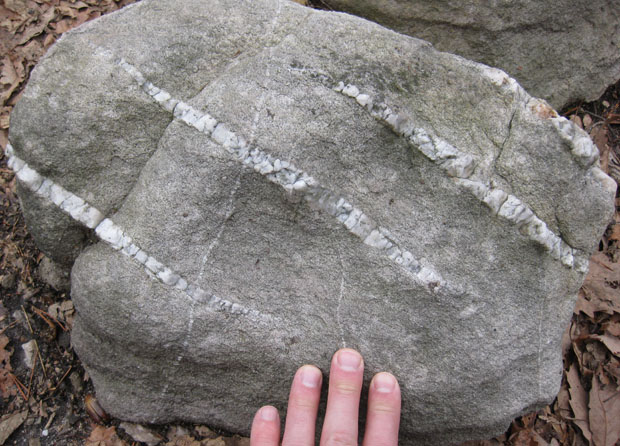
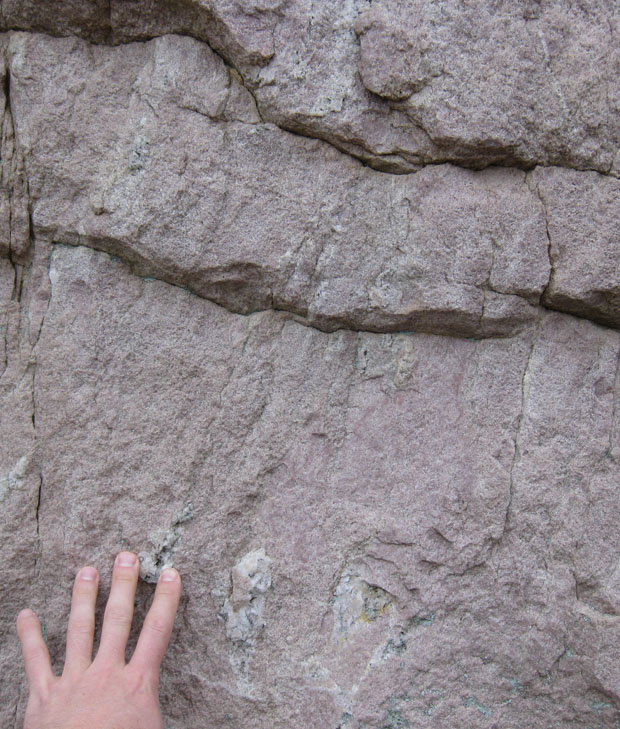
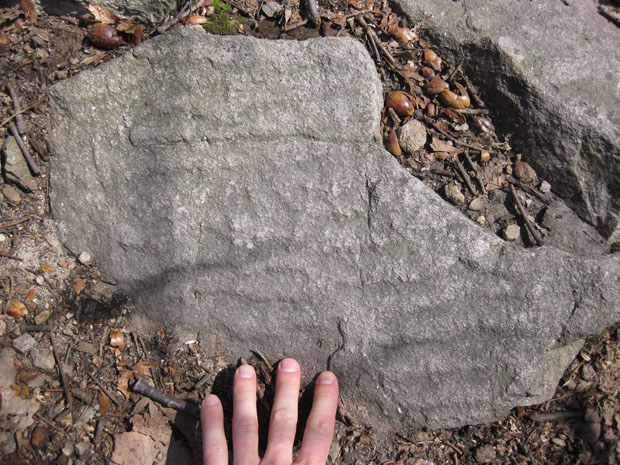
Shear band in a granite
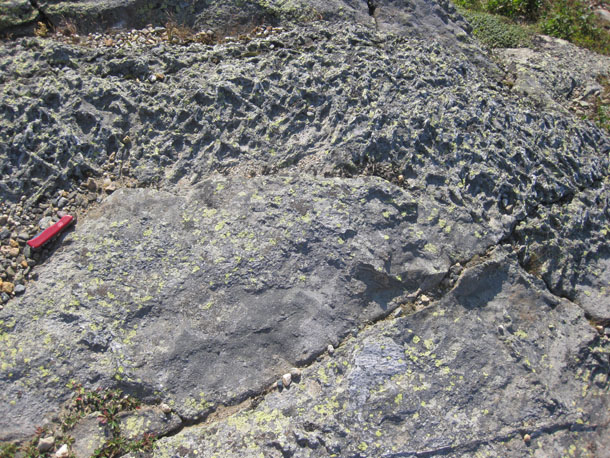
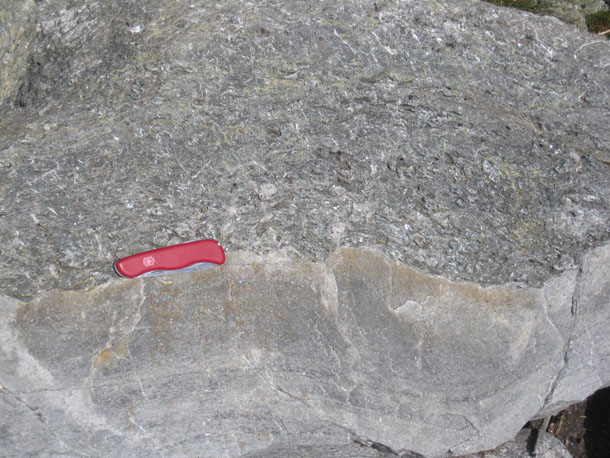
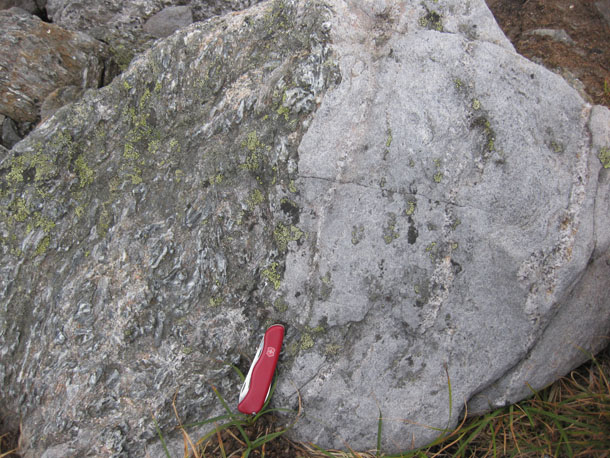
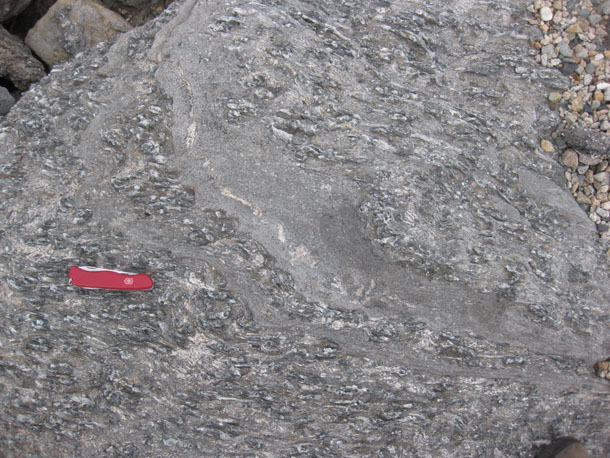
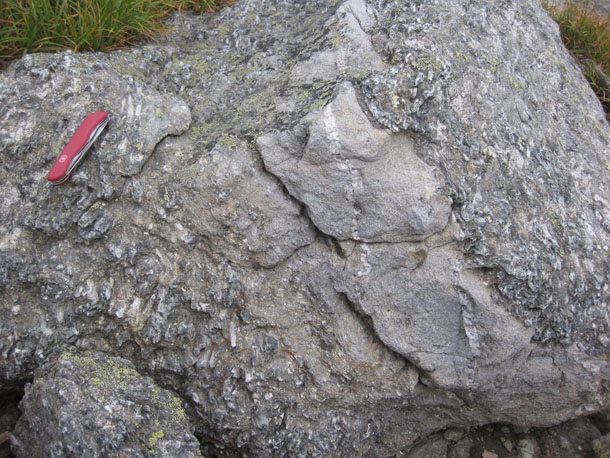
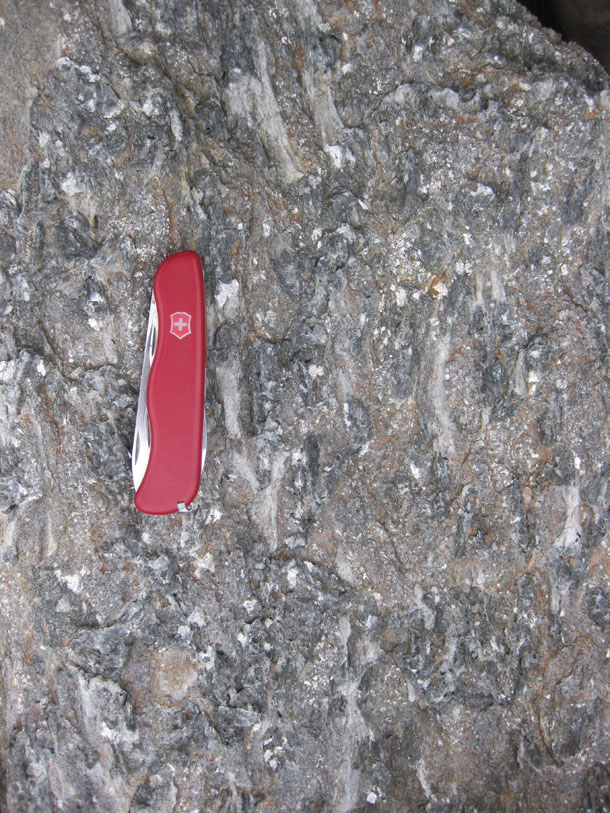
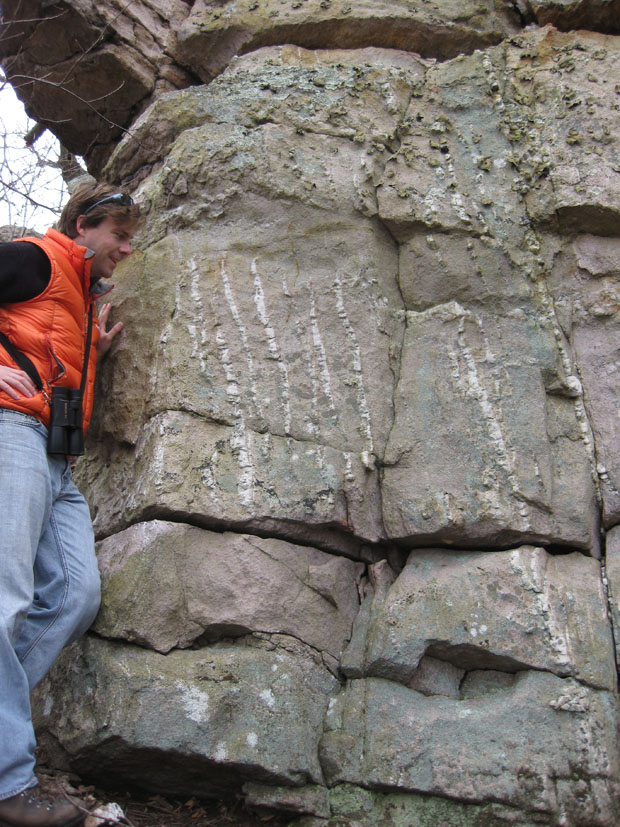
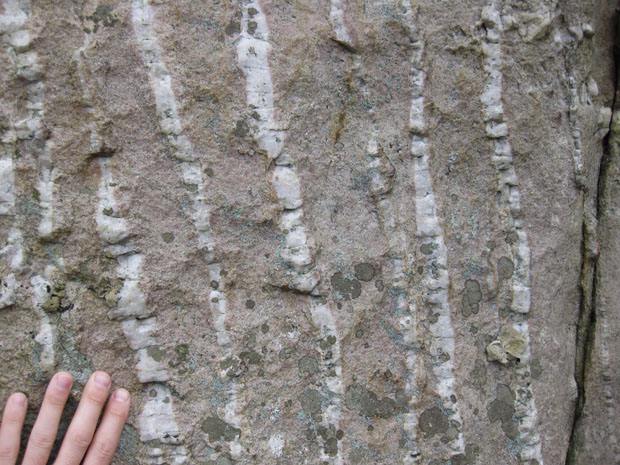
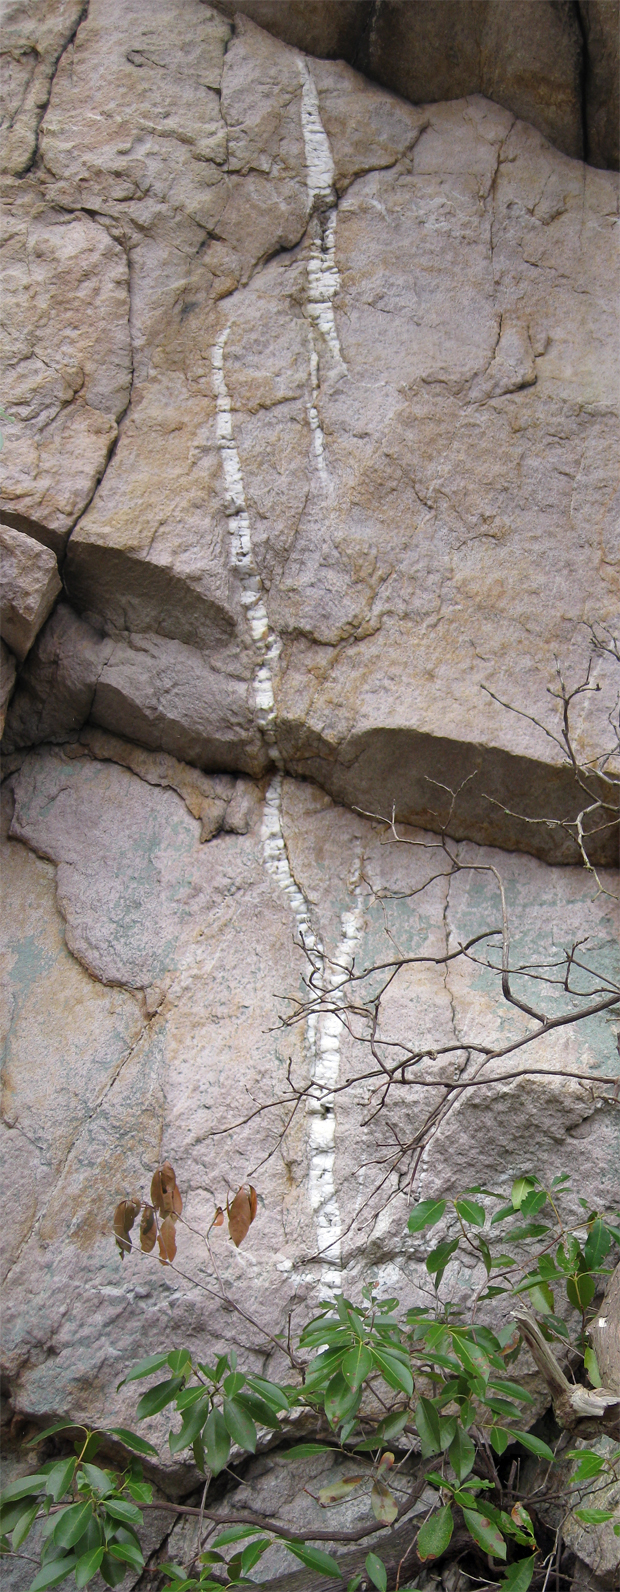
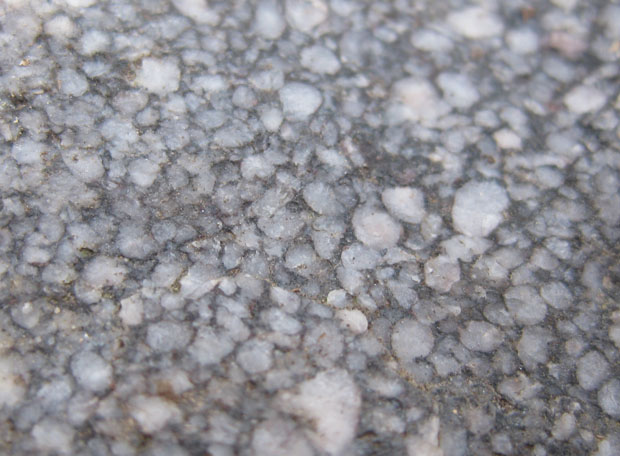
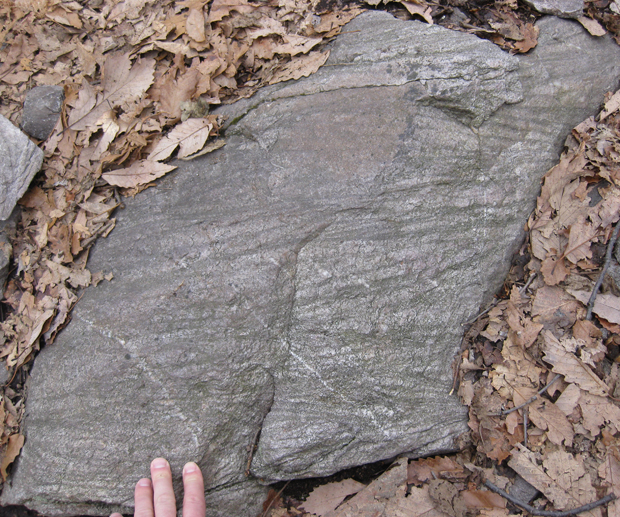
Walking back to my hotel after departing the Northeastern / North-central GSA section meeting on Sunday, I noticed this fine shear band cutting across a polished slab of granite on the exterior of an office building in downtown Pittsburgh:
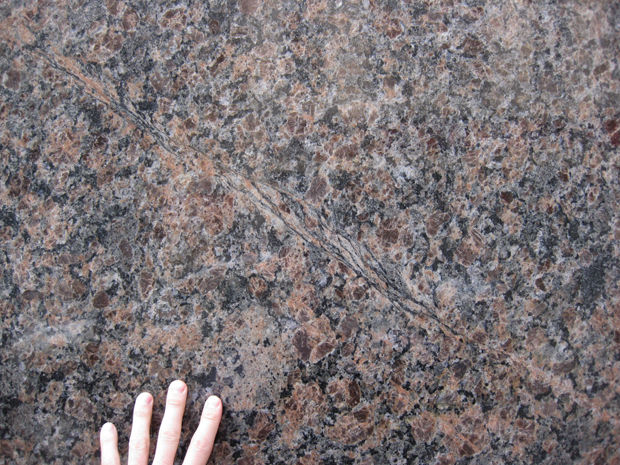
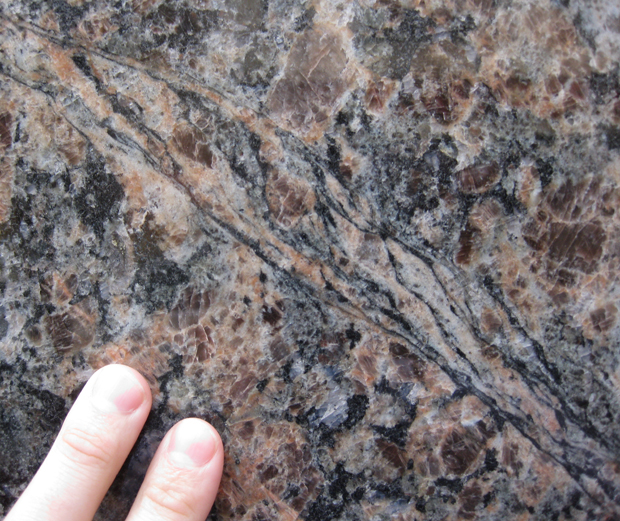
You’ll notice some grain-size reduction along that shear zone, and what looks to be a decent S-C fabric developed, with a sense of motion of top-to-the-left.
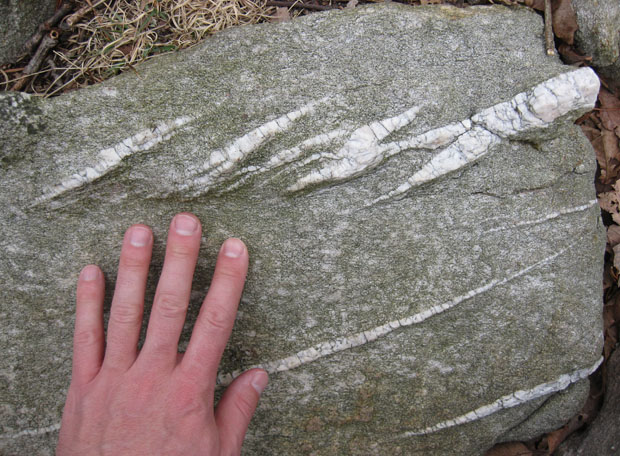
If you look at the larger structure, it looks like this central band is a step-over from one more discrete fault to another, and here the strain is more distributed through a lens-shaped body of granite, though still localized within that lens along the dark, mica-rich domains. Note how the larger fault seems annealed in the lower left (of the first picture) with feldspar and quartz.
Anything else you notice here?
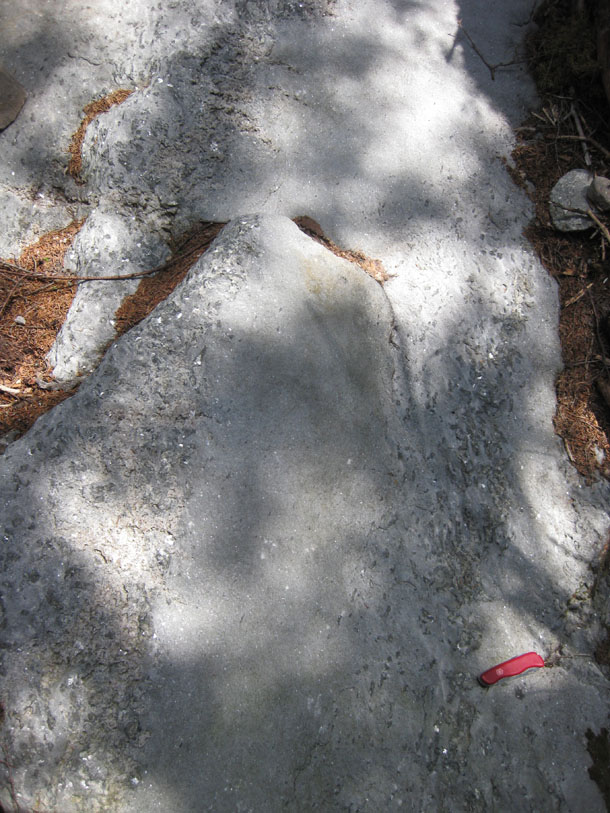
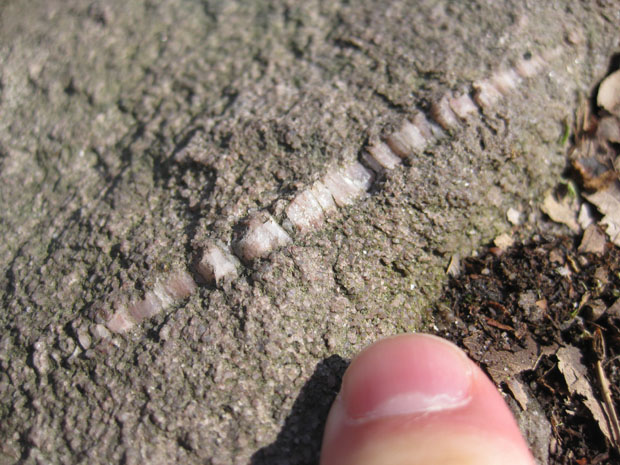
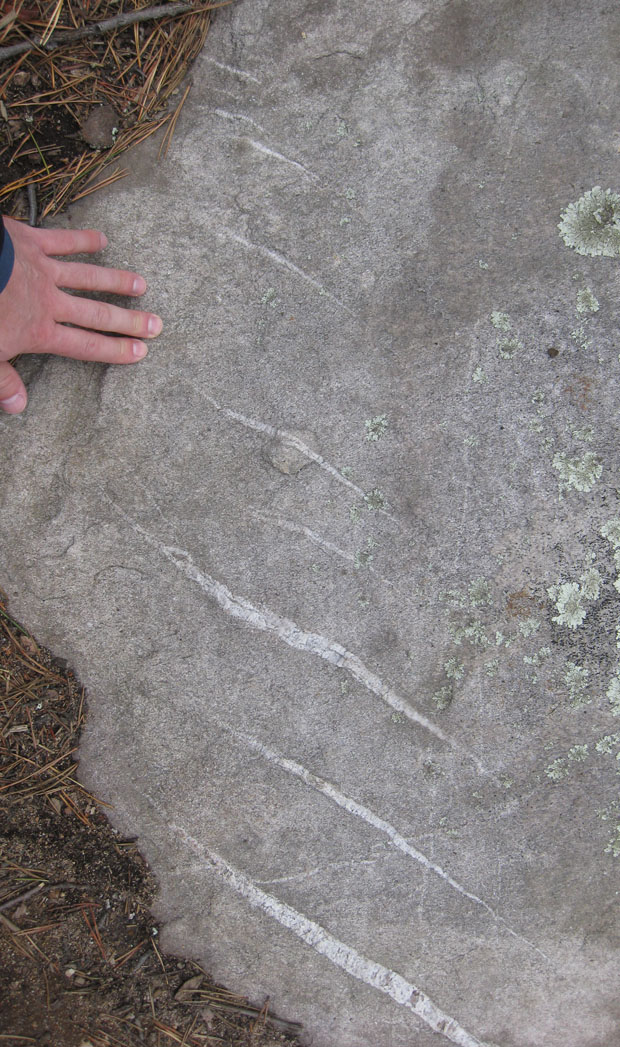
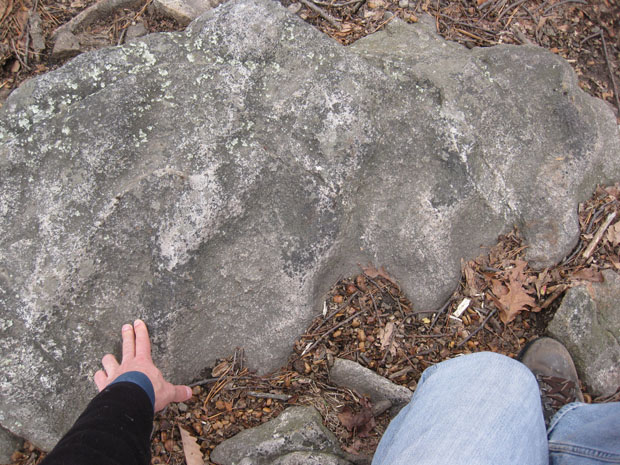
22 March 2011
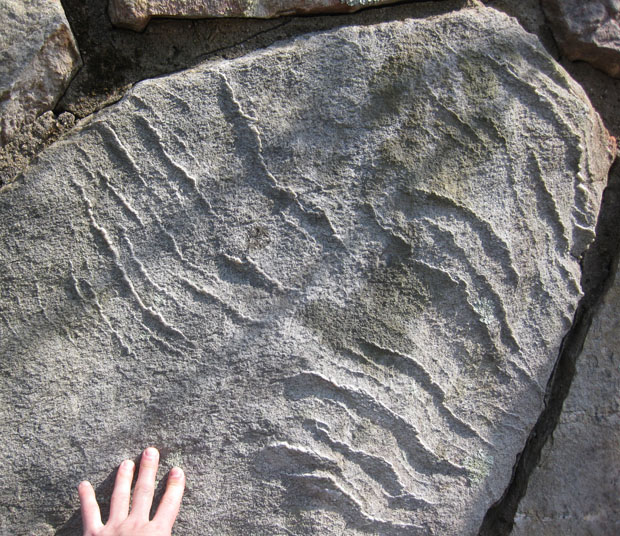
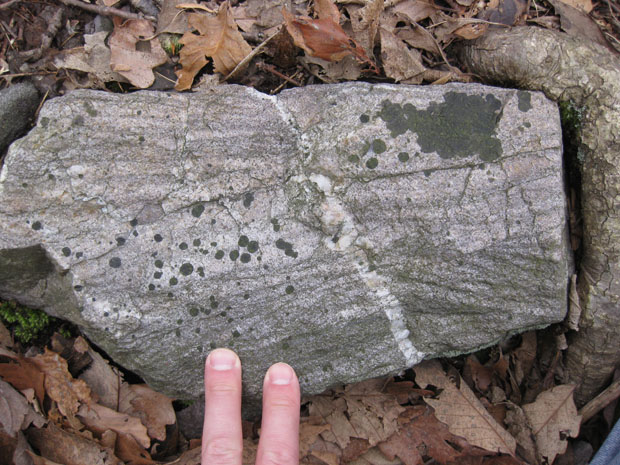
Glacial cobble
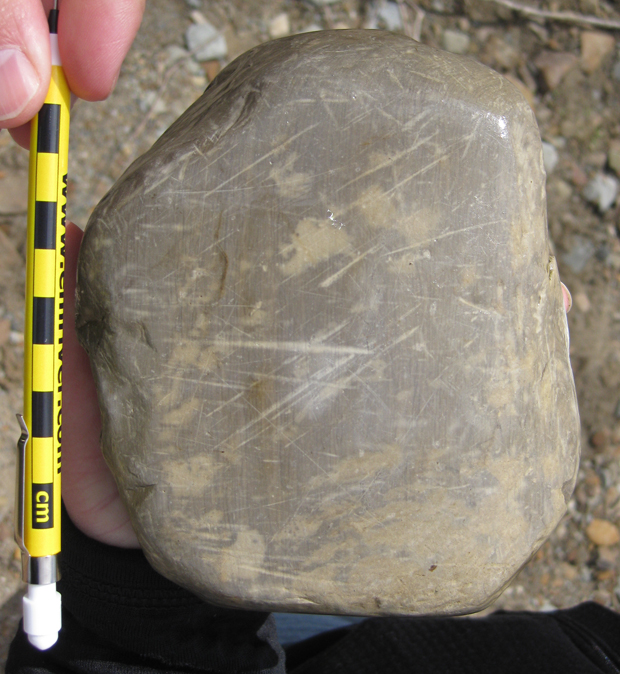
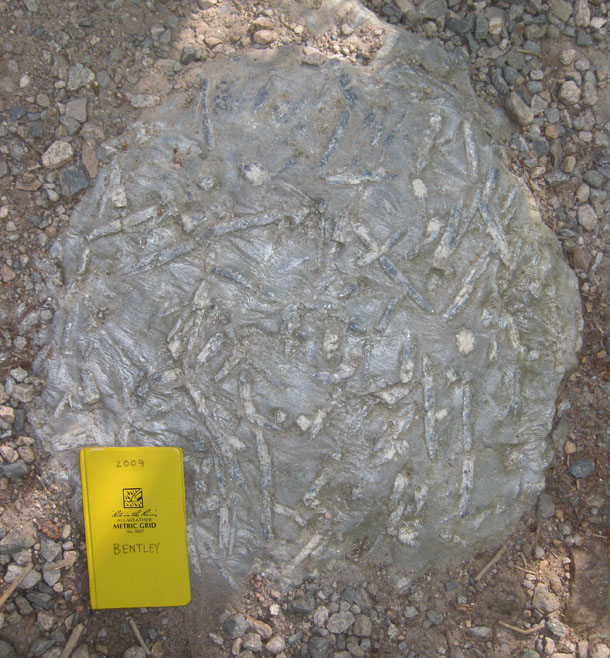
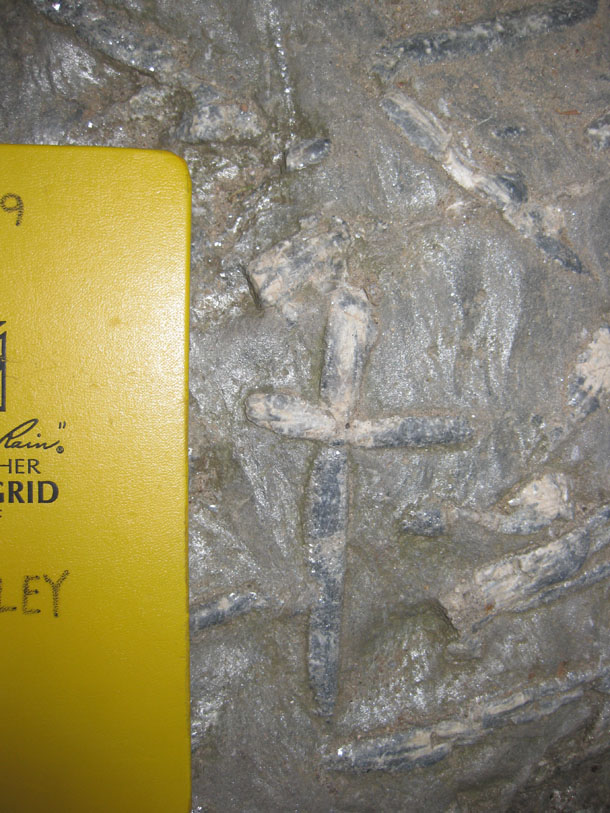
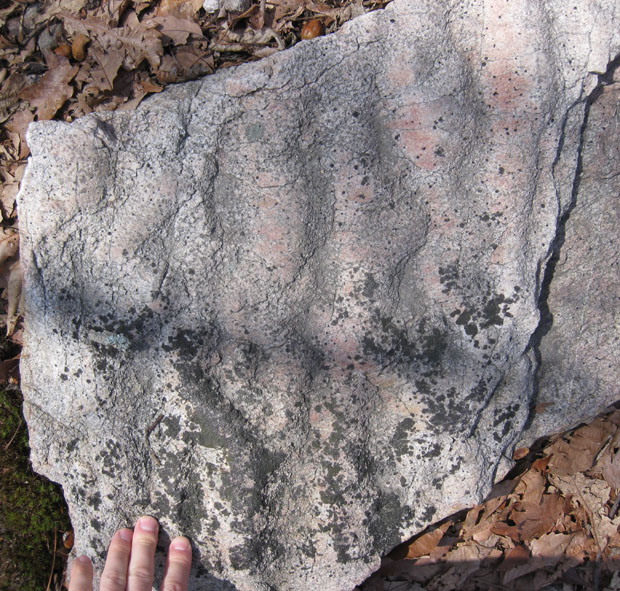
Saw this beauty on a field trip Saturday, examining the glacial geology of western Pennsylvania. Note the faceted surfaces and profusion of scratches of multiple sizes in multiple orientations.
21 March 2011
The Big Bentonite just got smaller
![]() The Shenandoah Valley of western Virginia records the switch in late Ordovician time from passive margin sedimentation associated with the Sauk and Tippecanoe epeiric seas, to active margin sedimentation associated with the onset of the Taconian Orogeny to the east. Higher up in the stack, a similar pattern is seen: a return to passive margin sedimentation with the deposition of the Helderberg Group of limestones, and then more active margin sedimentation as the Acadian Orogeny sloughs off huge quantities of siliciclastic sediment.
The Shenandoah Valley of western Virginia records the switch in late Ordovician time from passive margin sedimentation associated with the Sauk and Tippecanoe epeiric seas, to active margin sedimentation associated with the onset of the Taconian Orogeny to the east. Higher up in the stack, a similar pattern is seen: a return to passive margin sedimentation with the deposition of the Helderberg Group of limestones, and then more active margin sedimentation as the Acadian Orogeny sloughs off huge quantities of siliciclastic sediment.
Here’s a cartoon version of the stratigraphic column for the Shenandoah Valley and the strata exposed in Massanutten Mountain in its middle (the whole package is folded into the Massanutten Synclinorium):
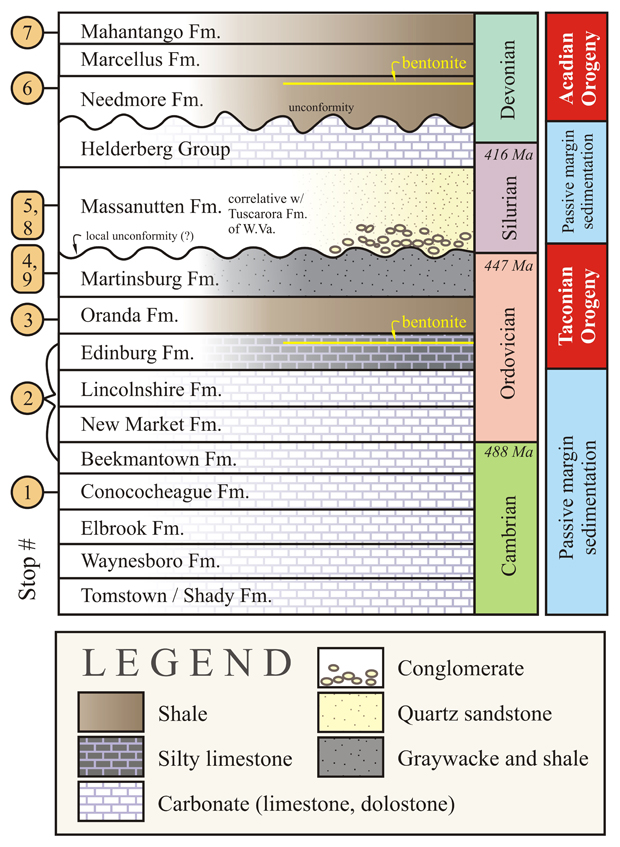
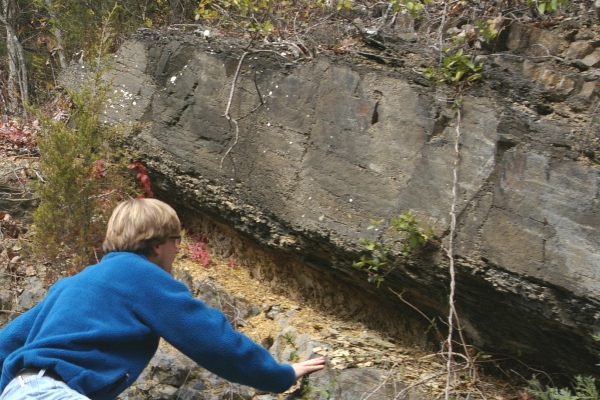
Notice how there are two yellow layers in there. These are distinctive packages of bentonite, weathered (devitrified) volcanic ash. Some of these bentonites make for superb regional “time-stamps” that aid in the correlation of strata at widely-dispersed locations. The Tioga Bentonite is an example of this — it’s found throughout the Appalachian Basin and was deposited when an Acadian volcano erupted in massive style. Deeper in the stack is the bentonite I would like to focus on today — the one found in the Edinburg Formation. Known as the Millbrig Bed in North America, this thick layer of (formerly) volcanic ash outcrops as a distinctive yellowish-brown layer that weathers away much faster than the silty limestone above and below it. Here’s a shot of the thickest bentonite (what I guess to be the Millbrig Bed) on the classic “Tumbling Run” outcrop south of Strasburg, Virginia:
The interesting thing about the Millbrig Bed is that it has been correlated with another bentonite layer, on another continent. The Kinnekulle bed, also known as the “Big Bentonite,” is a distinctive stratigraphic marker in Scandinavia. Because they were erupted at about the same time (~454 Ma), stratigraphers have correlated the two, saying they are the same ash bed, deposited from a truly enormous volcanic eruption – presumably from a volcano somewhere out in the Iapetus Ocean.
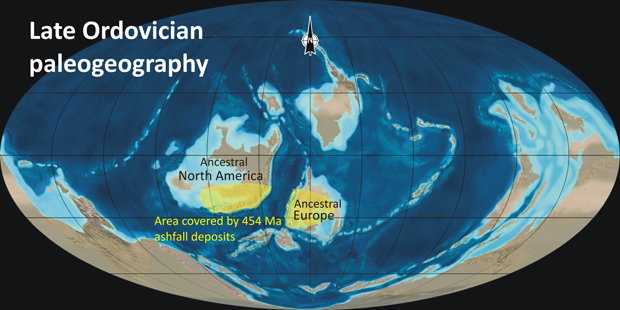
(source: Ron Blakey, Northern Arizona University, then modified by me)
A new paper in Geology by Bryan Sell and Scott Samson of Syracuse University examines whether the European and North American bentonites really match up, however. They find that, on a geochemical basis, they are unlikely to be from the same eruption.
Sell and Samson examined trace elements in crystals of apatite which grew as phenocrysts in the source magma, and were entrained in the ash cloud as it erupted. The trace elements in these crystals can vary widely from eruption to eruption, and so they serve as a good geochemical “fingerprint” that allows us to source the eruption to a specific volcano. They sampled the Millbrig bed in southern Virginia (near the town of Hagan), and used “Big Bentonite” samples from the island of Bornholm, Denmark.
Here’s the key figure in their new paper, (modified and colored by me):
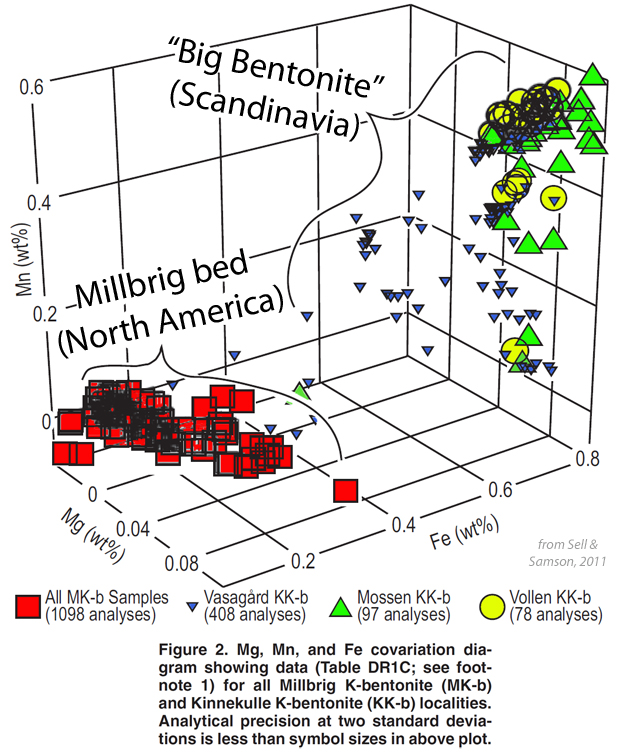
“MK-b” is the North American bentonite; KK-b is the Kinnekulle bentonite of Scandinavia. The key thing to note is the two distinct clusters of data: One in red shows analyses from the Millbrig bed; the yellow, blue, and green show analyses from the “Big Bentonite” in Scandinavia. Based on iron, magnesium, and manganese concentrations, these are two different geochemical fingerprints. Though Scandinavia and Virginia both swallowed a lot of volcanic ash in the late Ordovician, the authors conclude that:
The differences between the MK-b and KK-b in apatite trace element concentrations are so great that they cannot be considered the same bed. This is also true of the intrabed samples; there are no subsections in the MK-b that are similar to any of the vertical subsections in the KK-b. Thus we conclude that no portions of the two beds correlate.
And there you have it. The Big Bentonite isn’t so big after all. It’s two bentonites from two eruptions.
It will be interesting to see how this affects tectonic reconstructions of the position of North America and Baltica during the late Ordovician.
_________________________________________________________________________
Sell, B., & Samson, S. (2011). Apatite phenocryst compositions demonstrate a miscorrelation between the Millbrig and Kinnekulle K-bentonites of North America and Scandinavia Geology, 39 (4), 303-306 DOI: 10.1130/G31425.1
18 March 2011
Friday fold: OSF migmatite
Migmatite schist sample from Orange Springs Farm, near Unionville, Virginia, with cm-demarcated pencil for scale. Sample was cut and polished. Here’s what the untreated sample looks like:
[youtube=http://www.youtube.com/watch?v=XDDcLVp_4Ss]
Happy Friday. Enjoy your weekend. I’m off to the Northeastern / North-Central joint section meeting of the Geological Society of America today. We’ll see if my time in Pittsburgh gives me enough time to blog or not…
17 March 2011
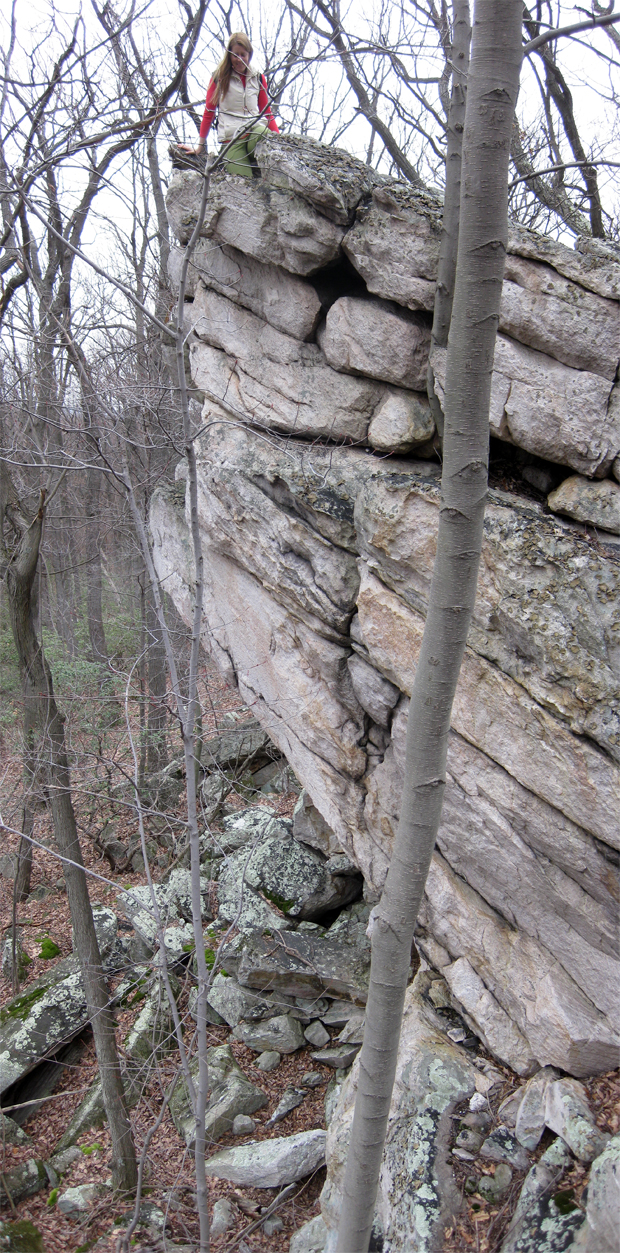
Mount Washington 3: turbidites and their metamorphism
After my cousin Brad caught up with us after our Pinkham Notch roadcut excursion, we started up the trail at Tuckerman Ravine, and then detoured to go via the Lion Head.
Immediately, we began to see some freaking awesome metamorphic porphyroblasts.
During the Acadian Orogeny (in the late Devonian), the original muds and sands (deep sea turbidite deposits) of the Littleton Formation were metamorphosed. Pale-pink andalusite formed (that’s where these distinctive shapes come from) and then that metamorphosed into white, fibrous sillimanite and eventually retrograded to sericite (muscovite), which I take to be the identity of the gray portion of these partial pseudomorphs. (Petrologists, does that sound right?)
Here’s a formerly sandy layer (top; above the knife) which has been fused to quartzite, and a formerly-muddy layer (most of the outcrop; below the knife) that has been metamorphosed to schist bearing these distinctive pseudomorphs of andalusite:
Same deal here, at the Cragway Springs pull-off mentioned last Friday:
Mud above, sand below — the mud had the right cocktail of elements to provide for the growth of the large metamorphic crystals; the sand had nothing but quartz.
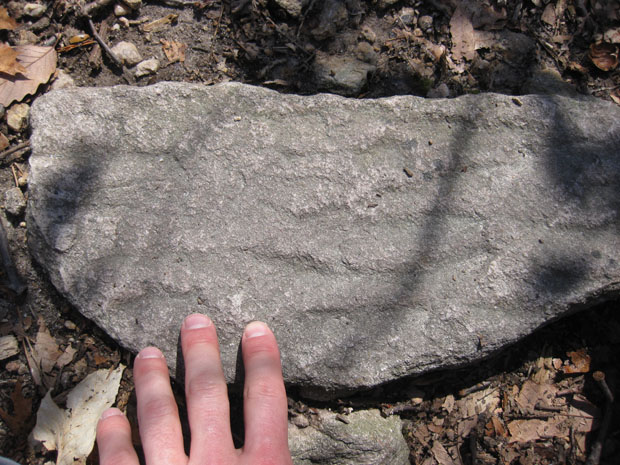
Next up, some metamorphosed graded beds, as noted over the summer. The photos that follow show outcrops and float as seen from the trail, where a tree recently peeled over and exposed them:
Same beds, from a different perspective, with “paleo-up” being photo-“down”…
Here’s another metamorphosed graded bed, seen in a boulder on top of the mountain – again, paleo-up is “down” on the basis of the crisp transition from porphyroblast-rich former-mud and porphyroblast-poor former-sand:
Zoomed in a bit:
Down in Tuckerman Ravine itself, we espied a few more metamorphosed graded beds:
Exposure is not as good here, but here’s what looks to me like right-side-up metamorphosed graded beds:
Two more on the summit boulder pile: paleo-up is to the right here…
…and here:
Same thing here, I think — paleo-up to the right:
This one shows the opposite — paleo-up is to the left. Nice gradation in that direction, whereas there is a nice crisp contact (however deformed) at the right:
Zooming in on a few more porphyroblasts for a last, lingering, loving look:
More later from elsewhere on the mountain…
16 March 2011
Video book review: Roadside Geology of Maryland, Delaware, and Washington, D.C. by John Means
15 March 2011
Less U.S. concern for climate change
A new poll by Gallup suggests that the proportion of the U.S. population concerned about climate change has dropped to an almost record low (51% of the “polled population worrying about climate change a great deal/fair amount”). The data are interesting to look at:
 (source)
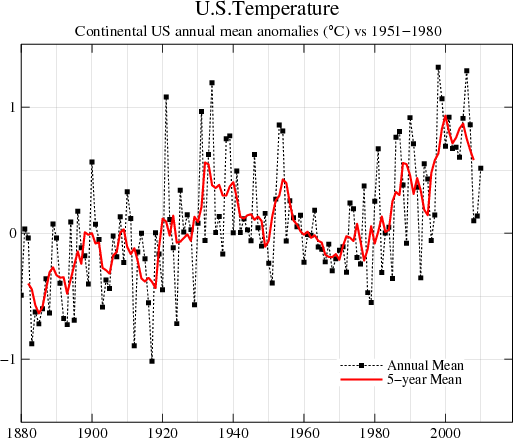
I thought I detected a little pattern here with the numbers waxing and waning, and so I went to NASA’s GISS dataset for the U.S. temperature anomaly to check out my hunch:
 (source)
Aha! Sure enough!
Can’t see it? Let me put the two graphs together on the same temporal scale:
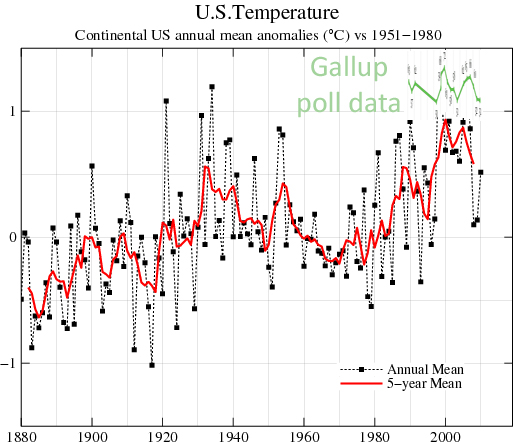
They both peak and fall in tandem. If it’s hotter out than it was last year, people worry about climate change. If it’s colder out than it was last year, they don’t worry as much. For the time in which they overlap, the two data sets show a beautiful correlation.
In terms of people’s opinion? …It’s the weather, stupid.
But we’ve only been polling people about climate change since 1989. We have temperature records that go back a lot further than that — it’s a more robust data set. If you fit a trend line to the temperature data, it shows a positive slope. If you fit a trend line to the opinion data, it’s a flat-liner.
Therein lies the problem.
New GPS vectors
Just wanted to call your attention to two new maps showing GPS displacement vectors from Japan. (Barry left links to these images in a comment yesterday.) These images are hosted on the website of the Geospatial Information Authority of Japan, and though I can’t read the Japanese to verify their authorship, I presume that agency produced them as well. They are easier to read than the one I posted on Saturday morning, and they include additional information about the vertical component of displacement.
Horizontal motion between March 1 at 11pm and March 11 at 3pm:
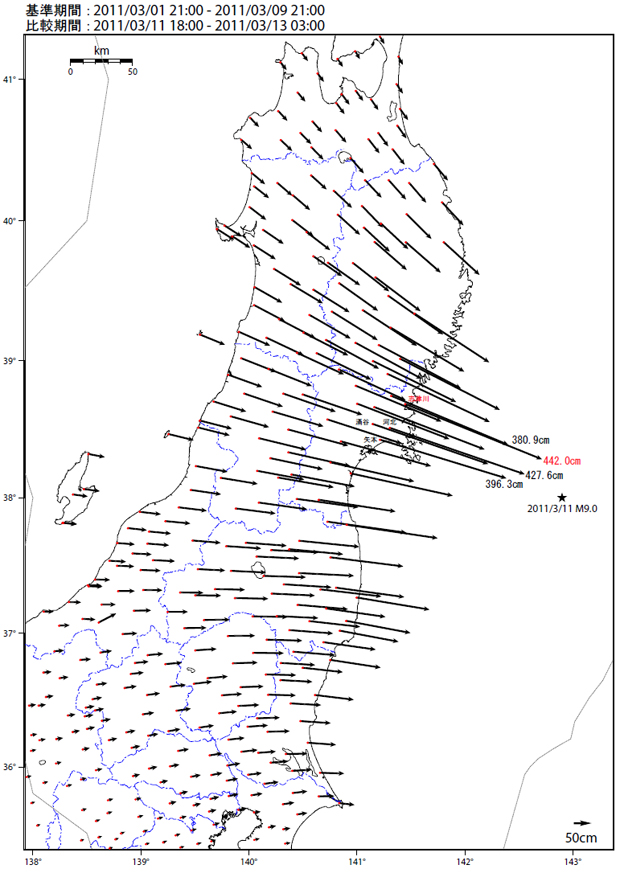
The biggest one shows a maximum displacement of 4.4 m! And this, keep in mind, is on the land-based receivers on Honshu. (Of course, there would be more displacement on the seafloor closer to the epicenter, but we don’t have GPS receivers mounted there. If this is your first time looking at one of these maps, let me point out that the arrows are not drawn at the same scale as the underlying map. A scale for the base map is in the upper left, and a separate scale for the GPS-measured displacement vectors is in the lower right.
Here’s vertical displacement between March 1 at 11pm and March 11 at 3pm:
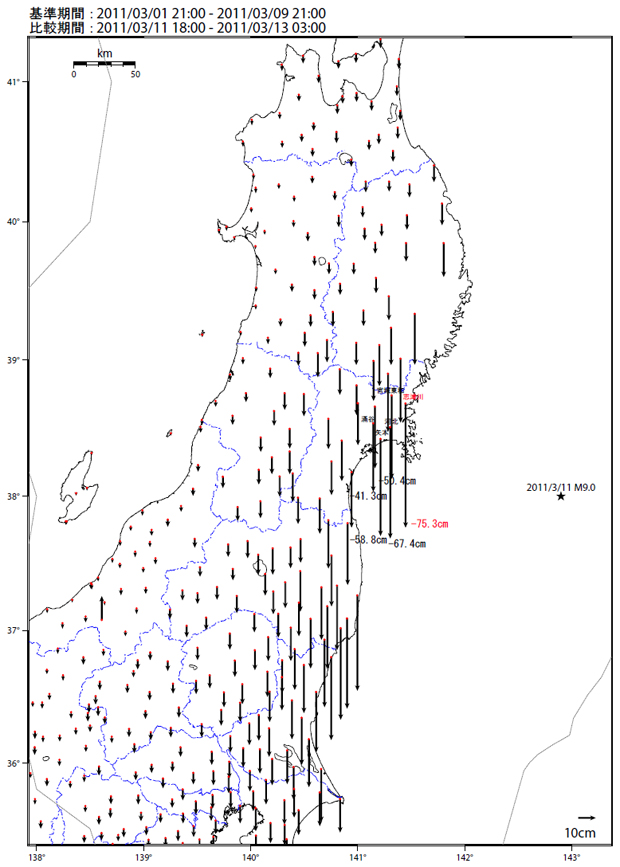
At first, I found it surprising that the land dropped in elevation, in some places by as much as 75 cm (~2.5 feet) as a result of the quake. Initially, I would have guessed it would increase in elevation instead, since northern Honshu is climbing up relative to the subducting Pacific Plate beneath it. Upon reflection, however, what I think was happening is that the crust beneath Honshu was flexing upward as stress built up on the fault (i.e., before the earthquake), then at the moment of slip, this “arched” crust of Honshu relaxed back into a wider, lower configuration. That’s also the interpretation presented by this video, which I highly recommend watching if you haven’t already.
[youtube=http://www.youtube.com/watch?v=RVaDXsqLUtI]
That also would explain some of the lingering flood effects shown in these before/after satellite images of the coast of Sendai: the shore is lower than it was before the quake!
The Sendai Supersite shows a plot of displacement as measured in the vertical dimension, latitude, and longitude, for a GPS measurement station at Mizusawa, a city north of Sendai on Honshu. According to the description on that web page, this is work done by a graduate student named Simon Banville at the University of New Brunswick. Please consult the Supersite for a full list of credits for this work, including information sources. I’ve redrawn his figure (to make it display better in this space) here:
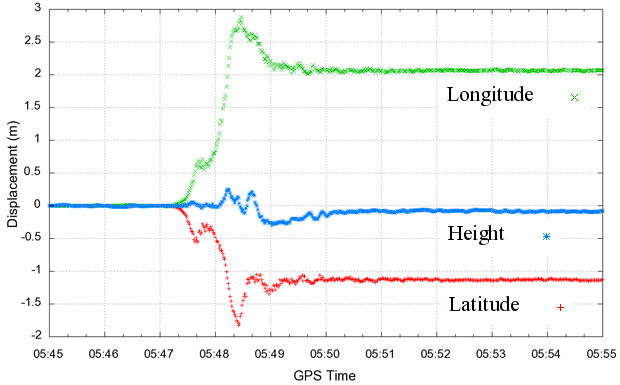
The vertical axis of the plot shows displacement in meters (1 m = 3.28 feet). The horizontal axis shows the passage of time. For Mizusawa, the action starts at 5:48 and ~20 seconds GPS time. Overall, the plot shows the station moving 3.5 meters (11.5 feet) to the east-southeast during the first minute of shaking, and then shifting back a bit, ultimately coming to rest at a final position 2.3 meters (7.6 feet) east-southeast from its pre-earthquake location. This adjustment takes about two minutes, during which waves with amplitudes approaching a quarter of a meter (~9 inches) roll through.
So Mizusawa ends up ~10 cm lower in elevation as a result of this event. I wonder what a similar plot would look like for Sendai itself, given those -75 cm vertical displacement vectors on the coast…
I’m grateful for scientific agencies and geology departments like the Japanese Geospatial Authority and the University of New Brunswick for sharing this information with the world via the Internet immediately after a big event like this. It helps the rest of us immeasurably in coming to terms with the magnitude of the event.
What are your thoughts on these displacements?
Sugarloaf III: Tension gashes
Background geology of the Sugarloaf Mountain area. (March 2010)
Primary structures in the meta-sandstone of the Sugarloaf Mountain Quartzite. (yesterday)
Background on tension gashes. (August 2010)
14 March 2011
Sugarloaf II: Primary structures
You’ll recall that I detailed a trip to Sugarloaf on this blog back in March of last year. Well, on Saturday (March of this year), Lily and I returned to this distinctive knob of quartzite for a five-mile hike. Along the way, we saw plenty of metamorphosed quartz sandstone (now quartzite), which was similar to what we saw on the previous Saturday’s hike, to Buzzard Rock on the northeast tip of Massanutten Mountain. However, it’s (probably) much older, and it’s certainly more messed up by mountain-building.
The main geological features of the trip were: rare examples of primary structures (cross-bedding and ripple marks) and numerous examples of tension gashes filled with milky quartz. How about a post for each? Let’s start with the primary structures…
In a nutshell, here’s what doing geology at Sugarloaf is like, 90% of the time:
That’s a spot where a tree was growing on a big boulder of the Sugarloaf Mountain Quartzite, and then the tree died, and peeled off the rock face, falling across the trail. Where it was protecting the boulder, you can see gleaming white quartzite, and next to where-the-tree-used-to-be, you can see the more typical exposure — which is to say, not much exposure. The available rock surface is colonized by an array of lichens, mildew, and mosses, such that the rock itself is almost totally obscured. Here’s a closer look:
That, my friends, is east coast geology in microcosm. The rock here is a quartz-rich metasandstone of putatively Cambrian age. In most places it is cemented with quartz, but there were some places where it appeared to have a hematite cement, like in these two samples:
Closer in to this same sample:
In places, it has kind of a purple-pink tinge to it, like here:
It outcrops in places in big cliffs, splitting along subparallel planes that are probably bedding (hard to tell, thanks to the mostly-homogenous texture of the rock, and all those damned lichens):
So that’s the rock. Here are a few examples of primary structures. First, the ripple marks:
Big, sinuous ripples:
Same set of ripples, viewed from the opposite direction:
I was lucky to finds lots of quality cross-beds on my hike, assuming that by “lots” we are talking relative to east coast standards in the thoroughly metamorphosed Piedmont province. So, if you literally translate “lots,” we’re talking about six examples over four hours. Here’s a few of them:
This last one is cross-cut by a vein of milky quartz, which is convenient, because that’s the next thing I want to talk about… tomorrow!
 Callan Bentley is Associate Professor of Geology at Piedmont Virginia Community College in Charlottesville, Virginia. He is a Fellow of the Geological Society of America. For his work on this blog, the National Association of Geoscience Teachers recognized him with the James Shea Award. He has also won the Outstanding Faculty Award from the State Council on Higher Education in Virginia, and the Biggs Award for Excellence in Geoscience Teaching from the Geoscience Education Division of the Geological Society of America. In previous years, Callan served as a contributing editor at EARTH magazine, President of the Geological Society of Washington and President the Geo2YC division of NAGT.