

8 October 2019
Samothraki: the role of goats in increasing landslide hazard
Samothraki: the role of goats in increasing landslide hazard
There is an interesting set of articles in a couple of the Greek facing online newspapers at the moment about the landslide problems on the island of Samothraki (which is sometimes written Samothrace) in Greece. This is a small island (with an area of 178 km² and population of 2859, it extends over 17 km from east to west). Samothraki is described in Wikipedia as being one of Greece’s most rugged islands:-
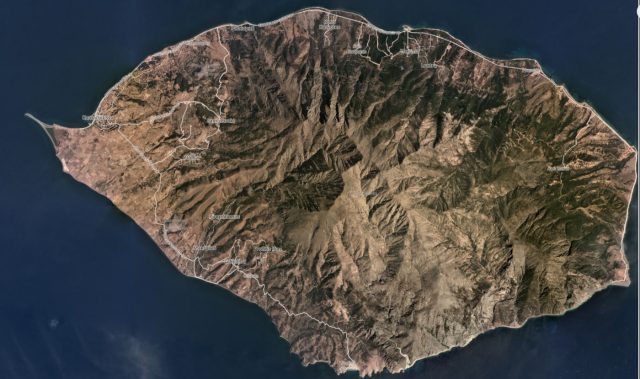
Planet Labs three month composite image of the island of Samothraki. Image copyright Planet Labs, used with permission.
.
Unfortunately, the ruggedness of the island has meant that farming has been a challenge, which has led the population to farm goats, allowing them to roam with little control. Unfortunately the population of goats boomed, reaching 75,000 by the late 1990s. The goats stripped the island of its natural vegetation, and prevented regrowth. This has left the island bereft of its natural protection against landslides, resulting in high vulnerability to heavy rainfall. In September 2017, the island suffered floods and landslides as a result:-
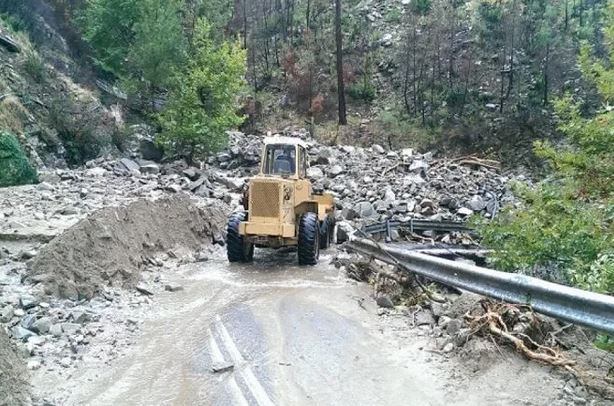
The aftermath of the heavy rainfall in Samothraki in September 2017. Image from Keep Talking Greece.
.
This is of course a classic example of the Tragedy of the Commons, in which individual action as a result of self-interest leads to outcomes that are contrary to the common-good. The goat population has now dropped to about 50,000, and the lack of food means that the animals have a low value, but without support it is difficult to change the farming method. The upshot is that the vulnerability of the island remains high, and with rainfall likely to increase in intensity as the effects of global heating continue to develop, further landslides are inevitable.
Fortunately, an effort is now underway to reverse the problem. A sustainability initiative, led by the Sustainable Samothraki Association is seeking solutions to the goat crisis, with the aim of achieving UNESCO Biosphere Reserve status. This is not simply a nice-to-have initiative, but a genuine and essential attempt to improve the islands to the benefit of the population, and to reduce losses from landslides and floods.
This same situation of rampant environmental destruction is playing out in many other upland areas around the world; similar initiatives are needed in many places as part of our efforts to reverse the unacceptable levels of damage we are inflicting on our environment.
Reference
Planet Team (2019). Planet Application Program Interface: In Space for Life on Earth. San Francisco, CA. https://www.planet.com/
7 October 2019
A successful landslide forecast from Heifangtai, Gansu
A successful landslide forecast from Heifangtei, Gansu
Back in 2017 I wrote about the hazards from loess landslides at Heifangtai in Gansu province of China. The focus of the piece was the failure of steep slopes in loess deposits, which can mobilise into deadly flowslides.
On Twitter, Zhenhong Li from Newcastle University yesterday tweeted about a further landslide at Heifangtai on 5th October 2019. This slide was about 20,000 m³, travelling over a distance of about 100 metres. But what is particularly interesting about this event is that it was successfully forecast based upon the monitoring of movement.
Sohu News has an article about the event (in Mandarin), which indicates that the landslide occurred at 4:24 am local time. The monitoring data, collected by a team from Chang’an University and Chengdu University of Technology headed by Professor Zhang Qin, showed the hyperbolic increase in displacement rate with time that is characteristic of brittle failures, allowing a yellow alert to be issued 30 days before failure, and a red alert seven hours before the collapse. Zenghong Li tweeted this image of the displacement rate against time:-
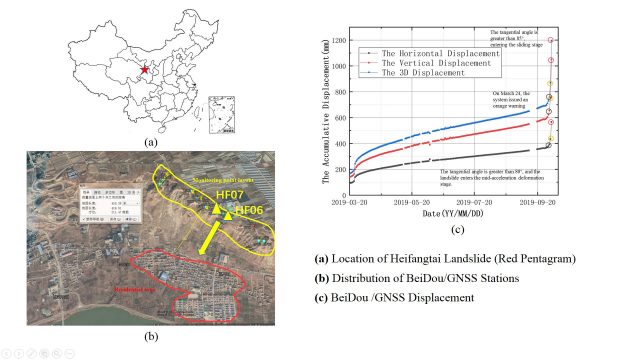
Data from the 5th October 2019 loess landslide at the Heifangtai terrace in Gansu, China. Graph tweeted by Professor Zhenghong Li of Newcastle University, data collected by Professor Zhang Qin of Chang’an University.
.
The Haifangtai landslide appears to show classic three phase creep behaviour, with an initial period of rapid movement (often termed primary creep), a long period of near constant movement (secondary creep), but note that in reality the movement pattern is changing during this phase), followed by a rapid acceleration to failure (tertiary creep). It is this style of behaviour that allows forecasting of the collapse event in some cases.
Interestingly the final collapse was captured on two videos from cameras mounted near to the headscarp. These can be seen in tweets from Professor Li here and here.
4 October 2019
Nosso Senhora do Livramento: another tailings dam failure in Brazil
Nosso Senhora do Livramento: another tailings dam failure in Brazil
On 1st October, another significant tailings dam failure occurred in Brazil, this time at Nosso Senhora do Livramento in Mato Grosso. Fortunately, in this case the scale of the failure, whilst not being trivial by any means, was not equivalent to the other two recent events in Brazil. However, two people have been injured.
The best image to provide an overview of this failure is, I think, this one from Isso E Noticia:-
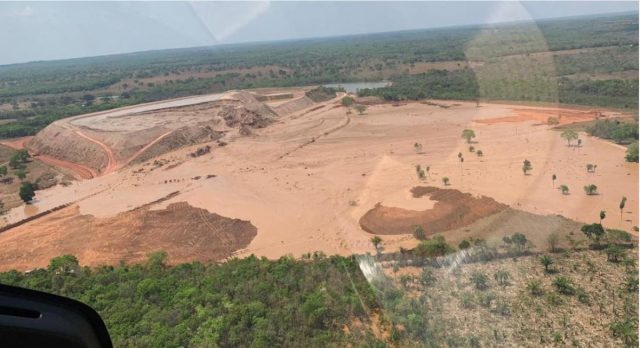
The tailings dam failure at Nosso Senhora do Livramento in Brazil. Image via Isso E Noticia.
.
So, it appears that one of the walls of the tailings dam has collapsed. The location is -15.958, -56.479 if you want to take a look. This is the Google Earth image of the site:-
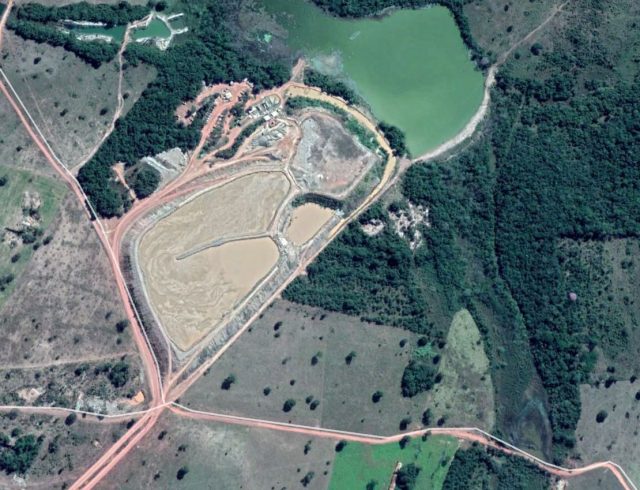
Google Earth image of the site of the tailings dam failure at Nosso Senhora do Livramento in Brazil.
.
This image was collected in June 2018. Planet Labs captured an image of the site on 1st October 2019, the day of the collapse:-
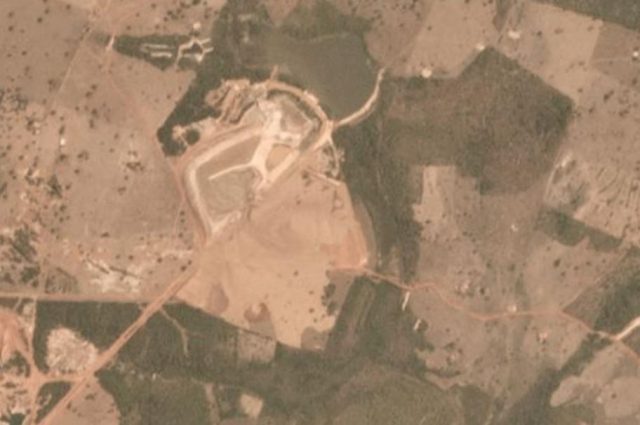
Planet Labs image of the site of the tailings dam failure at Nosso Senhora do Livramento in Brazil. Planet Labs PlanetScope image collected 1st October 2019, copyright Planet Labs, used with permission.
.
It is not clear as to whether the failure was on-going when the image was captured, but at that point the extent of the inundation from the failure was quite contained. It is worth comparing the above image with the one below, which is the same site imaged on 7th July:-
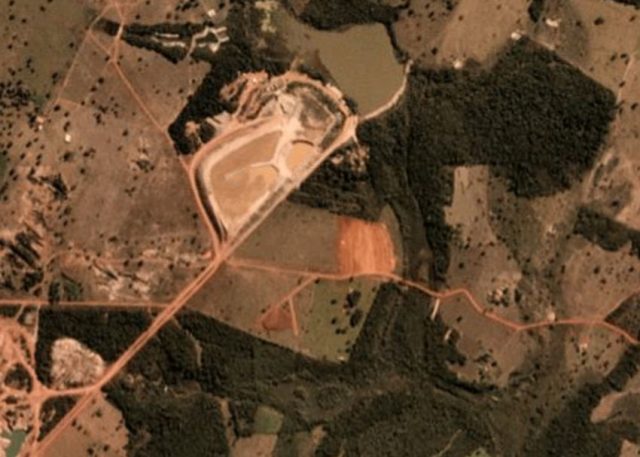
Planet Labs image of the site of the tailings dam failure at Nosso Senhora do Livramento in Brazil. Planet Labs PlanetScope image collected 7th July 2019, copyright Planet Labs, used with permission.
.
I think that there is clear evidence that there was considerable work going on at this site, including clearing of the area that was ultimately inundated. The images also suggest that the height of tailings dam has probably been increased over the last 15 months or so – this is a Planet Labs image from July 2018, when the dam walls appear to be significantly lower:-
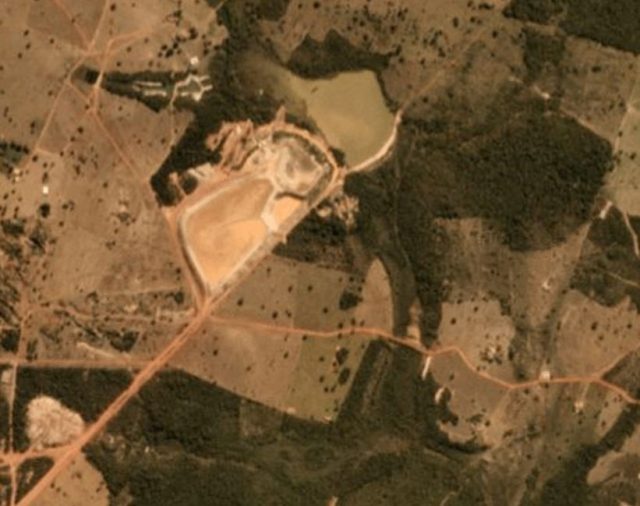
Planet Labs image of the site of the tailings dam failure at Nosso Senhora do Livramento in Brazil. Planet Labs PlanetScope image collected 25th July 2018, copyright Planet Labs, used with permission.
.
The thickness of the tailings dam walls has clearly increased, and at least superficially this raising appears to have occurred via the upstream method (can anyone comment on this?)? This raising of the height of the tailings dam walls might also be evident in the photograph at the top of the page.
There’s a good article (in Portuguese) about the failure in Estadao Ssustenabilidade. This notes that this was a registered gold mine; that the tailings dam was inspected in September 2018 and found to be low risk and low potential damage; and that the structure was 15 m high with a storage volume of 580,000 m³.
Whilst this was a comparatively contained failure, it once again highlights the utterly unacceptable rate of tailings dam collapses.
Reference
Planet Team (2019). Planet Application Program Interface: In Space for Life on Earth. San Francisco, CA. https://www.planet.com/.
2 October 2019
Precursors to the Anak Krakatau flank collapse
Precursors to the Anak Krakatau flank collapse
Last week I wrote about a first analysis of the size and shape of the Anak Krakatau flank collapse in Indonesia on 22 December 2018. Yesterday, Nature Communications published a fascinating and important study (Walter et al. 2019) of the sequence of events on and within the volcanic massif prior to the final, catastrophic failure. This paper is Open Access, so anyone can take a look.
The large, collaborative research team have pieced together various threads of evidence of processes within the volcano. One part of this focuses on the tools used to monitor the activity of volcanoes (which is of course not my speciality). Interestingly though, the data suggests that from about 30 June 2018 the volcano showed a sharp increase in thermal activity, accompanied by an increase in the amount of material being erupted from the volcano. This increased activity lasted for 175 days until the sector collapse, although interestingly the volume of material being emitted by the volcano reduced somewhat from October 2018. It is inevitable that this increased volume of material being erupted increased the mass of material on the slopes of the volcano – Walter et al. (2019) suggest that about 54 million tonnes were added to the southern slopes – which may have been a factor on the development of instability that led to the Anak Krakatau flank collapse.
From the perspective of understanding the development of the landslide itself, the most interesting part of the paper is an InSAR based analysis of the mass that ultimately failed. Walter et al. (2019) have examined an InSAR time series from 1st January 2018 through to the time of the catastrophic collapse. The results are shown in the figure, from the paper, below:-
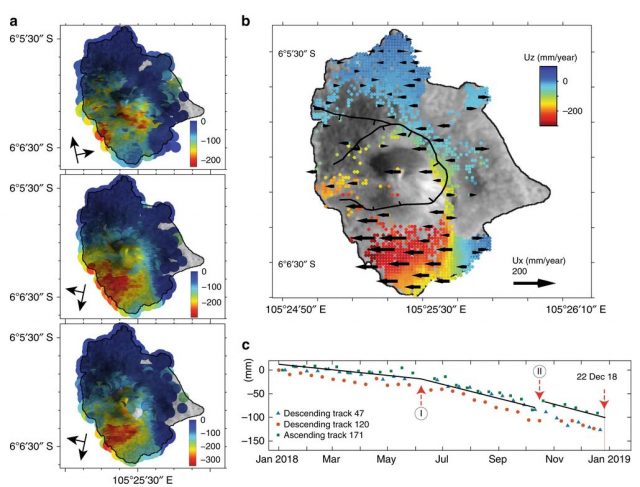
InSAR time series data for the Anak Krakatau flank collapse in Indonesia, from Walter et al. (2019). The three maps marked a show the line of sight movements, whilst b shows the detected vertical deformation (in colours) and east-west movement (arrows). Plot c shows the cumulative movement.
.
The results clearly show that the radar data is able to detect both the spatial pattern of deformation and the accumulation of deformation across the flank. It is notable that the spatial pattern of movement corresponds to the final collapse, whilst the cumulative deformation graph shows that the flank was creeping. Note the increase in rate in June 2018, and the marked discontinuity in movement pattern in October 2018. Interestingly, these dicontinuities occurred at the same time as observed changes in the eruptive behaviour of the volcano.
Unfortunately though, the volcano did not show an accelerating trend in movement rate that might have inferred the development of the collapse. Such accelerating trends are seen in some large slope failures, especially where the collapse is a brittle process, and can be used to infer or even predict that a collapse is developing. Of course, such a trend might have been evident in the hours before collapse, which is not captured by the InSAR data.
Finally, Walter et al. (2019) have also looked at the infrasound and seismic data associated with the collapse. The diagram below shows the seismic data from a station located 64 km from the volcano:-
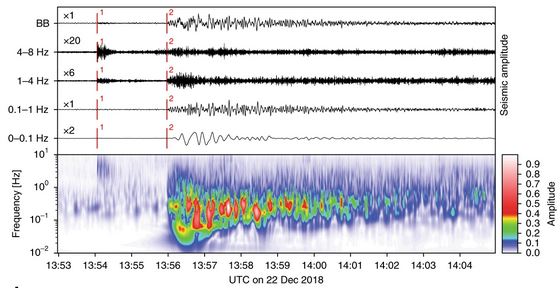
Seismic record for the Anak Krakatau flank collapse in Indonesia, from Walter et al. (2019).
.
The seismic data suggests that the flank collapse itself was rapid – the record is about one minute long, followed by signs of intense eruptive behaviour. Notably, about two minutes before the collapse a distinct earthquake signal was detected. Walter et al. (2019) hypothesize that it was this small earthquake that triggered the Anak Krakatau flank collapse, although they are clear that this has yet to be proven.
This is a wonderful piece of work that provides deep insight into the processes leading up to the collapse. I think it is worth quoting a paragraph from the paper, which summarises the findings perfectly:
“It appears that a perfect storm of magma-tectonic processes at Anak Krakatau culminated in the 22 December 2018 tsunami disaster. Leading up to the event, different sensors, and methods measured distinct anomalous behaviors, which in hindsight can be deemed precursory. However, at the time and when considered individually, none of the parameters, including the thermal anomalies, flank motion, anomalous degassing, seismicity, and infrasound data, were sufficiently conclusive to shed light on the events that were about to unfold.”
Reference
Walter, T.R., Haghshenas, H.M., Schneider, F.M. et al. 2019. Complex hazard cascade culminating in the Anak Krakatau sector collapse. Nature Communications, 10 (1). https://doi.org/10.1038/s41467-019-12284-5.
30 September 2019
Kerala – satellite images of the landslides from the summer monsoon
Kerala – satellite images of the landslides from the summer monsoon
As the 2019 summer monsoon draws to a close (although some areas continue to be affected by heavy rainfall), cloud is starting to withdraw, providing opportunities to view the landslides that have been triggered by the heavy rainfall in Kerala in August. A week or so ago, Raj Bhagat Palanichamy tweeted some images from Copernicus Sentinel showing some of the landslides. I have looked at the Planet Labs imagery – some of these landslides are now becoming visible too. The image below shows a set of landslides in the area of Amarambalam (these landslides are in the vicinity of 11.31, 76.48) for example:-
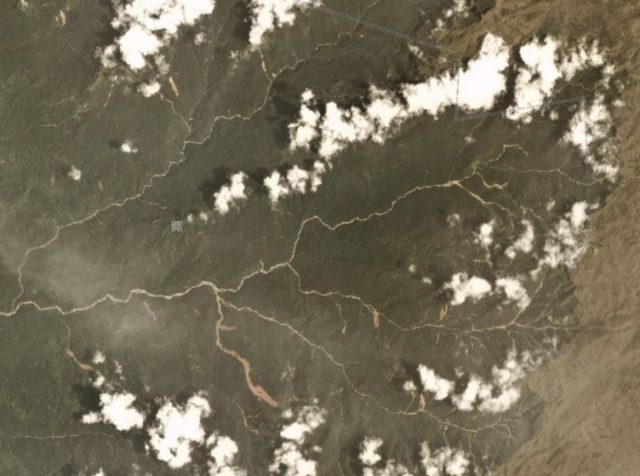
Landslides triggered by the 2019 monsoon in Kerala, India. Image: Planet Labs PlanetScope, collected 21st Septeber 2019, used with permission. Copyright Planet Labs.
.
These landslides appear to primarily be shallow slips in weathered materials that have transitioned into channelised debris flows. One of the landslides is quite large:-
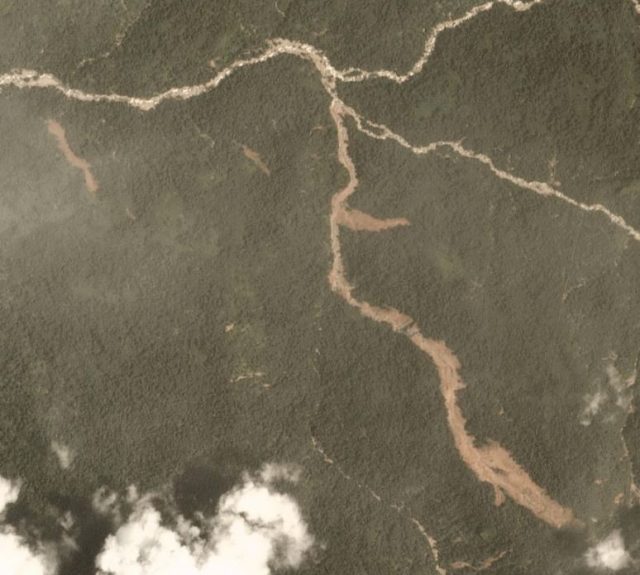
One of the larger landslides triggered by the 2019 monsoon in Kerala, India. Image: Planet Labs PlanetScope, used with permission. Copyright Planet Labs.
.
The most serious landslide occurred at Kavalappara in Wayanad, where up to 59 people were killed in a major landslide. Unfortunately, this site has yet to be imaged clearly. However, in the area of Portimund Lake, to the east of the images above, another large landslide can be seen in the Planet Labs images:-
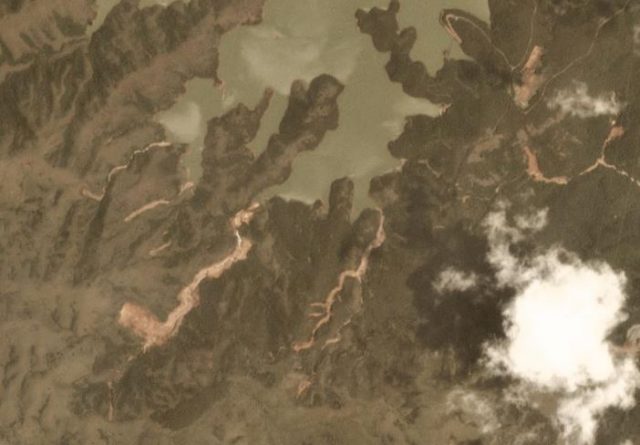
A large landslide in the region of Porthimund lake, triggered by the 2019 monsoon in Kerala, India. Image: Planet Labs PlanetScope, collected 21st September 2019, used with permission. Copyright Planet Labs.
.
These are typical landslides triggered by exceptional rainfall in hilly terrain. The resultant flows along the channels can be devastating to anything in the path. As rainfall intensities continue to increase, and the upland environment is further damaged by human activities, we will see increased occurrence of these types of mass movements across South Asia, with devastating effects.
Reference
Planet Team (2019). Planet Application Program Interface: In Space for Life on Earth. San Francisco, CA. https://www.planet.com/
27 September 2019
Tibesti – another mining-induced landslide
Tibesti – another mining-induced landslide
Reuters reported yesterday that yet another major mining-induced landslide has occurred, this time in the Tibesti region of Chad:-
“A landslide at an illegal gold mine in Chad has killed about 30 people, a government minister said on Thursday. The mine in the Tibesti region near the Libyan border collapsed early on Tuesday and more victims might still be buried in the rubble, defence minister Mahamat Sala told Reuters.”
AGP has a more detailed report, in French. This is an edited Google Translate version of the key parts:-
“The accident occurred in the area of Kouri Bougoudi, near the Libyan border, in the province of Tibesti, which subject to an ongoing emergency. “A mine has collapsed, I can not say exactly how many people are dead, but there are many people working in these mines, there must be a lot of dead, that’s for sure,” said the Chadian Minister of Defense and Security, Mahamat Abali Salah, by phone to AFP.
“An army officer who requested anonymity told AFP “about thirty dead”, but it is based on testimony collected from people on the spot, as the army is not permanently present in this remote area. A member of the region, also based on testimonies collected since N’Djamena, speaks of “a dozen deaths”.”
The area affected is effectively lawless, so the mines are unregulated and thus highly dangerous. This image, from the AGP report, provides an insight into the level of risk associated with this type of mining:-
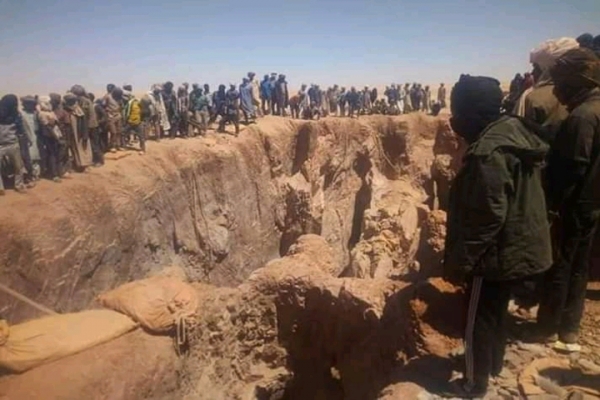
Mine workings at Tibesti in Chad. Image via AGP.
.
This event continues the deadly toll from mining-induced landslides, which I have highlighted previously. This graph below shows the total number of fatalities from such landslides in 2019 to date – I have recorded 677 deaths in 52 separate landslides so far. This total will inevitably rise in the months ahead:-
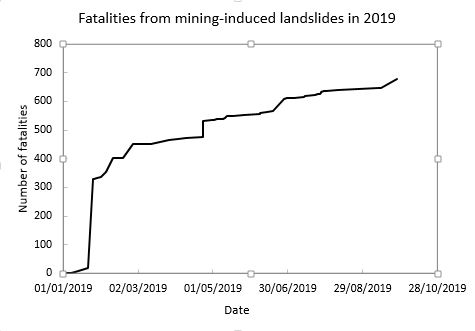
The cumulative total number of mining-induced landslides in 2019 to date.
.
The worst event was the Córrego do Feijão tailings dam failure at Brumadinho in Brazil in January, but as the graph shows, there are many other events occurring around the world.
25 September 2019
The Mirpur earthquake in Pakistan: images of lateral spreading
The Mirpur earthquake in Pakistan: images of lateral spreading
On 24th September 2019 an M=5.6 earthquake struck Mirpur in NW Pakistan. Whilst the Mirpur earthquake was comparatively small, it was also shallow, meaning that a significant area will have suffered high peak ground accelerations. The USGS has generated a map of earthquake intensity (the contours on the map), enhanced by the shading, which shows areas of liquefaction potential:-
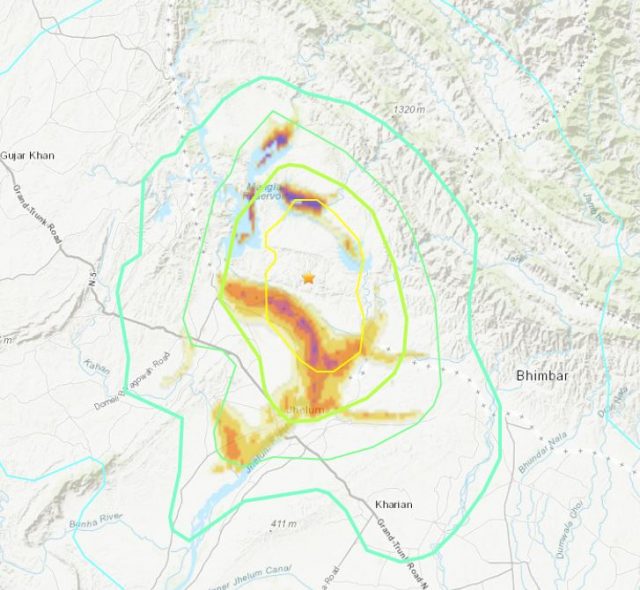
A map of earthquake intensity and liquefaction potential for the 24th September 2019 M=5.6 Mirpur earthquake in Pakistan. Map via the USGS.
.
At the time of writing, over 30 people have been reported to have been killed, whilst at least 450 people were injured. Interestingly, the area with the highest intensity of shaking coincides with both the banks of the major Jhelum River and the margins of part of the huge Mangla reservoir:-
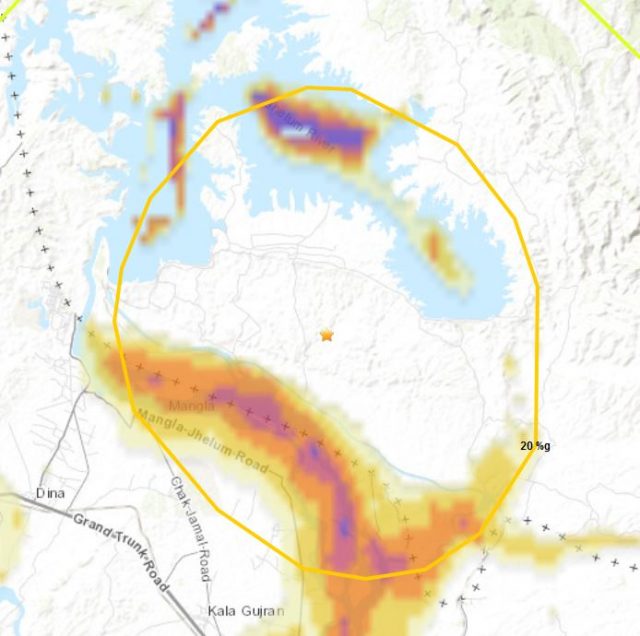
A map of earthquake PGA and liquefaction potential for the 24th September 2019 M=5.6 Mirpur earthquake in Pakistan. Map via the USGS.
.
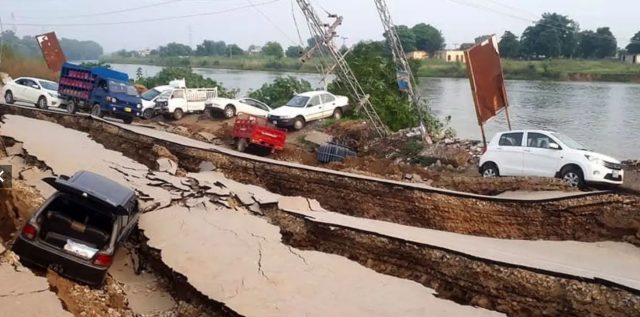
Thus, whilst this earthquake is not large, it has the potential to generate both liquefaction and lateral spreading. Early images coming out of Pakistan show that the earthquake has had just this effect. For example, this image (from the Independent), clearly shows lateral spreading on the banks of the river. Note that the material appears to be made ground:-
Lateral spreading from the Mirpur Earthquake in Pakistan. Image via the Independent.
.
Whilst this image, also from the Independent, also appears to show this area of lateral spreading:-
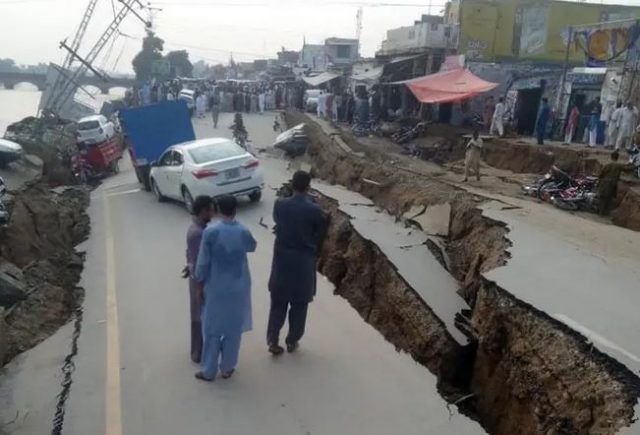
Lateral spreading from the Mirpur Earthquake in Pakistan. Image via the Independent.
.
As usual, it is difficult at the moment to ascertain the full extent of these types of impacts – this should become apparent in the days ahead. It will also be interesting to find out the proportion of the building collapses that are associated with these lateral spread events, rather than simple structural failure under high peak ground accelerations.
24 September 2019
A new analysis of the deadly Anak Krakatau flank collapse
A new analysis of the deadly Anak Krakatau flank collapse
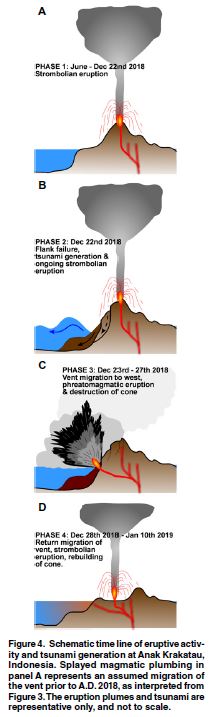
Schematic diagram of the sequence of events in the Anak Krakatau flank collapse. From Williams et al. (2019).
Almost a year ago, the collapse of the flank of Anak Krakatau in Indonesia generated a tsunami that killed over 400 people. The flank collapse occurred without warning, although there had been concerns for a long time that sch an event could occur (as is the case for other volcanic flanks of course). The journal Geology has recently published a paper (Williams et al. 2019) that provides a first detailed analysis of this event. The findings are in some ways surprising. I previewed the article when it was published on Earth ArXiv; the full paper has now been published. I should also note that the authors acknowledge my earlier comments in the paper.
Williams et al. (2019) provide some interesting information about the consequences of the event – for example, the tsunami that caused the losses had a maximum height of 1.40 m; it killed 431 people and injured a further 7,200; it destroyed 1,778 houses; and it damaged 434 boats and ships. But the focus of the work is the use of satellite data to reconstruct the chronology of events and, most importantly, to analyse the magnitude and dynamics of the flank collapse itself. The key conclusion about the sequence of events is contained in the schematic diagram to the left.
In essence, the volcano failed in a large rotational landslide that removed the flank of the volcano. The toe of the slide (and thus the main mass of the landslide) was below sea level. This triggered the partial failure of a second portion of the flank of the volcano (see diagram B in the schematic illustration), but this section did not proceed to full failure at this point. Subsequently, the volcano replumbed to generate a new vent through the basal surface of the landslide (see schematic diagram C). The eruption through this vent involved the ingress of sea water, generating a violent phreatomagmatic eruption. This eruptive event removed the remainder of the flank of the volcano, including the partially slipped landslide mass.
The subsequent eruptive events on the volcano then led to the generation of a new, more stable morphology, allowing the activity to stabilise (see schematic diagram D).
The surprising element of this analysis is the scale of the main Anak Krakatau flank collapse. The satellite imagery allows the construction of detailed cross sections, although clearly some assumptions need to be made about the underwater configuration given the lack of bathymetric data. But this analysis yields a volume of about 4 million m³ for the subaerial (i.e. above water) component and 100 million m³ for the below sea level component of the landslide. Whilst this is a very large landslide, it is remarkably small for a flank collapse, and it is also remarkably small for a landslide to have generated such a large tsunami. Williams et al. (2019) compare their findings with a previous study that modelled the generation of a tsunami from an Anak Krakatau flank collapse, but which assumed a failure volume of 280 million m³. The observed waves generated by the actual flank collapse were on a similar scale to those modelled for the much larger event. Interestingly, they also moved through the water much faster than the model suggested. This suggests that the model is under-predicting tsunamis generated by large landslides.
So, overall, this is a really interesting analysis of the Anak Krakatau flank collapse. The results have some profound implications for localised but highly destructive tsunami generation from these events, and the study implies that we will need to look again at the ways in which tsunamis are modelled.
Reference
Rebecca Williams, Pete Rowley, Matthew C. Garthwaite. 2019. Reconstructing the Anak Krakatau flank collapse that caused the December 2018 Indonesian tsunami. Geology. https://doi.org/10.1130/G46517.1
23 September 2019
Kerala – the hungry rains
Kerala – the hungry rains
The Indian financial newspaper Mint has published an article last week, The Hungry Rains, which examined the impact of the 2019 monsoon on Kerala in western India. Kerala is the main coastal state lying along the southwest part of the country. The main take home message from the article is that Kerala is enduring an ecological crisis that is making the state exceptionally vulnerable to the effects of the monsoon, resulting in extensive destruction and high levels of economic loss. Kerala has suffered devastating losses two years in a row, with the exemplar being the Kavalappara landslide in August, which killed about 60 people.
The Mint argues that poor land use management lies behind many of the problems in Kerala:
“A journey through Kerala shows it’s not just about the weather. Experts from the Kerala State Disaster Management Authority spent the first week of September studying what led to the mudslide that wiped out Kavalappara. Their findings have yet to be made public but a person privy to them says, on condition of anonymity, that apart from the heavy rains, unscientific cultivation of rubber across the hilltop is to blame. The strength of the soil, its ability to resist deformation and lateral motion, has been destroyed by the rubber estates, he says. In other parts of the state, which saw heavy inundation and deadly landslides, they found a clear correlation between the damage and human activities such as quarrying or encroachment of riverbeds. People know about the changes but are not aware of the dangers.”
The vulnerability of India to landslides is fascinating. Whilst the focus is (correctly) often on the Himalayan Arc, there are also substantial challenges in the west of the country. The map below shows the rainfall-induced landslide susceptibility for India. I have created this map from the NASA landslide susceptibility dataset from Dalia Kirschbaum and Thomas Stanley:-
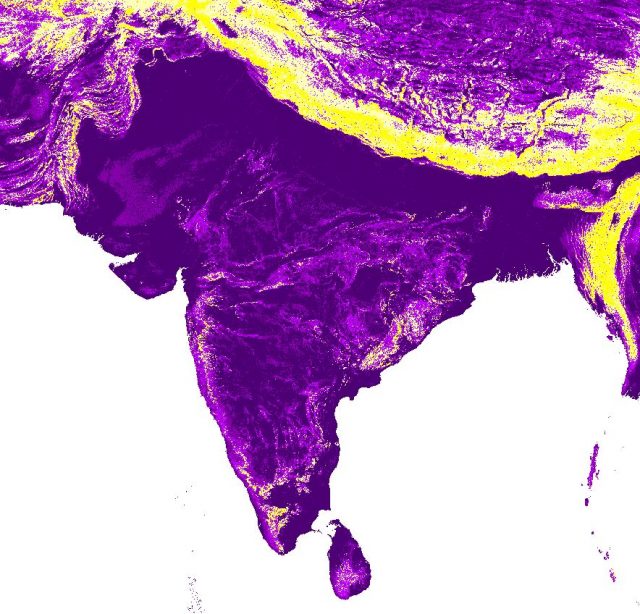
Landslide susceptibility in India, from the NASA landslide susceptibility dataset. High susceptibility is indicated by light colours. Kerala lies along the southwest coast.
.
And this map shows the distribution of fatal landslides in India from 2004 to 2016, as per the work that I have undertaken with Melanie Froude. The cluster of landslides in western India is clear:-
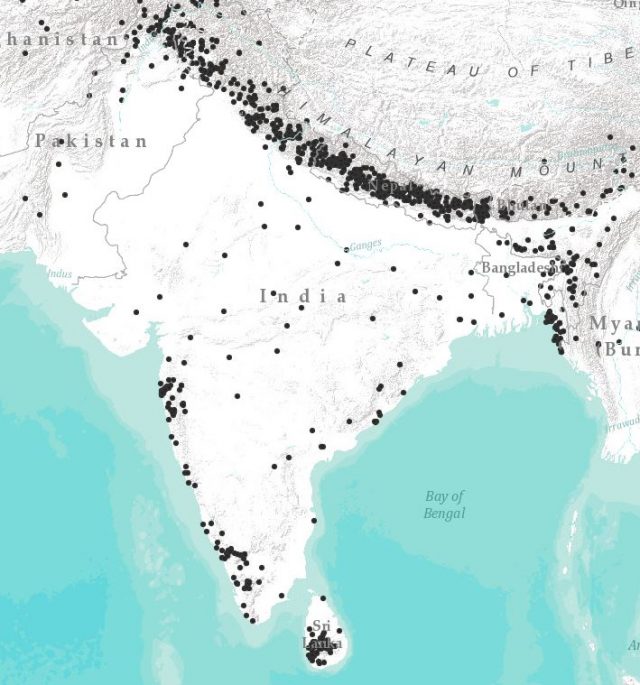
Fatal landslides in South Asia, 20014 to 2016. Note the cluster in Kerala.
.
The summer monsoon in India consists of air drawn from the seas to the southwest of the country, meaning that the coastal areas suffer from high levels of rainfall. This is the seasonal (monsoon) rainfall map for 2019, from Monsoon Online:-
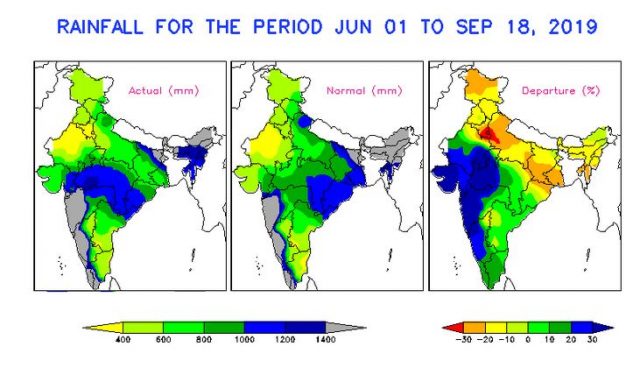
The seasonal rainfall map for India for the 2019 monsoon. Image from Monsoon Online.
.
Note the very high level of expected rainfall across western India (the “normal” map in the centre), and the exceptional positive anomaly in 2019 (the “departure” map on the right). Thus, Kerala would be expected to have very high levels of rainfall, but this year the total received was significantly higher than average.
The Mint article considers the changes that are needed to try to manage the hazard:
What is the solution? A serious effort must begin with addressing the elephant in the room—how land is governed, says V. Venu, chief executive of the Rebuild Kerala Initiative, a special purpose vehicle floated by the government to rebuild the state after the back-to-back floods and prevent future destruction. “Today’s legal framework practically lets you build pretty much whatever you want, a resort or a house or a commercial building. They have a few stupid restrictions. And, if you fulfil those, for everything else you will get a licence,” he says.
Sadly, at present there is little prospect of meaningful change, so the losses are likely to mount in the years ahead.
20 September 2019
The 1985 Stava tailings dam disaster
The 1985 Stava tailings dam disaster
I’m currently undertaking some work examining the runout of mine waste failures, during which I’m looking back at some old case studies. This is a follow up to the paper that Melanie Froude and I published last year that suggests that loss of life from slope failures in the mining industry, most particularly where there is poor regulation, is increasing with time. This has led me to look back at one of the worst failures of this type in modern history, the 19th July 1985 Stava Tailings Dam failure in Italy.
The location for the disaster was the village of Stava, in Trento. At the site, two tailings dams, built to contain the waste from a fluorite mine, had been constructed. The site, and the collapse, is described in a post-event analysis (Chandler and Tosatti 1995), available online, whilst there is also a nice reflective piece about the role of regulation (Luino and Degraff 2012), also available online. The latter includes this image of the tailings dams prior to failure:-
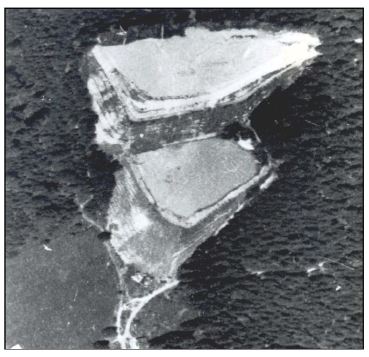
The Stava tailings dams prior to failure. Image from summer 1983, published in Luino and De Graff (2012).
.
The dams collapsed on 19th July 1985 at 12:22. The initial failure occurred in the upper tailings dam, which then induced collapse of the lower facility in a domino effect. At the time of failure, 300,000 m³ of material was stored in the two tailings dams. Of this, 180,000 m³ was released in a single event, which mobilised into a very rapid mudflow. Eyewitness accounts suggest that the rate of movement was sufficiently great to generate an air blast that shredded the trees along the path of the flow. There is a good seismic data for the landslide, which suggests that it reached a peak velocity of 27 metres per second (about 100 km/h or 60 mph). The mudflow struck the houses located directly below the tailings dams before sweeping down to the village of Stava, located about 800 m below the lower dam. Luino and De Graff (2012) report that Stava was struck at 12:25, and the 20 or so buidings were completely destroyed in just 13 seconds.
The flow then travelled down the valley, ultimately sweeping through parts of the town of Tesero, located about 3 km downstream. The before and after image below, also from Luino and De Graff (2012), shows the extraordinarily destructive power of this flow:-
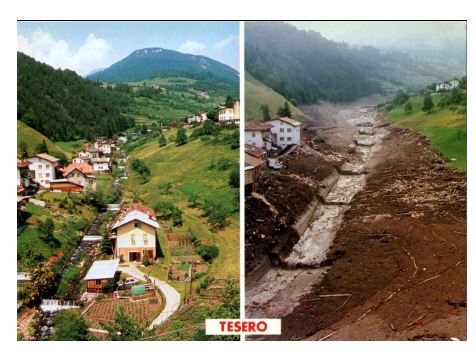
Before and after images of the track of the mudflow from the 1985 Stava tailings dam failure. Image from Luino and De Graff (2012).
.
The mudflow from the Stava tailings dam failure finally stopped when it reached the main channel of the Avisio river at Tesero. The seismic data suggests that the movement event arrested just ten minutes after the initial collapse. The village of Stava had been completely destroyed, and there was extensive damage in Tesero. In total 268 people were killed, and 56 houses, six industrial buildings and nine other buildings were destroyed.
Subsequent analysis of the site (see Chandler and Tosatti (1995) suggests that the stability of the tailings dams was unacceptably low, primarily because the underlying ground was poorly drained, the construction meant that the dams lacked adequate drainage (allowing high water pressures to develop, and preventing proper consolidation of the tailings), the ponds were being recharged with runoff from the adjacent drainage basins, and the upper dam was unacceptably steep, with a part of the retaining structure being sited on tailings from the lower pond.
The failure led to legal action against those responsible for the dam. In June 1992 a total of ten individuals were convicted of crimes that included culpable disaster and manslaughter of multiple individuals, and were jailed.
The Stava Foundation has a very detailed website that documents the disaster in order to remember the victims, the aim of which is to promulgate the lessons from the Stava tailings dam failure. Sadly, the industry has yet to heed the lessons adequately.
References
Chandler, R.J. and Tosatti, G. 1995. The Stava tailings dams failure, Italy, July 1985. Proceedings of the Institution of Civil Engineers Geotechnical Engineering, 113 (2), 67-79.
Luino, F. and De Graff, J.V. 2012. The Stava mudflow of 19 July 1985 (Northern Italy): a disaster that effective regulation might have prevented. Natural Hazards and Earth System Sciences, 12, 1030–1042.
 Dave Petley is the Vice-Chancellor of the University of Hull in the United Kingdom. His blog provides commentary and analysis of landslide events occurring worldwide, including the landslides themselves, latest research, and conferences and meetings.
Recent Comments