
2 October 2019
Precursors to the Anak Krakatau flank collapse
Posted by Dave Petley
Precursors to the Anak Krakatau flank collapse
Last week I wrote about a first analysis of the size and shape of the Anak Krakatau flank collapse in Indonesia on 22 December 2018. Yesterday, Nature Communications published a fascinating and important study (Walter et al. 2019) of the sequence of events on and within the volcanic massif prior to the final, catastrophic failure. This paper is Open Access, so anyone can take a look.
The large, collaborative research team have pieced together various threads of evidence of processes within the volcano. One part of this focuses on the tools used to monitor the activity of volcanoes (which is of course not my speciality). Interestingly though, the data suggests that from about 30 June 2018 the volcano showed a sharp increase in thermal activity, accompanied by an increase in the amount of material being erupted from the volcano. This increased activity lasted for 175 days until the sector collapse, although interestingly the volume of material being emitted by the volcano reduced somewhat from October 2018. It is inevitable that this increased volume of material being erupted increased the mass of material on the slopes of the volcano – Walter et al. (2019) suggest that about 54 million tonnes were added to the southern slopes – which may have been a factor on the development of instability that led to the Anak Krakatau flank collapse.
From the perspective of understanding the development of the landslide itself, the most interesting part of the paper is an InSAR based analysis of the mass that ultimately failed. Walter et al. (2019) have examined an InSAR time series from 1st January 2018 through to the time of the catastrophic collapse. The results are shown in the figure, from the paper, below:-
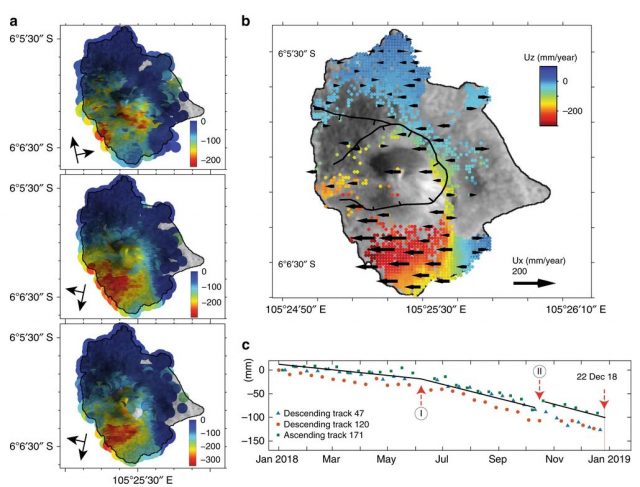
InSAR time series data for the Anak Krakatau flank collapse in Indonesia, from Walter et al. (2019). The three maps marked a show the line of sight movements, whilst b shows the detected vertical deformation (in colours) and east-west movement (arrows). Plot c shows the cumulative movement.
.
The results clearly show that the radar data is able to detect both the spatial pattern of deformation and the accumulation of deformation across the flank. It is notable that the spatial pattern of movement corresponds to the final collapse, whilst the cumulative deformation graph shows that the flank was creeping. Note the increase in rate in June 2018, and the marked discontinuity in movement pattern in October 2018. Interestingly, these dicontinuities occurred at the same time as observed changes in the eruptive behaviour of the volcano.
Unfortunately though, the volcano did not show an accelerating trend in movement rate that might have inferred the development of the collapse. Such accelerating trends are seen in some large slope failures, especially where the collapse is a brittle process, and can be used to infer or even predict that a collapse is developing. Of course, such a trend might have been evident in the hours before collapse, which is not captured by the InSAR data.
Finally, Walter et al. (2019) have also looked at the infrasound and seismic data associated with the collapse. The diagram below shows the seismic data from a station located 64 km from the volcano:-
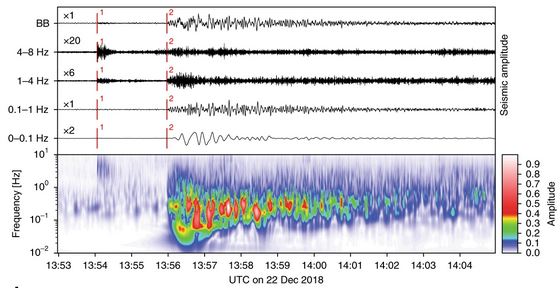
Seismic record for the Anak Krakatau flank collapse in Indonesia, from Walter et al. (2019).
.
The seismic data suggests that the flank collapse itself was rapid – the record is about one minute long, followed by signs of intense eruptive behaviour. Notably, about two minutes before the collapse a distinct earthquake signal was detected. Walter et al. (2019) hypothesize that it was this small earthquake that triggered the Anak Krakatau flank collapse, although they are clear that this has yet to be proven.
This is a wonderful piece of work that provides deep insight into the processes leading up to the collapse. I think it is worth quoting a paragraph from the paper, which summarises the findings perfectly:
“It appears that a perfect storm of magma-tectonic processes at Anak Krakatau culminated in the 22 December 2018 tsunami disaster. Leading up to the event, different sensors, and methods measured distinct anomalous behaviors, which in hindsight can be deemed precursory. However, at the time and when considered individually, none of the parameters, including the thermal anomalies, flank motion, anomalous degassing, seismicity, and infrasound data, were sufficiently conclusive to shed light on the events that were about to unfold.”
Reference
Walter, T.R., Haghshenas, H.M., Schneider, F.M. et al. 2019. Complex hazard cascade culminating in the Anak Krakatau sector collapse. Nature Communications, 10 (1). https://doi.org/10.1038/s41467-019-12284-5.
 Dave Petley is the Vice-Chancellor of the University of Hull in the United Kingdom. His blog provides commentary and analysis of landslide events occurring worldwide, including the landslides themselves, latest research, and conferences and meetings.