
13 February 2020
The fast-moving Alpine Gardens landslide in New Zealand
The fast-moving Alpine Gardens landslide in New Zealand
My friends at GNS Science in New Zealand published an article on the Geonet website yesterday about the Alpine Gardens landslide in the Fox Glacier Valley in New Zealand. Featuring the work of a team led by Saskia de Vilder, who like me used to work at the University of Durham, the article highlights the impacts of a remarkably active landslide that has required the rerouting of the track to the Fox Glacier viewpoint, an important tourist destination on the west coast of South Island.
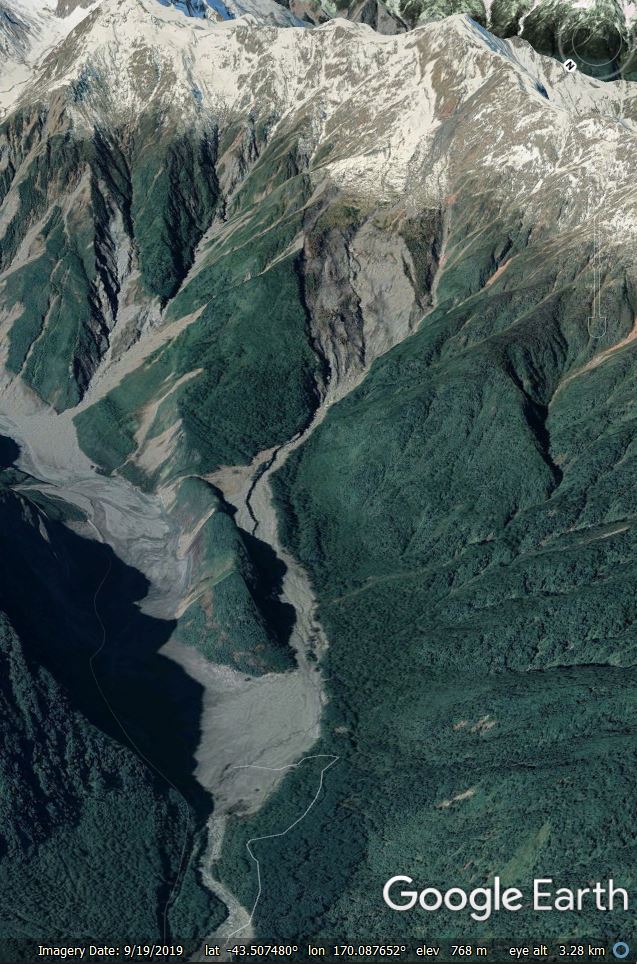
A Google Earth image of the Alpine Gardens Landslide in the Fox Glacier Valley in New Zealand.
.
This is a large landslide – GNS estimate that it has a volume of 50 million cubic metres. Through Geonet, Saskia and her team have set up a GPS monitoring station on the slide. In the last year, that monitoring station has displaced by about 50 metres, with the rate of movement being dependent upon the groundwater level. This means that on average it is moving at over 11 cm per day, but on some days the displacement exceeds half a metre. This is an unusually large amount.
The landslide itself is remote, but as the image above shows, debris released by the landslide forms large debris flows that travel down the side valley and into the main channel. Large volumes of material are being mobilised – Saskia estimates that over the year to June 2019, about 6 million m³ of material was incorporated into debris flows. About half of that amount was deposited onto the debris fan, whilst the other half was transported away by the Fox Glacier.
The upshot is a remarkable level of geomorphological change. The Google Earth image below shows the same site in am image collected in May 2006:-
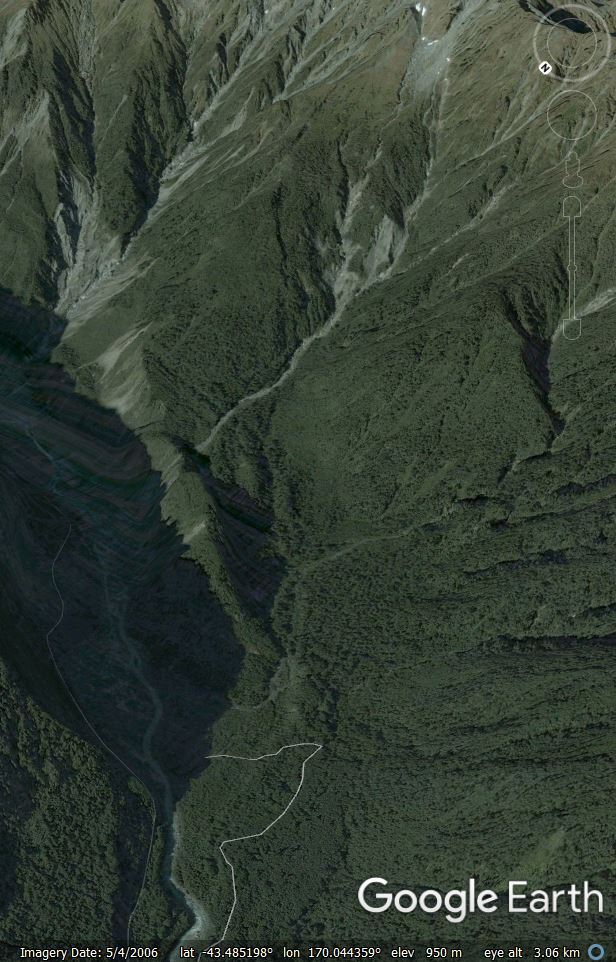
A Google Earth image of the Alpine Gardens Landslide in the Fox Glacier Valley in New Zealand.
.
At that time there was little evidence of active movement on what has become the Alpine Gardens Landslide, and of course there are no debris flow deposits in the valley. It is intriguing to consider the possible causes of this high current level of activity.
11 February 2020
A seismic analysis of the 23 July 2019 Shuicheng landslide in China
A seismic analysis of the 23 July 2019 Shuicheng landslide in China
On 23 July 2019 a large landslide occurred at Pingdi in Shuicheng County in western Guizhou Province, China, killing 51 people. I covered this large landslide, one of the more significant of 2019, at the time, and in August 2019 I posted the following high-resolution Planet Labs image of the slide:-
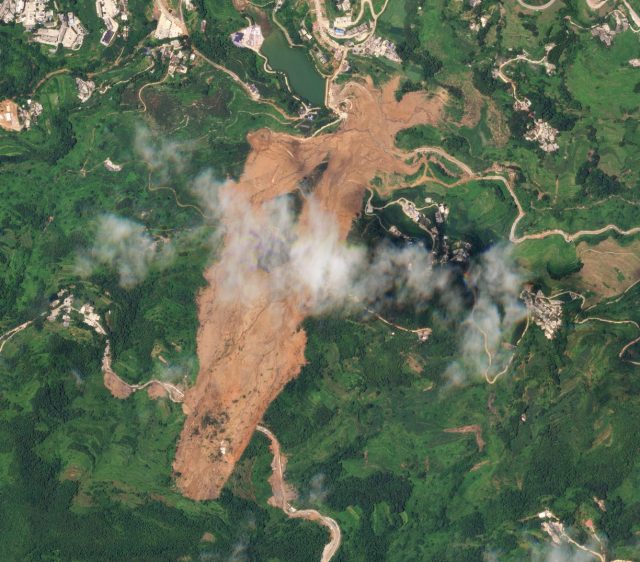
A Planet Labs SkySat image of the Shuicheng landslide in Guizhou Province China. Image collected on 2nd August 2019, copyright Planet Labs, used with permission.
.
A first analysis of the Shuicheng landslide (Yan et al. 2020) has now been published in the journal Landslides. The most interesting element of this piece of work is that it uses a very detailed analysis of the seismic signals generated by the landslide to interpret its behaviour. This is one of the most detailed analyses of this type to date. It is particularly intriguing because of the behaviour of the slide, which I highlighted at the time, with an initial planar sliding component (in the vicinity of the road at the top of the slope, which is the bottom of the image above), bifurcation into two components in the middle part of the track, and then a single runout zone. Interestingly, Yan et al. (2020) have been able to back-analyse this behaviour from the seismic data.
As a consequence of this investigation, the authors have provided this schematic of the behaviour of the Shiucheng landslide:-
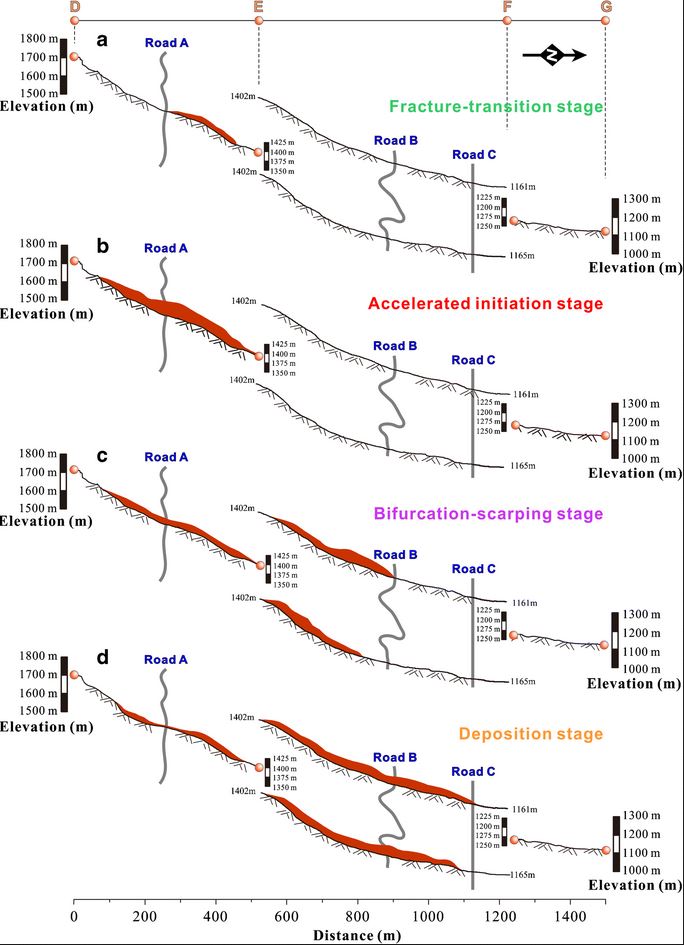
Schematic diagram showing the behaviour of the Shuicheng landslide, as interpreted from the seismic data by Yan et al. (2020).
.
To my surprise, the data suggests that the Shuicheng landslide started below the road (Road A), not on the upslope side. Yan et al. (2020) suggest that this might have been the result of saturation of this part of the slope due to runoff from the road. This initial landslide was small, but it soon destabilised a wider area, such that a larger mass in the crown of the landslide began to move. Failure of this upper portion of the slope remained slow, but as the mass loaded the steeper slope below, the landslide both accelerated and increased in volume as material was entrained.
In the third stage of the Shuicheng landslide, the natural topography forced it to bifurcate into the two portions seen in the satellite image. The landslide was now rapid and was efficient in entraining debris.
Finally, the mass reached the bottom of the slope and was deposited in the valley. The seismic data indicates a rapid deceleration once the topography no longer supported sliding.
In my original posts I hypothesised that the road had destabilised the slope, but my interpretation was that it would have been the section upslope of the road that failed first. Yan et al. (2020), using quantitative data, have shown that whilst the road was indeed a key factor, it was the downhill portion that failed first.
This is a really nice example of the ways in which these new quantitative datasets can provide insight into landslide mechanisms.
Reference and acknowledgement
Yan, Y., Cui, Y., Tian, X. et al. 2020. Seismic signal recognition and interpretation of the 2019 “7.23” Shuicheng landslide by seismogram stations. Landslides. https://doi.org/10.1007/s10346-020-01358-x
Planet Team (2020). Planet Application Program Interface: In Space for Life on Earth. San Francisco, CA. https://www.planet.com/
10 February 2020
The exceptional mobility of tailings dam failures
The exceptional mobility of tailings dam failures
I’m continuing to write my paper for the keynote at the 13th International Symposium on Landslides in Colombia this year (the paper is due this month, so the pressure is on). As I noted in a post last week, I’ve been looking at the impact of landslides in less developed countries; one key component of this is the impact of failures associated with mining.
As part of this work I’m taking a look at the mobility of tailings failures in relation to other major landslides. Tailings dam failures inflict a huge impact in terms of loss of life, environmental effects and social damage. It is well established that the impacts can extend for tens or even hundreds of kilometres downstream – the Ok Tedi tailings failure in Papua New Guinea for example extended for 1,000 km and disrupted the lives of 50,000 people. Of course much of this damage was caused by remobilisation of the tailings by the river, but the issue of the runout of the landslide itself is very pertinent.
A good way to analyse the runout of landslides is to examine the so-called Fahrböschung angle, which is the ratio between the vertical change of the landslide (from crown to toe) to the length of the landslides (again from crown to toe). More mobile landslides have a lower Fahrböschung angle.
Using case studies described in the World Mine Tailings Failures (2020) catalogue, and going back to original topographic and satellite data, I have been able to calculate the Fahrböschung angle for 27 tailings dam failures. I have then compared these with the mobility of large landslides using data presented in a famous paper (Legros 2002) a couple of decades ago. I have also included in the graph data for coal waste landslides:-
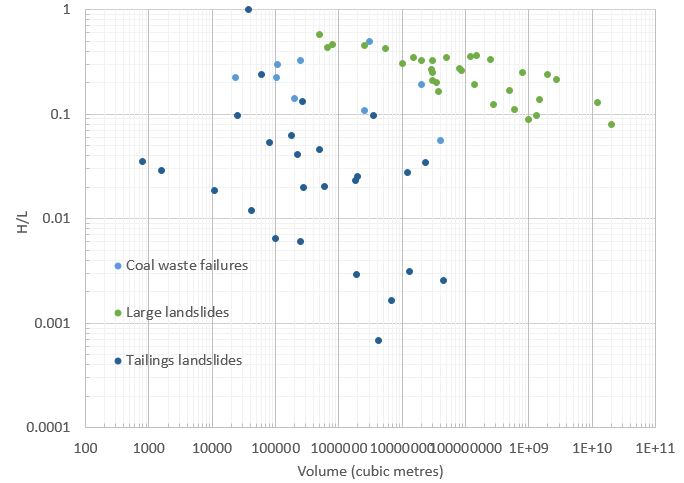
Graph of the Fahrböschung angle against volume for tailings dams and large landslides from Legros (2002).
.
Taking the large landslides first, it is well-known that the Fahrböschung angle decreases as landslide volume gets larger – the reasons for this remain a little unclear. Interestingly the same effect is seen for coal waste landslides and for tailings landslides, both of which are more mobile than large landslides. But, most significantly, the tailings landslides have a far lower Fahrböschung angle than that of the large landslides, but with much greater scatter too. Indeed, in many cases the Fahrböschung angle is two orders of magnitude lower – in other words, tailings landslides travel far further than other large landslides.
The reason for this high mobility is likely to the nature of the materials that are released in the tailings dam failure. Typically, the failure involves materials that have been crushed and that, at the point of failure, are saturated and have undergone liquefaction. The extreme mobility at the time of failure was of course illustrated rather elegantly by the Brumadinho failure in Brazil. Interestingly, many investigations of tailings dam failures tend to focus on the failure mechanism, and to ignore what happens thereafter. This needs attention.
Reference
2002. The mobility of long‐runout landslides, Engineering Geology, 63, 301– 331.
7 February 2020
Zaldibar: a major garbage dump landslide in Spain yesterday
Zaldibar: a major garbage dump landslide in Spain yesterday
On 6 February 2020 at about 4 pm local time a significant landslide occurred in the Ermua landfill at Zaldibar in the Basque region of Spain. The landslide traveled over a distance of about 330 m and inundated the major AP-8 highway below. It appears that two people may have been killed. El Diaro Vasco has an excellent gallery of images of this landslide, which includes this view taken from overhead:-
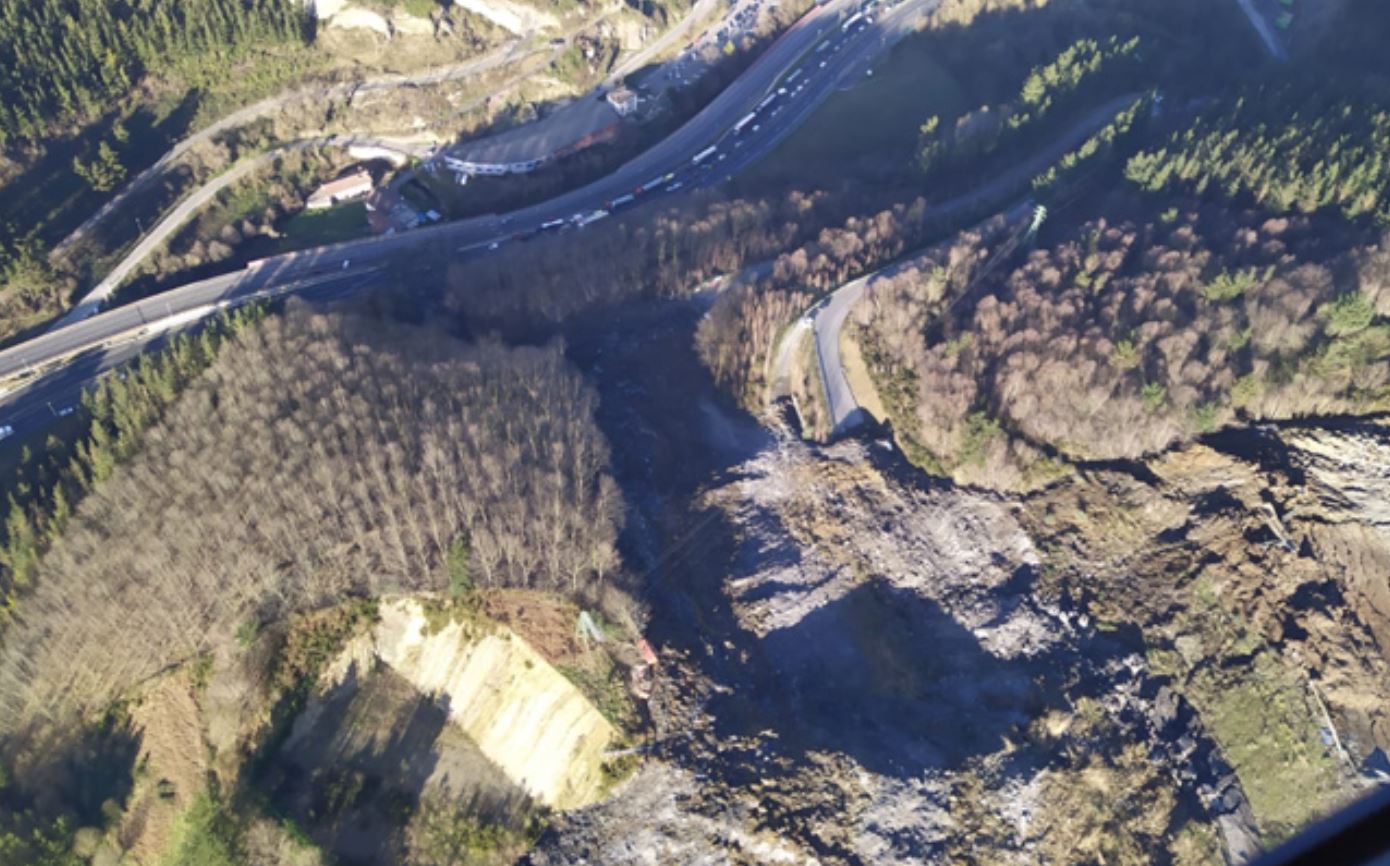
The garbage dump landslide at Zaldibar on 6 February 2020. Image from El Diaro Vasco, taken by Angel Martina.
.
Initial estimates put the volume of the landslide at about 4,000 cubic metres, with a width of about 30 metres.
Reports suggest that the two missing people are both reported to be workers at the dump. At the time of writing it is not clear as to their status, but reports this morning (7 February 2020) suggest that to date they have not been rescued, although some potential sites to search have been identified by search and rescue dogs. Clearance operations are underway to reopen the road.
The location of the landslide is 43.17, -2.50. There is a Google Earth image of the site dated August 2018 that shows work underway on the tip on the side of the slope that failed:-
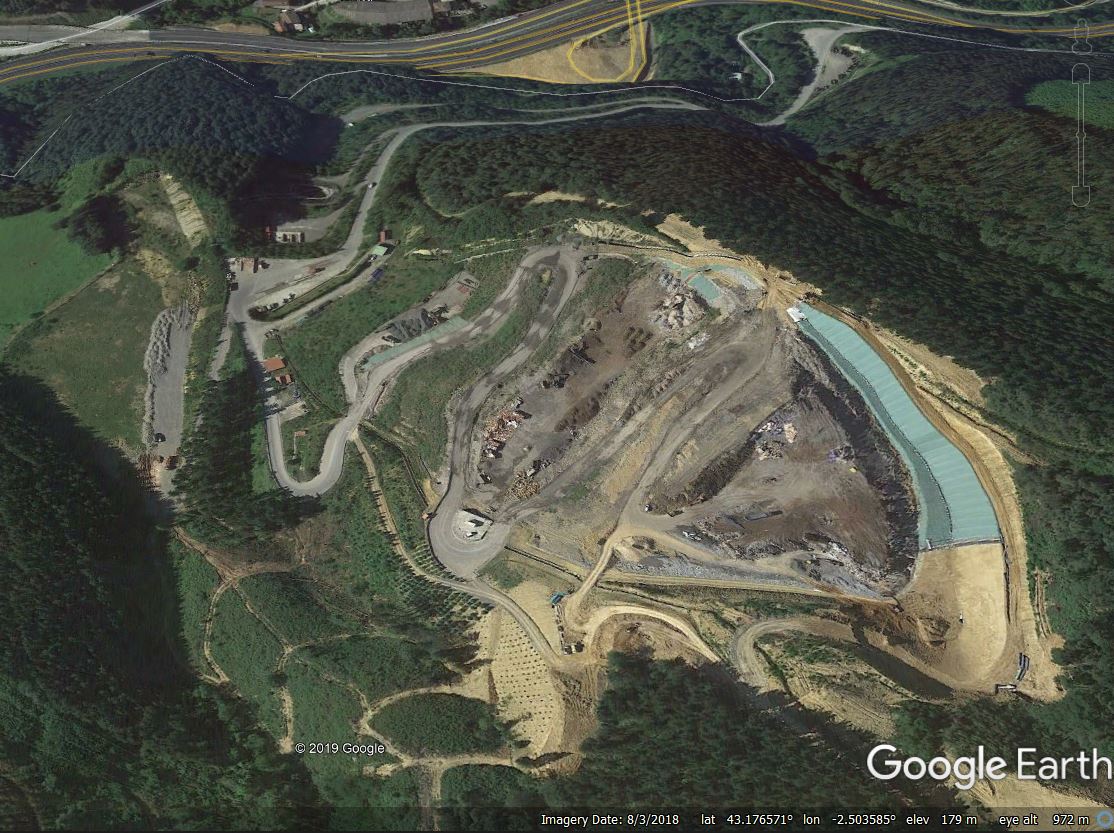
Google Earth image of the site of the garbage dump landslide at Zaldibar on 6 February 2020. This image, which shows work underway at the site, was collected in August 2018.
.
The Google Earth image archive appears to show the Zaldibar site being prepared for the dumping of waste in 2011, with emplacement of garbage being underway in the image collected in August 2014.
Garbage dump landslides are a known hazard, and in the past they have caused substantial loss of life, but usually in countries with poor management of waste. A major garbage dump landslide in a European country is unusual.
Such landslides pose particular challenges for search and rescue due to the nature of the materials involved and the risks to the rescuers.
6 February 2020
The Cerro Caquilluco–Cerrillos Negros rock avalanches in Peru
The Cerro Caquilluco–Cerrillos Negros rock avalanches in Peru
Giant rock avalanches are rare but fascinating events. The scale of the largest is hard to imagine. To generate such landslides certain conditions need to be met, most notably high topography with steep gradients.
In a short paper published a few years, Crosta et al. (2015) described the giant Cerro Caquilluco–Cerrillos Negros rock avalanches in the southern part of Peru, located in the vicinity of -17.63, -70.19. This is the site of the so-called Arica Bend, which has one of the largest relief contrasts on Earth – the location is close to the coast; offshore the subduction trench extends to 6000 m below sea level, whilst the mountain tops extend to 6,300 metres above sea level. In this area, the research team have identified a number of giant rock avalanches, some of the largest mapped to date.
The figure below, from Crosta et al. (2015), shows the rock avalanches mapped in this area:-
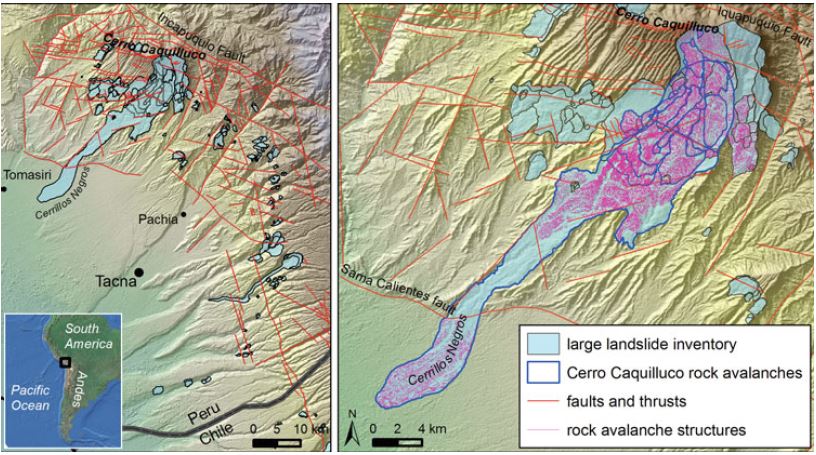
The Cerro Caquilluco–Cerrillos Negros Giant Rock Avalanches, from Crosta et al. (2015).
.
The largest of these rock avalanches, at Cerrillos Negros, has a linear distance from the crown of the landslide to the toe of the deposit of 41 km; the total distance traveled along the track is about 43 km. This landslide is shown in the Google Earth image below – I have annotated the landslide scar and the lower part of the landslide deposit:-
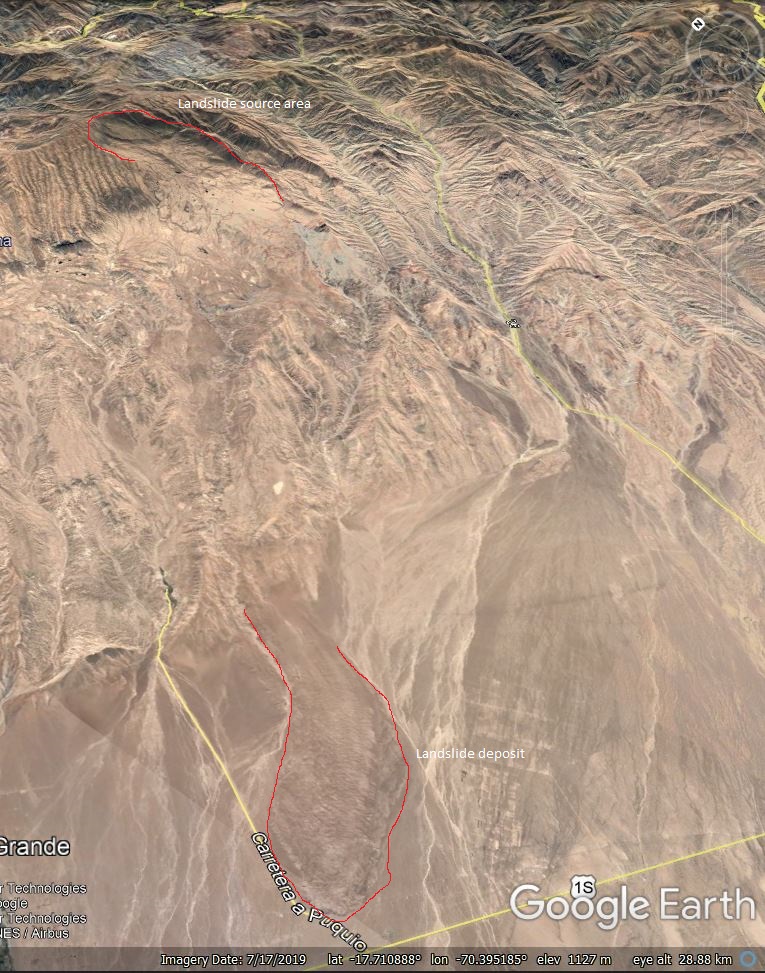
The Cerrillos Negros Rock Avalanche, as seen on Google Earth
.
As the image shows, identifying the middle part of the landslide is quite difficult as the landslide deposit has smoothed out the topography, but once you get your eye in it is identifiable in broad terms. Crosta et al. (2015) have reconstructed the landscape prior to the landslide occurring; from this they estmate that the failure volume was in the order of 10 km³.
As the first diagram shows, this is only the largest of many giant landslides in this area. These rock avalanches deserve more detailed investigation, but the scale and the landscape (plus of course the climate) make this a challenging task.
Reference
Crosta G.B., Paolo F., Elena V., Hermanns R.L. 2015. The Cerro Caquilluco–Cerrillos Negros Giant Rock Avalanches (Tacna, Peru). In: Lollino G. et al. (eds) Engineering Geology for Society and Territory – Volume 2. Springer, Cham
5 February 2020
The geographical spread of fatal landslides
The geographical spread of fatal landslides
I have been writing my paper for my keynote lecture at the forthcoming 13th International Symposium on Landslides, which will be held in Cartagena in Colombia in June this year. I was asked by the organisers to talk about landslides and less developed countries, a topic of great importance. As part of that paper I have gone back to the fatal landslides database once again to look at the geographical spread of landslides around the world. The data I have been collecting (for over 17 years) is focused on landslides that cause loss of life; for this type of analysis I usually exclude landslides associated with earthquakes (which is a different but very interesting topic). So, for the paper I have prepared a graph showing the cumulative number of fatal landslides by geographical area, covering the period from January 2004 to December 2017 inclusive:-
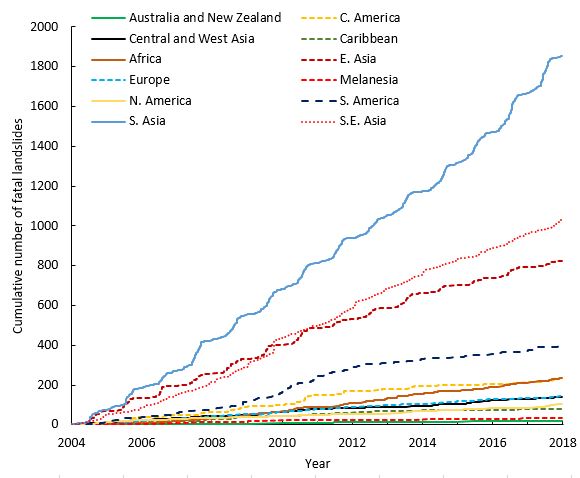
The cumulative number of landslides by geographical area from 2004 to 2017 inclusive.
.
There are many interesting aspects of this data, of which I have written previously, but that are neatly synthesised in this graph. First, and most obviously, it is South Asia that suffers the greatest number of fatal landslides. That is well-established now, but only a decade or so ago people were maintaining that this was not the case, based on the use of less comprehensive datasets. Second, really significant losses also occur in Southeast Asia and in East Asia, and to a lesser extent in South America. The other geographical areas contribute relatively few to the global total.
The data also shows the strong seasonality in some areas, with stepped rather than linear trends. This is clear for South Asia and East Asia, showing the influence of the summer monsoon.
But there is also something here that I had not noticed before. The South America data shows a strange trend in that there was a notably higher landslide rate in the period 2009 to 2012 than in the periods before and after. I am not sure as to the causes of this. Is it a data issue or was there really a change in landslide occurrence in that period? That requires further investigation.
And finally, hidden in the data is an interesting trend in the data for Africa. Whilst the overall number of recorded landslides is low (probably too low in reality, suggesting that not all events are being captured), the general trend is accelerating dramatically. This is of significant concern.
Sources
The data are described in detail in Petley (2012) and Froude and Petley (2018), and in the associated blog posts.
References
Froude, M. J. and Petley, D. N. 2018. Global fatal landslide occurrence from 2004 to 2016. Natural Hazards and Earth System Sciences, 18, 2161-2181, https://doi.org/10.5194/nhess-18-2161-2018.
Petley, D.N. 2012. Global patterns of loss of life from landslides. Geology 40 (10), 927-930.
4 February 2020
Mina Pecket: a dramatic landslide in an open cast coal mine in 2014
Mina Pecket: a dramatic landslide in an open cast coal mine in 2014
In recent years I have repeatedly highlighted the high rate of landslides associated with mining operations. Regular reader Hig kindly highlighted an interesting example to me in Patagonia, which is well-imaged on Google Earth. This is at Mina Pecket in the very south of Chile, location -52.96, -71.16. At this location there is a large open cast coal mine close to a fjord in Punta Arenas. This Google Earth image, collected in October 2013, shows the site. The yellow bar is 200 metres long, showing that this is a large mine:-
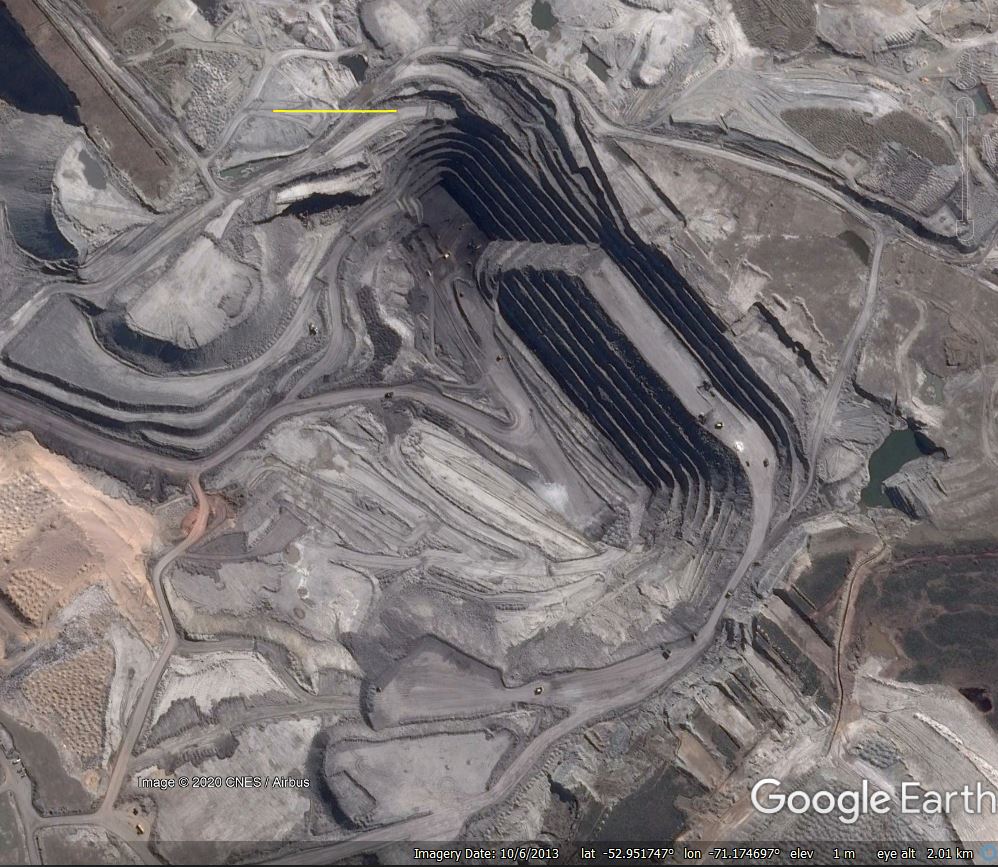
Google Earth image of Mina Pecket in October 2013. The yellow bar is 200 m in length.
.
The Google Earth image below was taken in September 2016. The northeast face of the mine has collapsed completely.
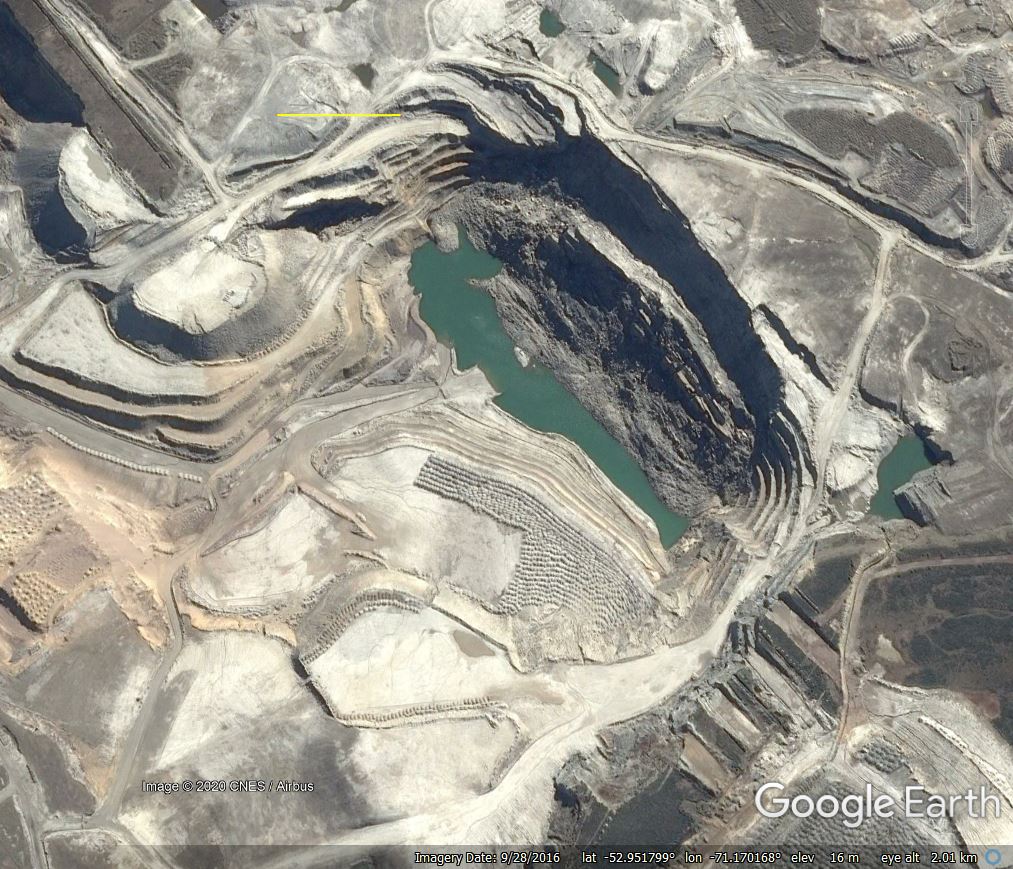
Google Earth image of Mina Pecket in September 2016. Note the large collapse of the northeast face of the mine. The yellow bar is 200 m in length.
.
The image below provides a better perspective of the collapse itself:-
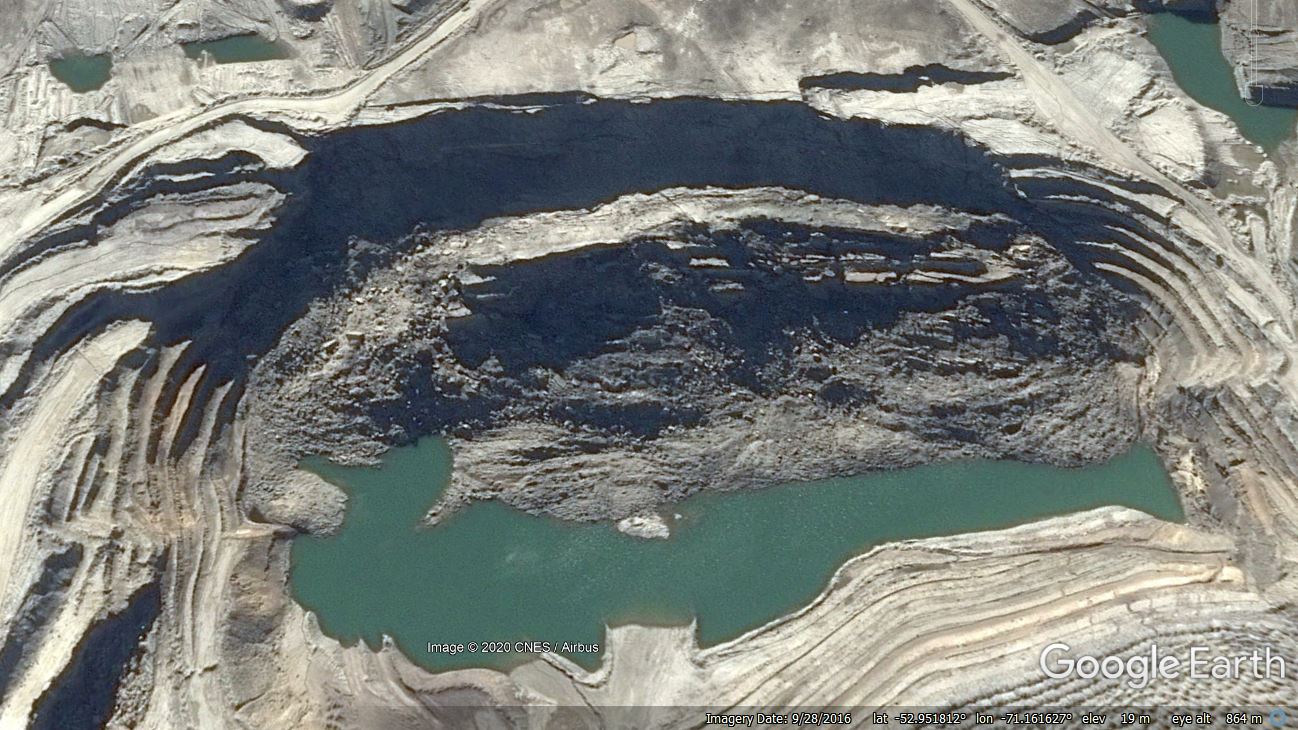
Google Earth image of the collapse at Mina Pecket, taken in September 2016. The yellow bar is 200 m in length.
.
The collapse appear to be a very large slump that has involved a block approximately 650 metres long and 300 metres wide. According to news reports, the landslide occurred on 1 April 2014. In the aftermath of the landslide, Sernageomin, the National Geology and Mining Service, presented the operator with a 120 day deadline to outline how operations would be reactivated at the mine. However, in August 2014 operations were suspended for a minimum of two years. Satellite images suggest that operations at this part of the mine at least have not restarted.
This appears to be another case of a large landslide disrupting mining operations. It would be interesting to know more about the failure, and in particular whether the collapse had been anticipated.
3 February 2020
Gongo Soco mine: Planet Labs images of the movement of the rock wall
Gongo Soco mine: Planet Labs images of the movement of the rock wall
Back in October 2019 I posted about the very large-scale deformation occurring in the rock wall above the Sol Superior tailings dam at the Gongo Soco mine in Brazil (location: -19.957, -43.599). This closed gold and iron ore mine, operated in recent years by Vale, has had a number of stability issues in recent years, of which the deformation of the rock wall is the most serious.
This part of Brazil suffered extremely heavy rainfall in the second half of January, inducing landslides and flooding that claimed a large number of lives. Last week Vale raised the alert level at Gongo Soco after the rainfall eroded the structure of the Sul Inferior dam, although to date no failure has occurred. Meanwhile the alert level for the Sul Superior dam remains at “Level 3”, which indicates that failure of the structure is “imminent or underway”.
I have taken a look at the Planet Labs images of the rock wall above Sul Superior dam, following up from my post in October. This is the image that I posted then:-
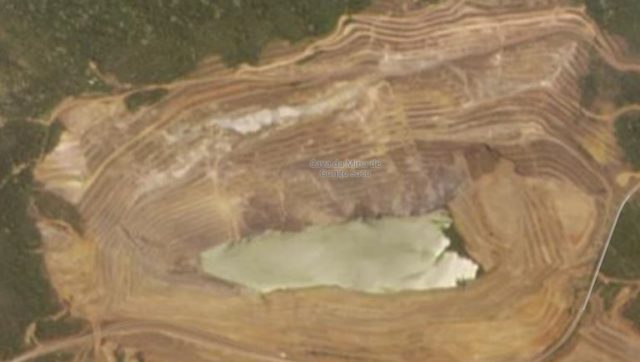
Planet Labs PlanetScope image of the Gongo Soco mine. Image dated 18 October 2019, copyright Planet Labs, used with permission.
.
This is an image that Planet Labs captured on yesterday, 2 February 2020, again using the PlanetScope instrument:-
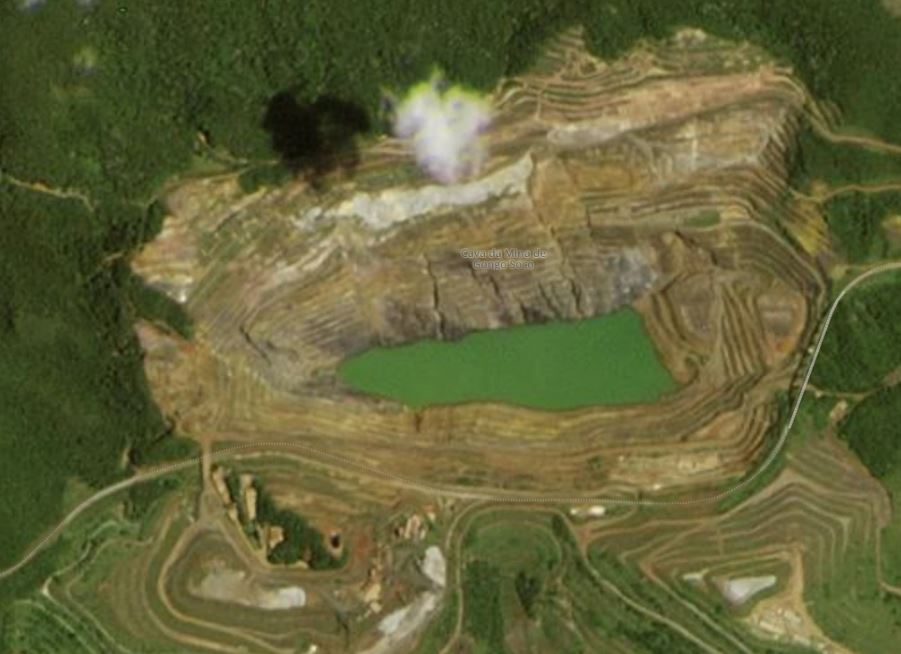
Planet Labs PlanetScope image of the Sul Superior site at the Gongo Soco mine in Brazil, showing the deformation of the rock wall. Planet Labs PlanetScope image, captured 2 February 2020. Copyright Planet Labs, used with permission
.
It is clear that in the three month period between the two images the slope has evolved considerably. Most notable is the growth of the fresh rock surface at the crown of the landslide (immediately below the small cloud in the image above). This appears to be over 50 m long from top to bottom and over 300 m long across the slope. The implication is that the entire mass has slipped considerably. The fractures running from top to bottom on the slope are now better developed, indicating that the mass continues to deform.
The slope is being monitored 24 hours a day by Vale’s Geotechnical Monitoring Centre. Unfortunately, as far as I can tell, this data is not online.
Reference
Planet Team (2019). Planet Application Program Interface: In Space for Life on Earth. San Francisco, CA. https://www.planet.com/
31 January 2020
Do trees make slopes more stable?
Do trees make slopes more stable?
A common comment on this blog, or on Twitter, in the aftermath of a landslide is that it could have been prevented by the planting of trees. It is widely believed that trees increase slope stability, and thus reduce the likelihood of landslides. This feels logical, and of course there is a long history of landslides in the aftermath of wildfires or in the period after deforestation. However, the quantitative evidence that planting trees decreases landslide susceptibility is surprisingly poor, but some studies have suggested that tree planting can sometimes be detrimental to overall stability.
In that context, a new paper published in the journal Landslides (Lan et al. 2020), which reports a study that seeks to explore this topic, is particularly welcome. To do so, the authors built a model slope, 80 cm long and 20 cm wide, onto which they “planted” artificial trees, with a simulated root network. The slope was then sprayed with simulated rainfall via a nozzle system, and the likelihood of failure was determined. A range of conditions were investigated, with a variety of slope angles and with different patterns of tree planting. In total 12 experiments were conducted, and the behaviour of the slope was both observed and modeled. In each case an experiment was conducted with no trees present as a control, as shown in the figure below.
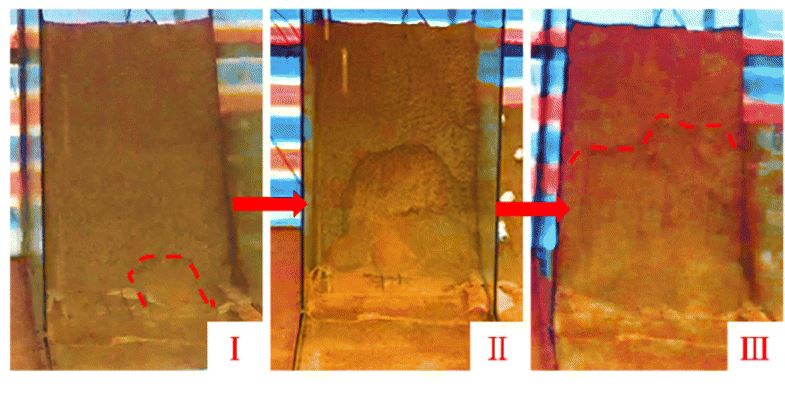
The development of slope failure in a simulated slope – in this case on a 60 degree slope. From Lan et al. (2020).
.
The results are interesting and perhaps surprising. For lower gradient slopes (20º and 35º in the model), tree planting increased slope stability. It should be noted that in the real world a 35º slope would be considered to be very steep. However, on steeper slopes (50º and 60º), tree planting reduced stability. The pattern of planting of the trees changed their effectiveness in terms of reducing landslides. The most effective pattern was found to be dense, wide bands of trees with spaces between the bands. This was found to be more effective than an even distribution of trees across the slope.
There are caveats to a study like this, of course. The first is that scaling between model slopes and the real world is notoriously difficult. This is the reason that centrifuges are used to simulate slope behaviour – this study really needs such equipment to be reliable. Second, there is a problem with the grain size of the simulated soil, which does not scale properly. And finally, the model does not really simulate the complex relationships between trees and the soil – for example, to what degree does the presence of trees change the physical characteristics of the soil through time?
But nonetheless, this is a really useful study in that it highlights that tree planting on slopes is a complex issue. It is clear that it can be beneficial in lower gradient slopes, assuming that the slope is sufficiently stable that the trees can become established (this is a big problem in active slopes, like those undergoing coastal erosion). But, effective planting is an expert task, and needs careful design.
Reference
Lan, H., Wang, D., He, S. et al. 2020. Experimental study on the effects of tree planting on slope stability. Landslides. https://doi.org/10.1007/s10346-020-01348-z
29 January 2020
The role of weak pumice layers in landslides triggered by the M=6.7 6 September 2018 Hokkaido Iburi-Tobu Earthquake
The role of weak pumice layers in landslides triggered by the M=6.7 6 September 2018 Hokkaido Iburi-Tobu Earthquake
On 6 September 2018 the M=6.7 Hokkaido Iburi-Tobu earthquake triggered large numbers of landslides in Japan. A subsequent analysis (Yamagishi and Yamazaki 2018) suggested indicated that over 6,000 landslides were triggered, resulting in 36 fatalities. They suggested that the exceptionally high landslide initiation rate probably resulted from high susceptibility of the local geology to earthquake shaking.
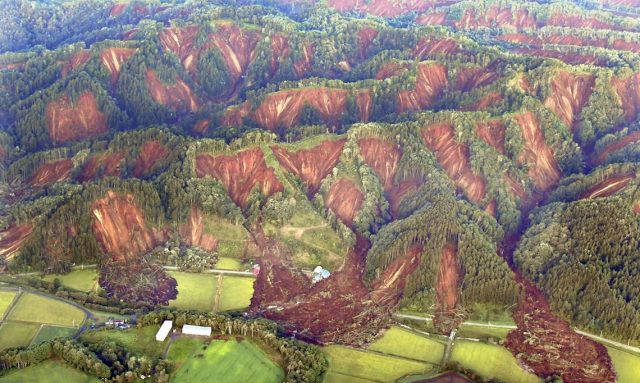
The area of intense landslides from the 06/09/2018 Hokkaido Iburi-Tobu earthquake. Image via Tokyo Keizai.
In a new study, Li et al. (2020) have examined the role of weak pumice layers in the triggering of these landslides. The landslides occurred in an area of pyroclastic deposits from the various volcanoes located in the vicinity. Field mapping suggests that there is a particularly weak pumice layer, the so-called Ta-d strata, which dates from an eruption of Tarumae volcano about 8,700 to 10,000 years ago. The image below, from Li et al. (2020), shows the complex layering in these landslides, including the Ta-d pumice low down in the section.
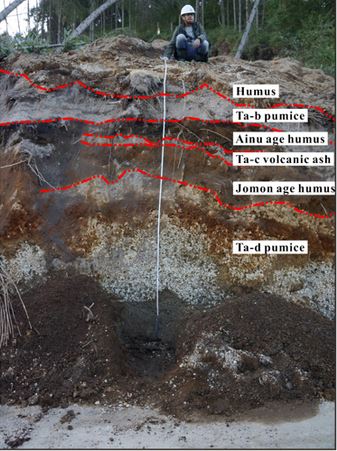
A vertical section through one of the landslide scarps from the M=6.7 6 September 2018 Hokkaido Iburi-Tobu Earthquake. Image from Li et al. (2020).
.
Li et al. (2020) consistently found that the Ta-d pumice layer acting at the sliding layer in the landslides triggered by this earthquake. They have undertaken a series of laboratory analyses of this material, finding that it is extremely susceptible to liquefaction. They have concluded that a lower permeability palaeosol under the pumice layer enabled seepage parallel to the slope, which may have weakened this layer over time. When subjected to ground accelerations in excess of about 5 m/s2 the pumice layer underwent liquefaction, reducing shear strength to close to zero, allowing the slopes to fail.
This paper provides an elegant explanation for the extensive landsliding that occurred in the M=6.7 Hokkaido Iburi-Tobu earthquake. As we found in our work in New Zealand (Massey et al. 2013), thin layers of weak volcanic materials can often control the susceptibility of slopes to failure. This is probably the most extreme version of this effect that I have seen to date.
References
Li, R., Wang, F. & Zhang, S. 2020. Controlling role of Ta-d pumice on the coseismic landslides triggered by 2018 Hokkaido Eastern Iburi Earthquake. Landslides https://doi.org/10.1007/s10346-020-01349-y
Massey, C.I., Petley, David and McSaveney, M.J. (2013) Patterns of movement in reactivated landslides. Engineering Geology, 159, 1-19.
Yamagishi, H. & Yamazaki, F. 2018. Landslides by the 2018 Hokkaido Iburi-Tobu Earthquake on September 6. Landslides. https://doi.org/10.1007/s10346-018-1092-z.
 Dave Petley is the Vice-Chancellor of the University of Hull in the United Kingdom. His blog provides commentary and analysis of landslide events occurring worldwide, including the landslides themselves, latest research, and conferences and meetings.
Recent Comments