
3 July 2010
Attabad – Analysis of NDMA data on lake level
Posted by Dave Petley
Yesterday’s daily update from NDMA contained a new, and very welcome addition: a graph showing lake level, starting 29th May (the date of overtopping). The y-axis is slightly confusingly labeled on the sheet (the label having been added later by the looks of it), but is clearly the lake level (in inches – NB 1 inch = 2.54 cm) above the spillway base level at the time of overtopping:
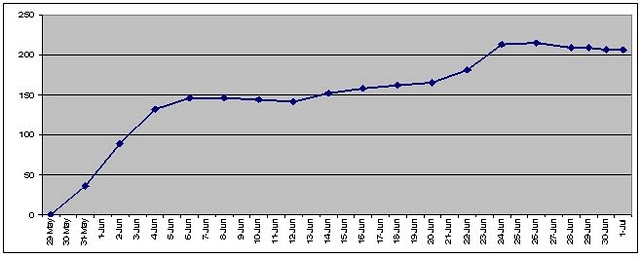
There appears to be a datapoint every two days until the last four days (which have daily data). This data suggests that the water level peaked on 24th-26th June, and has subsequently fallen somewhat, which is really good news. This coincides with the cessation of reports about houses being flooded.
This of course allows one to check the data that I have been publishing against the NDMA data. Below is the graph of my data up to the point that the feed ceased for me (the points are daily rather than two daily), with the lake level above the overtopping point in inches on the y-axis
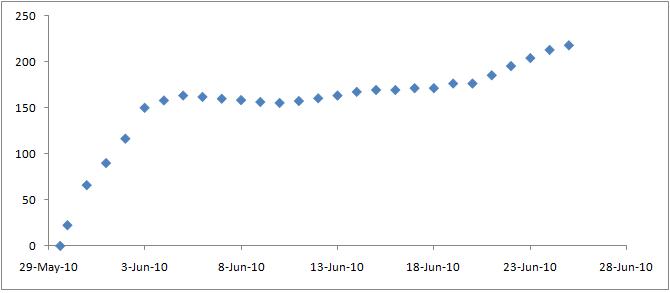
There are some minor differences, as one would expect of two different datasets of the same natural phenomenon (the major difference is that my data are slightly higher for the middle part of the dataset), but the similarity between the two graphs is striking, which is reassuring at every level. The peak water levels recorded are almost identical (within +/-2% of each other).
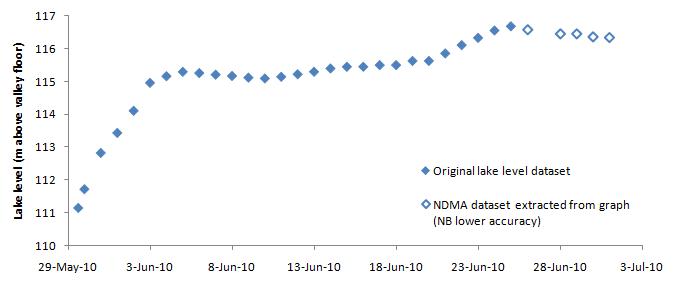
I am still struggling to reconstruct the more recent changes in water level, so I have used a tool that extracts data from graphs to determine (probably +/-2%) the most recent lake level data from the NDMA plots. I have then added this to my data below to generate a compound graph. The open symbols are the NDMA data:
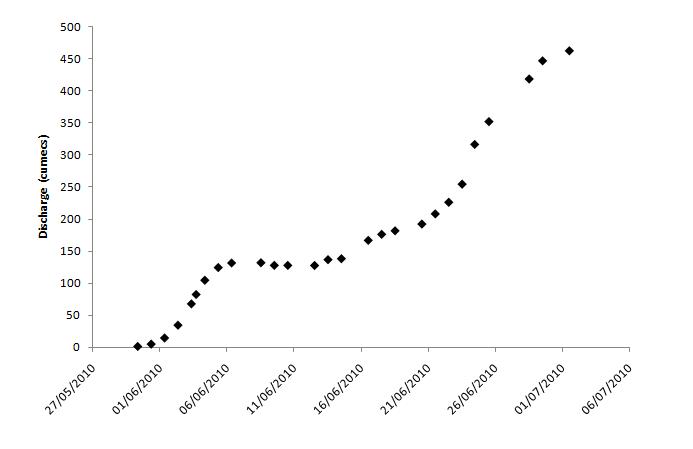
Spillway discharge has also substantially increased. I have tried to continue to compile reported spillway flow figures, cross-checking these against the Ganesh Bridge data that NDMA reports. Where the data are consistent I have included it; the resulting relationship between discharge and time looks like this:
Perhaps most interesting is the relationship between spillway discharge and lake depth:

There is a fascinating level of complexity in this plot that will deserve better analysis in due course (there are going to be some great papers from this example), but it is clear that the relationship between discharge and lake level is now changing, with continued increases in discharge even as lake level falls. This suggests that the spillway efficiency in transporting water is increasing. I wonder if this is because the spillway is now downcutting, or because widening (natural or artificial) is starting to have a real effect. It will be worth watching this over the next few days. It is a great shame that we have no images from the site at the moment.
All-in-all the situation on the ground is evolving, which means that we are still moving towards some sort of resolution. Of course we expect to see inflow continuing to increase over the next few weeks.
 Dave Petley is the Vice-Chancellor of the University of Hull in the United Kingdom. His blog provides commentary and analysis of landslide events occurring worldwide, including the landslides themselves, latest research, and conferences and meetings.
Thank you Dave.Let us hope the flow of information will improve soon with some pictures of the spillway.I hope there is from nowhere any intentional boycott of information. There is no place for that kind of sour game when affected populations are still in danger, when their villages and orchards are already devasted upstream and at risk downstream. We need the synergies of all, actors, experts and researchers.Thus I want once again to witness publicly here that your blog is very neccessary and highly valuable when fed by a regular flow of informations. I understand that managing natural disasters requires to combine different fields of knowledge, hydrology but also geology, what is the solidity or fragility of the dam, what are the pending risks of new landslides etc. etc. This is complicated and subject to so many variable hazards… You are a researcher and an expert when most of us and some actors are not, and your blog makes things understandable. There is no magic or readymade solution and I therefore appreciate your bundle of relevant observations, comments, some certitudes by experience and as many incertitudes for the specific case in Hunza. That is exactly why this blog is reliable and the open forum of courteous dicussions is an added value. I am sure all the users of this blog will agree and support your efforts.Georges Lefeuvre
The human widening of the spillway should be clearly labeled on the graphs.
I agree with Georges
The videos taken Friday the 2nd ( http://www.youtube.com/watch?v=j0SvVIMxygg and http://www.youtube.com/watch?v=b-zPSWJ3iTo , which were pointed out in a comment in Dave's other blog) appear to show the isolated boulder still being a major impediment. (Its still right in the middle, and water just piles up on it before sliding off to the left and right).But compared to the Pamir times images from a week ago (and the other video taken about the same time) there is significant deepening of the pathway that goes around this boulder on the right (far) side. Now this bypass channel is mostly smooth flowing blue water until it gets beyond the boulder, whereas a week ago it was turbulent white water starting several meters upstream. (compare to image 3400 at http://pamirtimes.net/2010/06/28/deadline-given-by-protesters-for-excavation-of-the-spillway-ends-today/)
I agree that the right bypass channel around the top midstream boulder seems to have deepened, but still emphasise that this boulder does NOT govern flow or level. The water piling up on the upstream demonstrates a fountain effect where the obstruction resolves kinetic energy back to potential energy without much loss to turbulence effects. The water has already descended considerably as the speed at the boulder shows.The principal obstruction still appears to me to be at the top of the V just above where the white eddies end.I would consider drilling from the bank and blasting at that point, but that would not much affect the slab I suspect at the bottom there, but blasting at the bank might effect a bypass of the slab.The video reinforces my suspicion that the situation is being left to nature.George
There are two big boulders in the center of the spillway.The first one is located at higher elevation and shown in the video from 0:13 to 0:22. The second one is shown from 0:27 to 0:38.http://www.youtube.com/watch?v=j0SvVIMxygg Starting with the lower, second boulder. I hope we can agree that it does not hold back any water, since its elevation is so low.The first one, at the higher elevation, is not quite as clear. That said, I agree with George that the restriction is very little, if any, on the total flow.I think it should be noted that the water rides up on both boulders, and both add turbulence to the river.In regards to the upper boulder, George claimed, "The water has already descended considerably as the speed at the boulder shows." This I agree with. The elevation of the upper boulder is low enough that it's not a major flow issue. The water has simply found a path around the boulder. If the boulder were removed, my guess is very little, if any, increase in total spillway flow would take place. The bottleneck restriction is further upstream.As far as this forum–I wish to thank Dr. Dave for his continued effort placed on covering this event. Thank you.
Well, as a first approximation, the resistance (R) to flow (F) can be estimated by the pressure differential (i.e., the difference in water height), since we know that F is constant all along the channel. R= delta P / FAlthough the exact magnitute is hard to discern from the videos, they (and the photos from last week) show pretty clearly that the water level drops substantially (a couple of meters?) after this boulder, but not really very much in the stretch leading up to it.Looked at another way, the water that backs up in front of this boulder is preventing the water a meter behind it from moving forward as fast as it could (which retards the water a meter behind it, … and so on). IOW, remove that boulder and the water level at it's current front face would drop a meter or so, and thus the pressure differential driving the water up to that point will increase.So, IMO, right now that boulder is the choke point. Once it's out of the picture, the choke point will be move up stream and the rocks creating the V pattern will probably become the significant barrier.BTW, I wonder if they can get someone with a drill onto that rock via a cable (or 3!) stretched across the spillway? (not that I'm volunteering to do it 🙂 It's certainly a smaller object than that massive rock formation they demolished out at the point.
Divalent-Just to have some fun. The other day I was at a waterfall. I hope we can agree as to what a waterfall is:It's a spot in a river where the water suddenly drops at nearly a 1.57 angle.I offer, for example, Niagara Falls:http://en.wikipedia.org/wiki/Niagara_FallsWhy do I offer this example? For starters there is a big land mass in the falls. Other reason is that it is clearly nearly a 1.57 angle.What would happen if we removed that large land mass in the center of the falls? What would have happened if it were never there? Would the water flow today be different?This boulder, however, is down in elevation. However we disagree as to how low it is. I think we both will agree that the lower boulder does not impact total water flow in the spillway, even though it too provides some resistance to current flow, at least locally. The total current flow in the system would be the same if the lower boulder were removed.Now, I suppose, we just need to discuss if the boulder is part of the bottleneck. If it is significantly restricting flow, then removing it would create a significant increase in flow, at least until the system was once again relatively stable.I do agree, however, that if it is restricting flow, then removing it will have an impact. Where we disagree is whether the upper boulder actually provides a significant restriction, even if the water falls 2 meters or more in the vicinity. The water falls many more meters in Niagara Falls, but removing that land mass would not drain the four upper Great Lakes, or would it? Let's start with Superior, and please note the set of locks at Sault Sainte Marie.
At certain steep outflows the engineers put in energy dissipators, basically rows of cement teeth with stagger so that lower rows intercept the flow that misses the upper row(s). In the natural case as seen in this spillway, the current speed is but a small fraction of the speed that would be achieved in an unimpeded drop.In both cases the energy dissipators below the outlet have no effect on the flow at the top.If an obstruction below the lip does have an effect on total flow, the upstream pillow wave pattern would be visible up to and perhaps above the lip.That is not seen here. There is an earlier estimate of an 8 metre height for the boulder above the downstream water level and perhaps a 2 m. drop at the boulder yielding a 6 m. drop above the boulder.The upper V at the entrance to the spillway appears to be laminar flow artifacts as the water speed is increasing there.George
Ultimately this isn't about this one boulder or that one boulder, but rather the fact that the lake's water level continued to increase after the initial spillway flow. Had the lake level held constant, or gone down, then this discussion would not be about this restriction or that restriction.The inflow continued to increase, and the inflow was greater than the outflow, so the lake level continued to increase. This brought a high level of frustration to the locals, especially those with property at points where small changes in lake elevation covered large areas of land.If this were an uninhabited area, without a major highway, there would be far less discussion.As far as "energy dissipators," what happened to the conservation of energy? (lol)Note, however, that to slow the water down those "energy dissipators" increase the depth of the water.
http://www.youtube.com/watch?v=QCagYRecgiUNot very useful unfortunately
The video referenced by Ivan at 0:49 onwards usefully shows one of the slabs stuck into the left bank by where the roadway collapsed. The size is illustrative of what lies on the streambed higher up. Interestingly this slab and its brother in the midstream alongside are standing on end. There seems to have been a process within the landslide that resulted in slabs deposited on end in some areas and flat in other areas. It would also be interesting to determine how such large slabs did not break up on their way down (but note that one slab leaning on the right bank broke up due to undermining and left the upper midstream boulder as a remnant) — perhaps there was an unconsolidated layer below that cushioned the ride down. I have seen similar slabs over unconsolidated layers in the Kicking Horse Canyon in British Columbia which keep the local highway maintenance crews busy.George
The NDMA did release a report yesterday (july 5th) but they gave it the wrong name, so the link at their site does not pull it up. You can get it at http://ndma.gov.pk/Documents/Hunza_Landslide_2010/One%20Pager%2003%20July.doc (the error is that the file name is for july 3rd)It does not have an updated flow rate (data unavailable, they say). But does have an updated lake level graph. There appears to be no change, although there is what appears to be a blip down on one day's data (roughly a 1 ft drop, but then back up the next day). That is probably an error.