
29 July 2014
Oso landslide: differences of opinion about the landslide mechanisms
Posted by Dave Petley
Oso landslide analyses
The journal Science is reporting an interesting public argument about the mechanisms of the Oso landslide in Washington State, USA. This is between the authors of the GEER report (NB pdf), which was released last week, and Dr Richard Iverson of the USGS, and is in essence about the chronology of events that generated the very rapid debris flow event that was so costly. I wrote about the GEER report last week, and noted that they interpret the sequence as being a two-fold failure event, as indicated by the seismic data. The latter is not controversial – there is a nice (pdf) report from the Pacific Northwest Seismic Network that shows this double event very clearly:
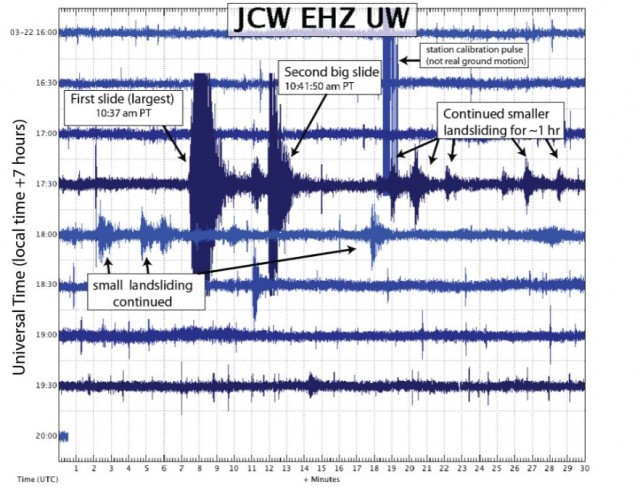
http://wa.water.usgs.gov/data/SeismicReport-OsoLandslide.pdf
.
In the GEER interpretation of the Oso landslide the lower slope failed first to generate the rapid flow event, followed by the second failure, which was in effect a retrogression of the landslide as a new block slid onto the main mass, and then stalled. This is consistent with the fact that the first event generated a much larger seismic signal; and the fact that the, second seismic signal appears to terminate quickly.
However, in the Science report, Dr Iverson disagrees with this interpretation of the Oso landslide, based on a more detailed analysis of the seismic signals The report notes that:
“But Richard Iverson, a landslide expert at USGS’s Cascades Volcano Observatory in Vancouver, Washington, says that a closer look at the seismic data tells a different story. “The USGS disagree[s] significantly with several aspects of the GEER report,” Iverson says. According to the unpublished analysis by scientists with the USGS and the University of Washington, all the important action appears to have been compressed into a rapid chain reaction in the first few minutes. The lower slope began to slide slowly, but just 50 seconds after that began, an upper part of the mountain broke loose and collapsed onto it. The violence of that impact could cause the soil to rapidly liquefy and shoot across the valley, much like a foot slamming down into a mud puddle, he said. Iverson and scientists working with him concluded the second incident recorded in the seismic data was an ‘extremely small event.'”
I have no experience of interpreting seismic signals from landslides, so struggle to comment either way on this interpretation. I think I can see the essence of this interpretation in the data from the more distant seismic stations:
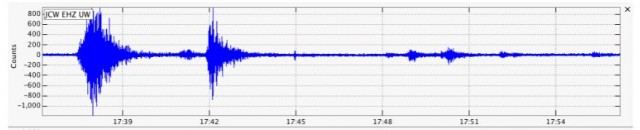
http://wa.water.usgs.gov/data/SeismicReport-OsoLandslide.pdf
.
To my untrained eye the initial seismic event shows a slow increase in energy release rather than an abrupt peak. Note also that the second event appears to be much smaller than the first. Thus, in this interpretation, the initial failure was, I think, a small, slow failure in the lower slope that destabilised the upper block of the Oso landslide, which slid onto the mass below. This then generated massive undrained loading, allowing the generation of very high pore water pressures, and hence the high mobility flow. The second seismic event is interpreted as being “extremely small”.
I think one can take issue with the latter statement – if it was extremely small it would not have generated a seismic signal, surely – but the point is that it is relatively small when compared with the first failure. The Science have clearly put this alternative interpretation to the GEER team, and report as follows:
Responding to Iverson’s critique, GEER co-leader Jeffrey Keaton, an engineer at AMEC Americas, a private engineering firm, says that observations in Oso helped convince them that much of the mountain collapsed a few minutes after the initial slide. Large chunks of relatively intact earth still covered with trees would probably have broken up if they had been part of the first slide, he said. And swaths of sand had flowed up onto the back end of the first slide, suggesting it happened after the first slide slowed to a halt.
The data that is available is insufficient to be able to make a definitive argument either way on this – the next key step will be publication of the UGSG analysis that supports their line of argument. In essence the issue is the chronology of events shown in this Seattle Time image of the landslide:
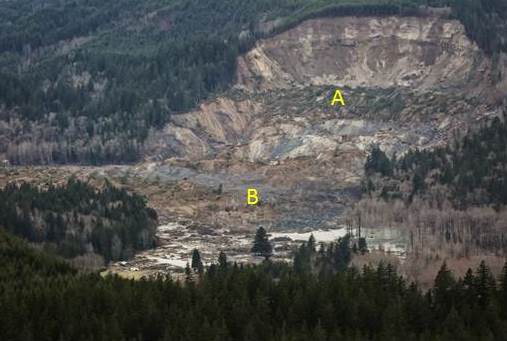
Image: Seattle Times
.
At the end of the day, this comes down to whether the most likely scenario is that the block that was formed from material marked B above failed (event 1), allowing block A to slide in (event 2); or whether block A failed, causing massive collapse of block B (event 1) followed by a small but at present unknown slide that generated event 2. I would guess that a very detailed analysis of the deformation at the front end of block A might help – if this block moved after Block B had failed then there should be some impressive compressional deformation features preserved in this area. Maybe the very high quality Google Earth imagery collected on 1st April would allow someone with the right skills to make an interpretation?
Personally I can see merits in both interpretations, so will watch with great interest as this is resolved.
 Dave Petley is the Vice-Chancellor of the University of Hull in the United Kingdom. His blog provides commentary and analysis of landslide events occurring worldwide, including the landslides themselves, latest research, and conferences and meetings.