
22 May 2014
Crafting Your Own Visuals for Science Communication: Part II
Posted by mcadams
Editor’s Note: This is the second in a two-part series about creating science visuals. Click here to read Crafting Your Own Visuals for Science Communication: Part I.
By Ilissa Ocko
You don’t need fancy software like Adobe Illustrator to create a nice science visual. You can create a graphic in basic, accessible software, such as Microsoft PowerPoint.
The PDF below walks you through the creation process from start to finish, with the objective of creating the below landscape schematic using PowerPoint. Learn tools and insider tips along the way! (Click on the link or the image below to open the PDF.)
Creating a landscape schematic using Microsoft PowerPoint by Ilissa Ocko (PDF)
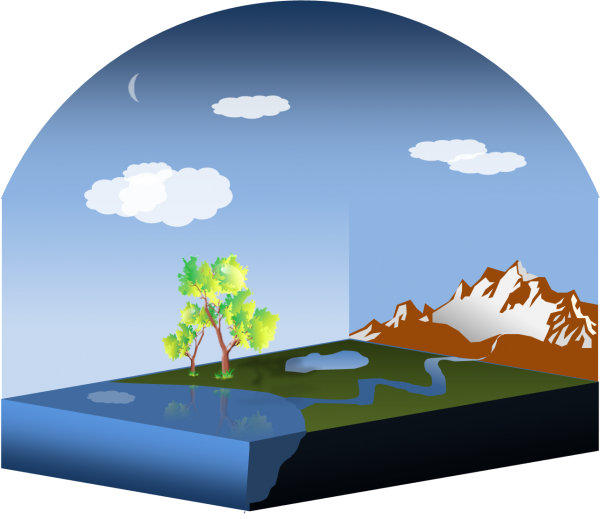
Image by Ilissa Ocko.
Other free or more affordable software for graphic design, suggested by members of the Earth Science Women’s Network, include:
- Inkscape (free and open source)
- iDraw ($28)
- Lucid Chart and Draw.io (applications that run in the Google Chrome web browser, can automatically save your work to your Google drive account, free)
— Ilissa Ocko is a climate scientist at the Environmental Defense Fund in New York City.
Editor’s Note: Did you use Ocko’s guide to create a science graphic? Share your graphic with others via the comments section below.


 The Plainspoken Scientist is the science communication blog of AGU’s Sharing Science program. With this blog, we wish to showcase creative and effective science communication via multiple mediums and modes.
Thanks a lot – nice help and useful guide !
I use Gimp as a freeware alternative to Photoshop. Good online community of resources to search as well to make it powerful.
Excellent resource for an ambitious science teacher!
This is great! Thanks so much for sharing.