
15 September 2015
Live landslide monitoring data from Nepal
Live landslide monitoring data from Nepal
One of the great uncertainties in the aftermath of the April 2015 earthquake in Nepal was the likely behaviour of damaged slopes. It is well documented from other earthquakes, such as the 2005 Kashmir (Pakistan) earthquake and the 2008 Wenchuan (Sichuan) earthquake that many landslides occur after the main earthquake. Unfortunately our ability to forecast numbers of events and their locations is poor, mainly because of both a lack of understanding of the mechanics of these earthquake damaged slopes and of course the huge uncertainties about the likelihood of the meteorological events that trigger them. This is an image from after the 2005 Pakistan earthquake, showing just some of the cracked slopes:
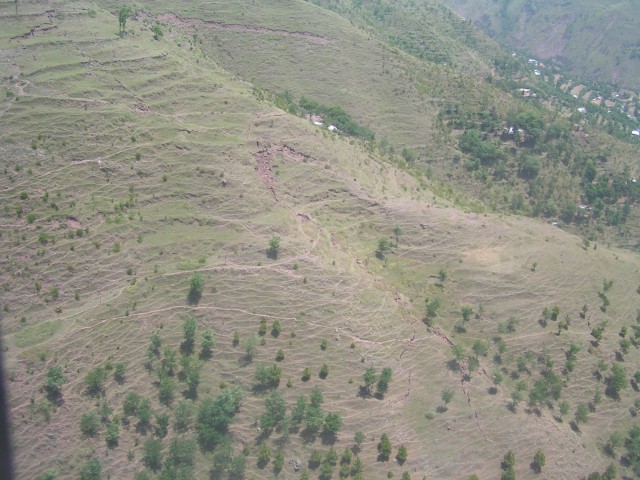
Cracked slopes in Kashmir after the 2005 earthquake
.
Amazingly, most of the slopes above have not failed since the earthquake and indeed most of the cracks have “healed” up and are now invisible.
My former colleagues at Durham, led by Dr Nick Rosser, have set up a project in Nepal to monitor slopes damaged by the 2015 earthquakes, funded by the UK research council NERC. Working with a range of partners in Nepal, they have installed landslide monitoring instruments in ten slopes in the earthquake affected areas. Interestingly, they are streaming the data live to the web via a graphing package. You can view the data on each of the instruments on their website. As the instruments are newly installed the data is mostly noise at present, though there are some interesting daily patterns that might or might not be important. It will be worth keeping an eye on this data in the coming months, especially if Nepal were to suffer a late monsoon rainfall event.
On their blog, the team have provided a description of the aims of the landslide monitoring project:
Our overall aim is to determine how hillslopes damaged during the 2015 Nepal EQS progressively deform in response to stress perturbations resulting from precipitation and continuing seismicity. Our proposed study site is the Upper Bhote Koshi (UBK), in Sindupalchowk District. The UBK was damaged during eqG, was < 10 km from eqK, and satellite and aerial imagery shows considerable widespread damage to slopes as a function of the close by (< 5 km) eqD. The critical Arniko Highway to Tibet, several major HEP plants, plus extensive roadside settlements, are all within the UBK. Our initial assessments from imagery indicate that EQ-triggered landsliding from eqK is characterised by small-scale but widespread rockfalls, and from eqD large-scale rockslope failures from ridgelines and reactivation of existing deeper-seated landslides, each with a clear directional tendency relative to the three epicentres). Colleagues in the UBK report extensively-cracked valley slopes, as seen in reconnaissance aerial photography from colleagues at USGS/USAID. Our data will most importantly quantify the relationship between stress perturbations and landsliding, but will also provide ground-truth for remotely-sensed deformation.
14 September 2015
The Rilpola, Badulla landslide in Sri Lanka: a 3D rendering
Rilpola, Badulla landslide in Sri Lanka
On 27th December 2014 heavy rainfall in Sri Lanka triggered landslides and floods. In our database we recorded nine landslides that caused loss of life, with a total of 22 deaths. The largest event in terms of loss of life occurred at Rilpola, where eight people were killed. JICA, the Japanese international aid agency, has placed on the Sketchfab website a 3D rendering of a landslide at Rilplola, which I assume is the one that took the eight lives. The 3D rendering is pretty cool, and should be visible below, though this does not seem to work in all browsers. If not it can be accessed here):
Landslide – Rilpola, Badulla, Sri Lanka
by srimalsl
on Sketchfab
.
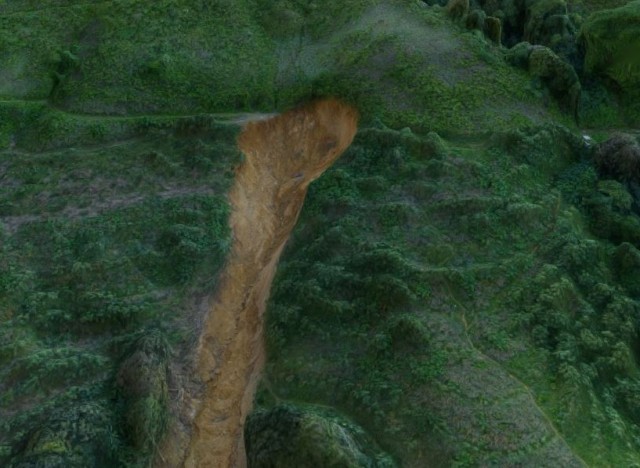
So a couple of observations about this landslide from the imagery, such as this one of the crown of the landslide:-
.
This seems to be a landslide in heavily weathered soil, and the the upper area is perhaps surprisingly deep. The aspect that I find most interesting is that the point of initiation of the landslide coincides with a track – indeed the rear scarp of the slide seems to be a failure of the oversteepened track wall Looking at the morphology of the land around the landslide scarp would lead me to wonder if this had been showing a little bit of movement before the track was completed. The steep wall of the track, and perhaps dumping of fill on the downslope side to create the bench, appears to have been responsible for the landslide. This my have been compounded by changes to the drainage of water associated with the track as well – note the little gully just to the left of the landslide, and the lack of drainage around the track to manage this.
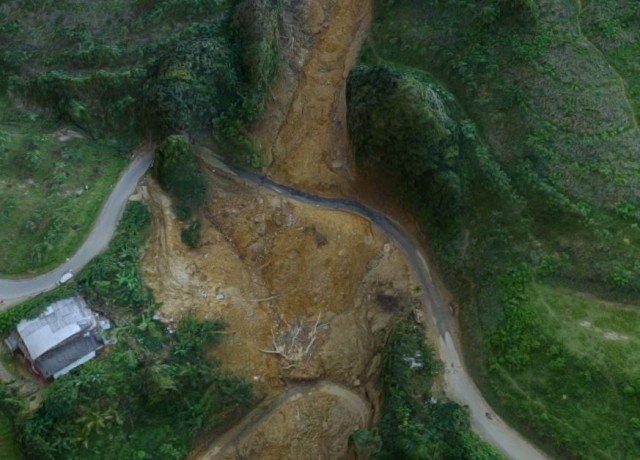
The landslide dynamics seem to have changed dramatically when it hit the road further down the hill:
.
Here the landslide appears to have spread out and started to go through a deposition phase. I am assuming that this is the area in which the fatalities occurred. It is likely that the landslide would have arrived here as a high velocity, high density flow.
Thus, this 3D rendering of the Rilpola landslide illustrates beautifully the potential harm of road building in these fragile landscapes, a problem that is repeated right across the mountainous parts of South Asia. These landslides are avoidable with even simple engineering on the roads.
11 September 2015
Weare Cliffs in Dorset – rockfall video
Weare Cliffs in Dorset
Earlier this week I posted about an ongoing landslide problem at on the Isle of Portland in Dorset, southern England, in which a progressive slope failure is causing repeated rockfalls and the development of tension cracks and ground disturbance. The coastal footpath has had to be rerouted, and members of the public are being warned to keep away. This morning several news agencies in the UK (e.g. the Daily Mail) are running with a video of the collapse of a section of cliff at Weare Cliffs:
.
.
Of course as this is the Daily Mail this is “the terrifying moment a cliff face collapses and disappears in a huge cloud of dust”. However, the article does provide some useful background. The video was collected by Sam Haskins. The Daily Mail article notes that:-
Mr Haskins, who was on a walk with his girlfriend, Bethany, said he had decided to visit the area as there had been a number of reports that the footpath had started to break away. ‘We’d heard there had been several small rock falls over the last few days and there were very large cracks appearing in the path and cliff face,’ he said.
My interpretation is that this is a rockfall at the front of the much larger progressively failing landslide block. As the topple develops (see image below) there is considerable rockfall activity. The block fragments after the collapse event.
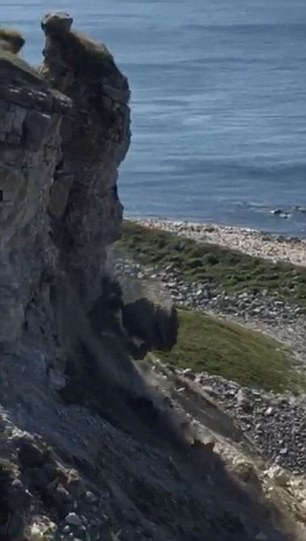
Weare Cliffs rockfall – from the Daily Mail
.
10 September 2015
The West Salt Creek Landslide, Mesa County – implications for hazard management
The West Salt Creek landslide, Mesa County
An interesting part of the Colorado Geological Survey report into the West Salt Creek landslide in Mesa County (White et al. 2015) is the section on long term implications and hazard management. It is worth looking at this section is a little more detail as it has wider ramifications.
Future hazards associated with the West Salt Creek landslide
The first part of this part of White et al. (2015) looks at the hazards associated with the West Salt Creek landslide itself, and the implications for this part of Mesa County. The most important element of this is the behaviour of the upper part of the landslide. The upper rotated block is shown in the photograph below, from White et al. (2015):
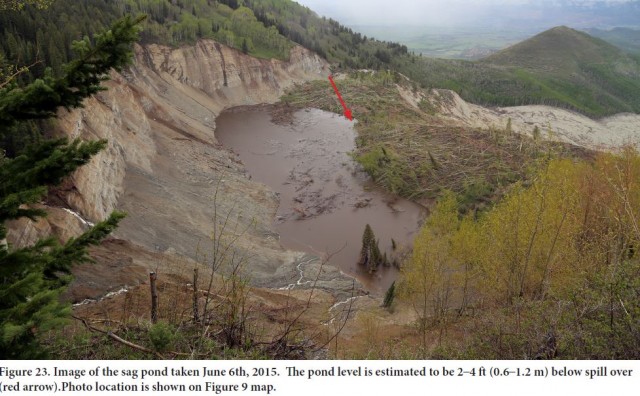
West Salt Creek landslide, Mesa County from White et al. (2015)
.
White et al. (2015) consider whether the rotated block is stable, concluding that it probably is, although its stability may be greatly reduced if the water level in the sag pond becomes too high. The sag pond itself came close to overtopping earlier this year, but is being drained through natural seepage. It is clear that there is considerable uncertainty as to how this system will behave in the future. There seems to be a higher level of concern about the stability of the steep slopes that form the headscarp, which shows signs of active deformation. White et al. (2015) raise the possibility that a failure in these slopes could lead to a comparatively large volume of material entering the sag pond, which could overtop to create another flow type event. This would appear to me to be a real concern, and probably needs both further investigation and an active monitoring programme (see below).
The report also raises the possibility of reactivation of portions of the flow deposit. White et al. (2015) note in particular that the rock blocks that form the deposit weather quickly when exposed to the air through slaking. This has the potential to reduce their strength, and thus to increase the likelihood of mobility. Combined with the potential for either further failures or reactivations of parts the upper slopes and/or parts of the the rotated block, or of the release of water from the sag pond, the likelihood of further flows cannot be ruled out. In addition the landslide will release sediment into the watercourse, which will have implications downstream. Thus, the landslide presents quite a challenge for Mesa County.
Recommendations beyond the boundaries of the West Salt Creek landslide
White et al. (2015) also consider the wider implications of the landslide. They note that the existing landslide mapping in this region is not adequate. Given that landslides of this type cannot be mitigated, avoidance and management of areas at risk is the only sensible approach to hazard management. The availability of high resolution LIDAR data means that the compilation of a high quality landslide map is possible. This is particularly pertinent in the context of the oil and has facilities in Mesa County – the report includes the following map of the locations of oil and gas facilities in the local area:
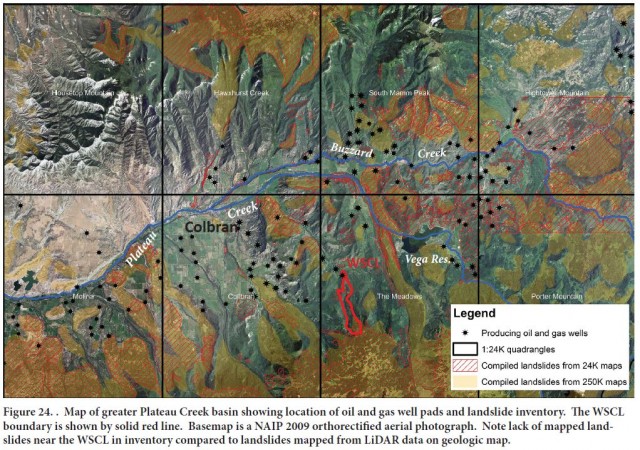
Map of oil and gas facilities in this part of Mesa County, from White et al. (2015)
.
And of course the report, quite rightly, recommends more detailed monitoring of the head scarp area of the West Salt Creek landslide. Whilst expensive, this would seem to me to be essential. In the meantime, the report supports the closure by the US Forest Service of the land affected by the landslide itself and the areas adjacent to the headscarp. Given the uncertainties around future behaviour, this seems very prudent.
It is hard to disagree with the conclusions and recommendations of the report, but in my view the measures proposed need to be underpinned by a systematic, long term landslide hazard mapping programme that covers a much wider area. Whether there is an appetite to incur this level of cost is unclear however. There is an excellent landslide inventory for the state on the Colorado Geological Survey website, but this has the caveat that:
This landslide inventory only reflects the location of landslides digitized from existing maps prepared by many different authors. No original landslide mapping was completed for this inventory.
Reference
White, J.L., Morgan, M.L. and Berry, K.A. 2015. The West Salt Creek Landslide: A Catastrophic Rockslide and Rock/Debris Avalanche in Mesa County. Colorado Colorado Geological Survey, 45 pp.
9 September 2015
West Salt Creek Landslide: Colorado Geological Survey report
West Salt Creek Landslide report
The Colorado Geological Survey has produced a report on the catastrophic West Salt Creek landslide, which killed three men on 25th May 2014. The report (White et al. 2015), which is available for download from the Colorado Geological Survey website, is an excellent piece of work. It provides a high level of insight into the conditions that led to the landslide, its behaviour during movement (which was very complex) and the long term hazards that the site now presents. It also provides some beautiful and enlightening images of the landslide, such as this one:
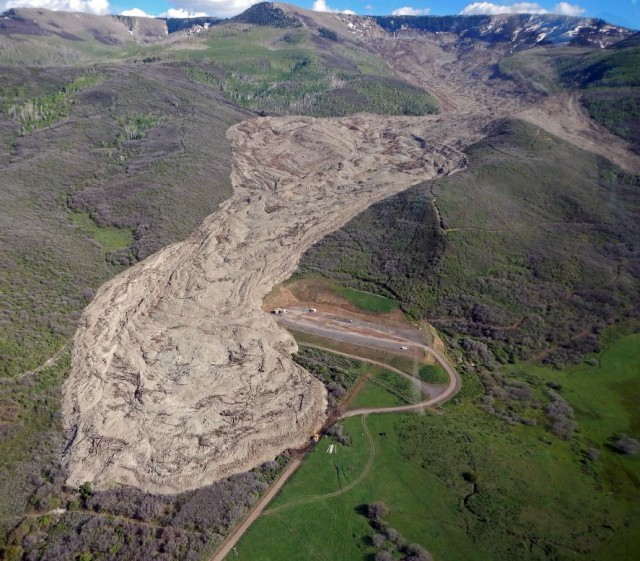
West Salt Creek landslide from White et al. (2015)
.
There is so much in this report that I cannot do it justice here. I particularly like the forensic approach that has been taken to understanding the morphology and to draw inferences into the mechanisms of motion.
The landslide was initiated by a rotational failure in a large block, as seen in this image from the report:
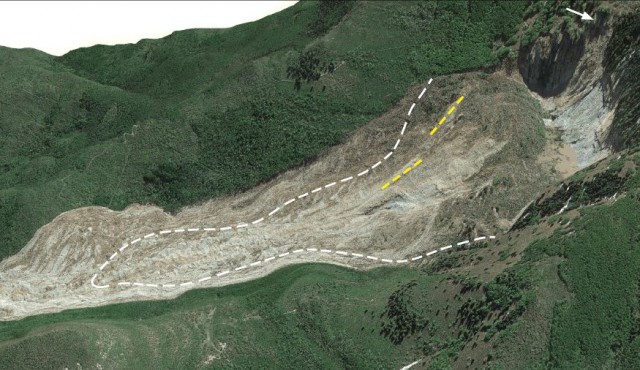
West Salt Creek landslide from White et al. (2015)
.
The white dashed line in the image above shows the location of a prehistoric landslide identified in the imagery. A small part of the rotational block detached and fragmented, turning into a high energy debris/rock avalanche event. The yellow dashed lines show the points of detachment. This high energy flow is interesting and intriguing, extending the landslide to a total crown to toe distance of about 4.5 km. The maximum velocity of this component of the landslide is estimated to have been between 18 m/sec and a peak at about 40 m/sec. This is perhaps surprisingly high, but the methods used are credible. The outcome is that the landslide showed a high level of mobility in terms of runout distance given its volume and elevation change, as shown in this plot:-
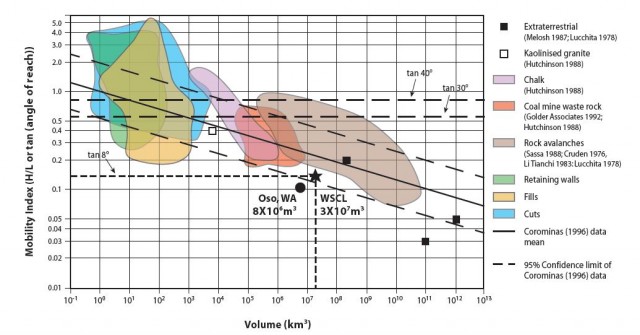
West Salt Creek landslide mobility from White et al. (2015)
.
But perhaps the most surprising aspect of this behaviour is that the landslide appears to have been a comparatively dry flow event. White et al. (2015) note that:
Overall the rock avalanche was a markedly dry deposit; during the field investigation, no water or mud was seen seeping or fanning out from the steeply sided edge of the avalanche toe.
White et al. (2015) identify three phases of movement of the West Salt Creek landslide, creating a very complex and in some ways very beautiful deposit, as this image shows:
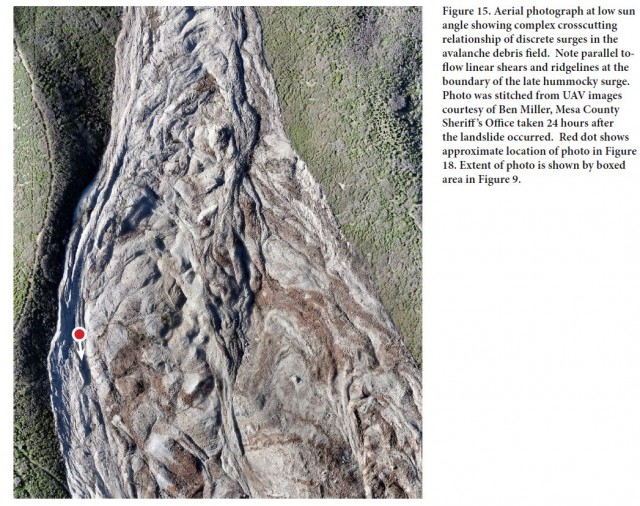
West Salt Creek landslide deposit, from White et al. (2015)
.
Note the evidence for the late stage surge movement of the landslide on the left (as shown above) side of the deposit. The red dot is on the margin of this flow. So, White et al. (2015)) conclude that after the initial rotational failure, the West Salt Creek consisted of a series of dry rock avalanche surges that achieved high velocity and a long runout. This will have implications for landslide hazard management in this landscape.
Reference
White, J.L., Morgan, M.L. and Berry, K.A. 2015. The West Salt Creek Landslide: A Catastrophic Rockslide and Rock/Debris Avalanche in Mesa County. Colorado Colorado Geological Survey, 45 pp.
8 September 2015
Portland: progressive failure at Weare Cliffs
Portland
One of the most landslide prone areas of the UK is Dorset (which incidentally is also one of my favourite parts of the world). It has a series of very large, very well developed landslides, as well as numerous rockfall sites on steep cliffs. Most landslide fatalities in the UK in recent years have occurred in Dorset (for example this one and this one). The Isle of Portland is a geologically fascinating area of Dorset. The extensive coastline of Portland is prone to a range of complex landslide mechanisms. At present there is an interesting progressive failure developing on the Weare Cliffs section of the coastline. The Daily Echo has a nice article about it, including these two images by Mark Godden:
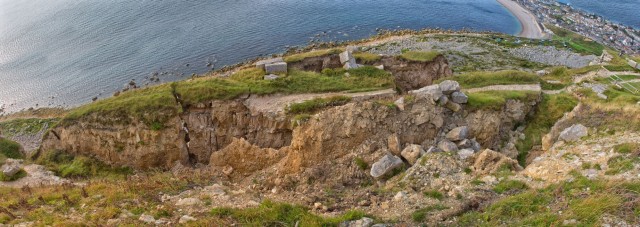
Mark Godden via The Daily Echo
.
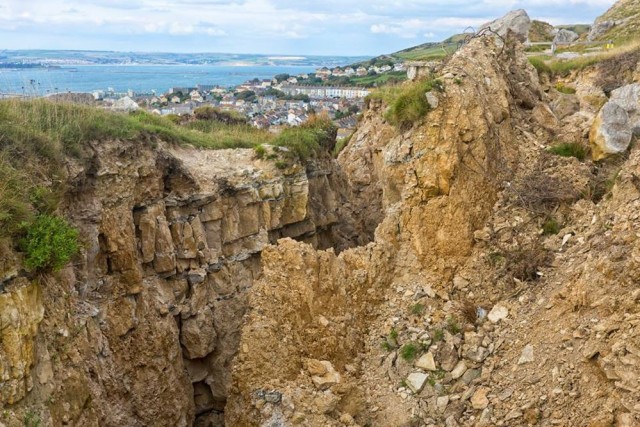
Mark Godden via The Daily Echo
.
.
Geoff Kirby has a really nice webpage describing this area of Portland, including details of the extensive quarrying that has occurred in this area. Many of the historic buildings in London (including Buckingham Place for example) are built from Portland limestone, and of course this is also the area after which Portland cement is named. The key to these landslides though is that the hard, strong Portland limestone overlies much weaker marls, clays and shales. It is deformation in these weaker lower beds that permits the development of the failures.
Google Earth
.
The images above suggest that the landslide has extended back through the area of the coastal path, which has already been rerouted. This landslide is likely to become quite interesting in the months ahead as we move into the wetter winter period. I have seen no suggestion to date that any infrastructure is threatened by this landslide on Portland though, so in many ways it is of academic interest. It would be fascinating to see a new aerial view of the landslide.
7 September 2015
Glen Canyon Dam in Arizona – an interesting rockfall problem
Glen Canyon Dam
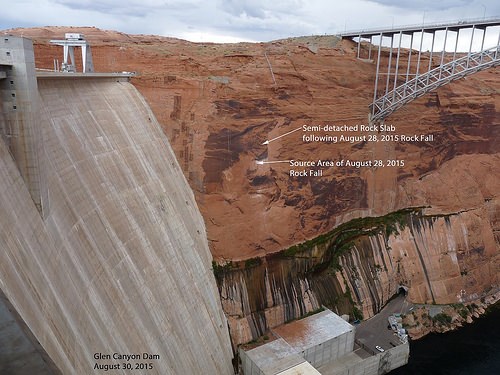
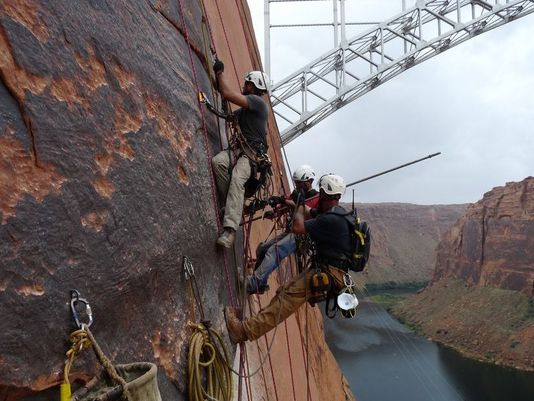
The Glen Canyon Dam in Arizona is a concrete arch dam on the Colorado River in Arizona, USA. Construction was completed in 1966. The dam provides both hydroelectric power and flow regulation. The US Bureau of Reclamation, who are responsible for the dam, are involved in a project to try to secure a large slab of rock on a near vertical face close to the dam that is threatening to collapse. This is quite a remarkable project. They describe it thus:
Glen Canyon Dam professionals are in the process of securing the 50-feet high, 30-feet wide and up to 4-feet thick slab of Navajo Sandstone to the canyon wall by installing 6- to 8-foot, 1-inch diameter bolts through the slab and into the wall by specialized Reclamation workers called scalers who drill into the rock and install the bolts while hanging from rappelling lines on the canyon wall.
This particular section is just downstream from Glen Canyon Dam and above a machine shop adjacent to the Glen Canyon Dam Powerplant. This area had previously been identified as a risk and six rock bolts were recently installed to temporarily stabilize the area so additional work could be performed at a later date.
Soon after the bolts were installed, Glen Canyon Dam operations staff reported several small rock falls and a notable crack opening around a large slab Friday, August 28. No one was injured from the rock falls.
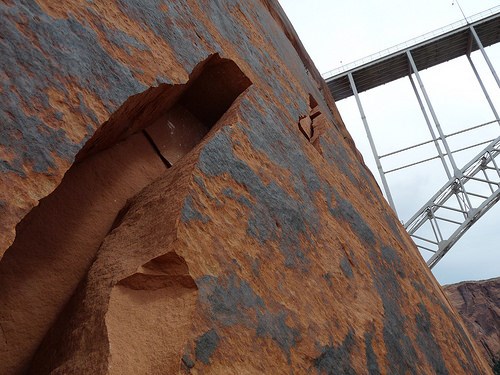
There are some excellent images of this block in the various news stories that have been written over the weekend, all of which seem to have been taken by Mark Neeley from the Bureau:
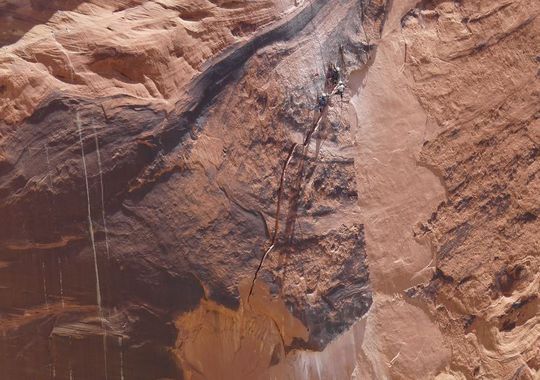
Mark Neeley, US Bureau of Reclamation
.
Mark Neeley, US Bureau of Reclamation
.
Mark Neeley, US Bureau of Reclamation
.
Mark Neeley, US Bureau of Reclamation
.
This is clearly an extraordinarily difficult task. During the development of a canyon sheet joints often form as a result of stress release. These joints often run parallel or subparallel to the face, allowing detachment of blocks to form rockfalls. What is unusual here is that there are few other joints, meaning that the slab that has started to detach is unusually large.
1 September 2015
NASA landslide video visualizing rainfall-induced mass movements between 2007 and 2015
NASA landslide video
The Weather Network has a report a new NASA landslide video. This is a visualization of recorded rainfall-induced landslides since 2007. The NASA Visualization team has provided the following text to explain the animation:
In 2010, NASA scientists released the first publicly available catalog of rainfall-triggered landslides using information collected from online databases and media reports that date back to 2007. Recently, the catalog has been updated to include landslide events from the last five years. Scientists have begun to compare events with satellite rainfall measurements to determine where and when landslides are likely to occur. Watch the video to see the distribution of rainfall-triggered landslides that took place from 2007 to 2015.
Unfortunately I below is the best embed of the NASA landslide video that I can manage at present, but the NASA Visualization Lab has a better version.
But you can access it via the NASA Visualization Explorer. This is a map of all 6500 landslides in the dataset that drives the visualization. Unfortunately no explanation is given for the different size and colour of the symbols, but in the video the size of the circle represents the number of fatalities and the pink color represents the number of days since the landslide occurred.:
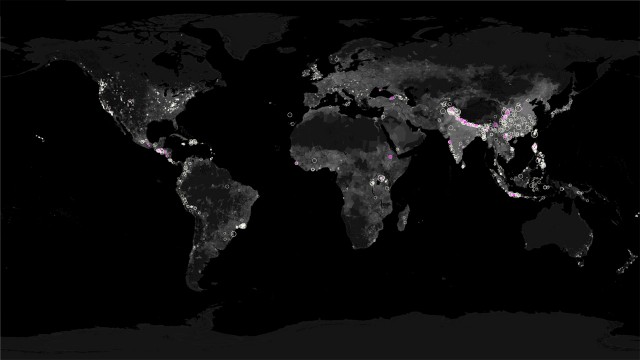
NASA
.
Note the focus of landslides along the Himalayan Arc and in China, as well as in the Philippines and Indonesia. This data records more landslides in more developed countries, such as those in Europe and North America. I find the apparently low incidence of landslides in Japan in the NASA landslide video surprising.
The results are pleasingly similar to my own dataset on global landslide fatalities. The major difference is that the NASA dataset records all rainfall induced landslides, and as such is more comprehensive, which is useful. The downside is that it might be less consistent perhaps, with a strong bias towards countries with more people and a a strong media presence.
30 August 2015
Sitka landslide in Alaska – the potential power of simple geomorphic mapping
Sitka landslide in Alaska
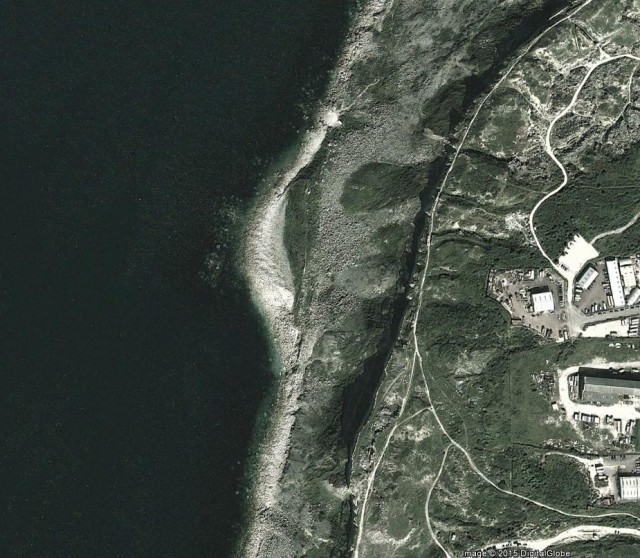
Heavy rainfall in Alaska on Tuesday 18th August triggered landslides in the town of Sitka in Alaska, the worst of which killed three men. The Alaska Dispatch News has the best image of the landslide that I’ve seen to date:
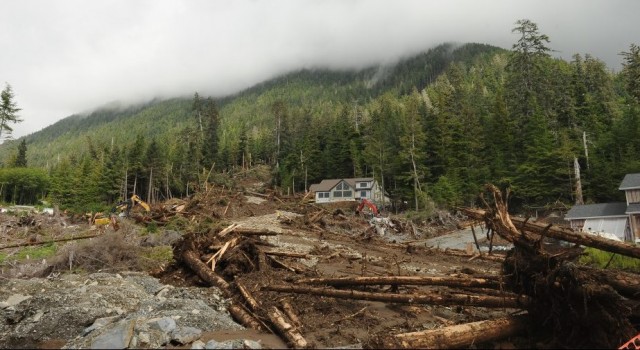
.
It is clear that this is a flow type slide that has originated on the steep forested flanks of Harbor Mountain. The landslide tore through a new housing development on the so-called benchland area of Sitka, which it had been hoped would provide a solution to the housing problems faced by the town. There is a good account of the disaster declaration for the landslides in Sitka on KTVA Alaska, and of the likely implications of the landslides in an article on the Alaska Dispatch News website. Part of the development of the housing project included the construction of a water tower. The geotechnical report for this project is also available online and makes interesting reading. This is a part of the documentation that was provided for the auction of lots in the housing subdivision.
The aftermath of the landslide itself has captured in a high resolution SPOT7 satellite image, and is available in annotated form on the GeoNorth website:
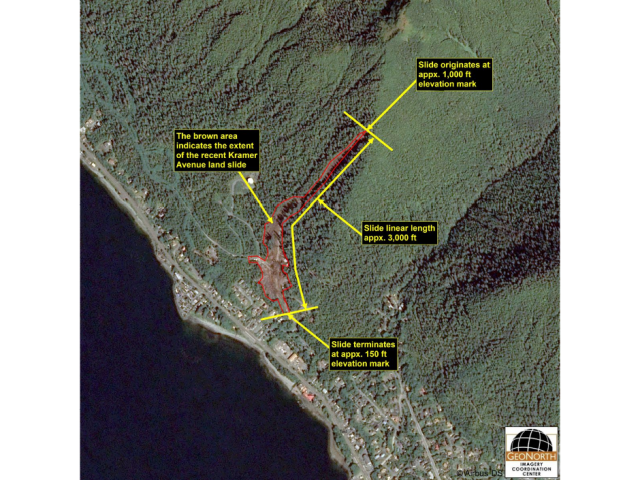
SPOT 7 via Geonorth
.
A few things to note here. First, it was lucky that the landslide didn’t travel a little further. Second, and more importantly, the landslide started very close to a ridge in a forested section of the slope, possibly as a reasonably small landslide that appears to have entrained debris to become a high energy flow. Thirdly, the water tank is clearly visible on the image. And fourthly, the slope appears to have very interesting geomorphology, with multiple gullies. So let’s take a look at the Google Earth image, which is of a high quality for this site:
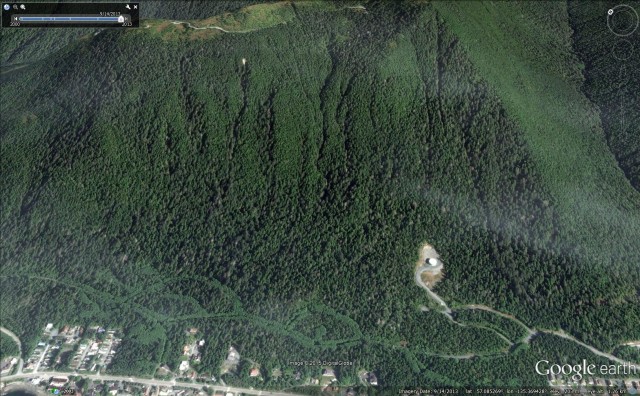
Google Earth
. .
It is clear that the slope is characterised by multiple incised channels, many of which extend from the ridgeline. Note that at least some have a broader crown area and then a narrow track. These look to me to be classic debris flow channels, at least some of which come extend down to the roads associated with potential housing developments. The Sitka landslide itself is very close to one of these channels, and may even have occupied one. And interestingly, the geotechnical report identifies “ancient landslide” deposits:
Ancient Landslide
This unit is composed of varying mixtures of volcanic ash, glacial drift, and organic materials. These deposits are typically reddish brown, moist to wet, compact to dense, and vary in thickness from 1.5 ft to 18.5 ft. The average moisture content was 27%. Landslide deposits commonly exhibit characteristics of disturbed volcanic ash and are generally unsuitable as a bearing surface or as fill material.
To me as a geomorphologist, the presence of those gullies on the slope, and their shape, is enough to ask serious questions about the site. Combined with ancient landslide deposits in the vicinity of the houses themselves, my concern would increase. And note that the ancient landslide deposits lie above glacial drift (i.e. the remains from a recent ice age), and ash from one or more volcanic eruptions. This suggests to me that these landslide deposits might not be very ancient in geological terms.
I have no idea whether a simple geomorphic analysis was undertaken of the slope but I would be interested to find out. Not unusually perhaps, it seems it wasn’t part of the brief for the geotechnical report, which seems to me to be a perfectly competent document within the scope of such a study. O
I would also add that , of course, knowing that this is a slope that is prone to landslides does not necessarily preclude development of the benchland area of Sitka, but appropriate mitigation would be essential.
Simple engineering geomorphic mapping is a very powerful tool. It is used far too infrequently in my view. I have no idea how this slope was assessed. Was geomorphic mapping used here, and if so what did it show? If not, how have the hazards associated with this slope been assessed?
29 August 2015
A large rockfall on the Tour Ronde, Mont Blanc
Tour Ronde, Mont Blanc
The Tour Ronde is a massif the Mont Blanc region of the Alps, on the border between France and Italy. On Thursday the southeast face of this mountain suffered a significant landslide. Planet Mountain has a nice piece providing an account of the landslide:
Gianluca Marra, a Mountain Guide from Courmayeur … told planetmountain.com that “a first rockfall took place at around 8:30, a second one just over an hour later” adding that “the rockfall occurred on a section of the SE Face, on the spur a bit to the right of the Normal Route up Tour Ronde.”
Luckily, no-one was killed or injured in the Tour Ronde rockfall, but it was captured on video by Gianluca Marra, and it is now on Youtube. Two rockfalls occurred, about an hour apart. This is the second event:
.
The capture of both the rockfall component of this landslide (including the detachment of a series of large boulders) and the runout component (and in particular the slow bulldozing effect at the end of the movement phase, as was also observed in the Mount Dixon landslide in New Zealand) is particularly helpful. Once again the way in which the rockfall component resembles a fluid flow is notable. This is particularly evident in this remarkable photograph of the first collapse, also from Planet Mountain:
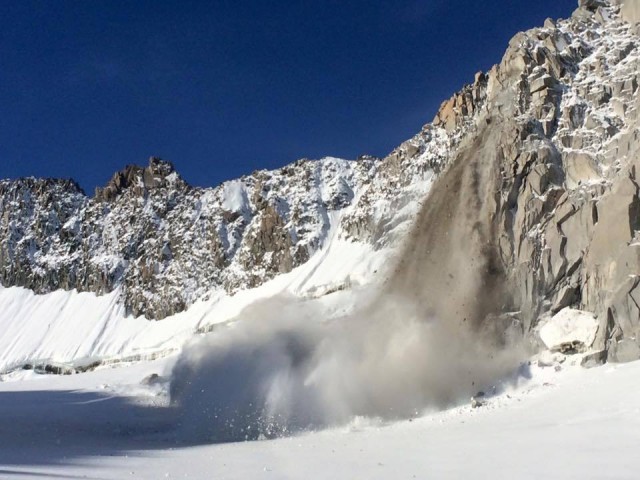
Gianluca Marra via Planet Mountain
.
Finally, Planet Mountain also has a high resolution photograph of the aftermath of the Tour Ronde rockfalls after the second collapse, also taken by Gianluca Marra:
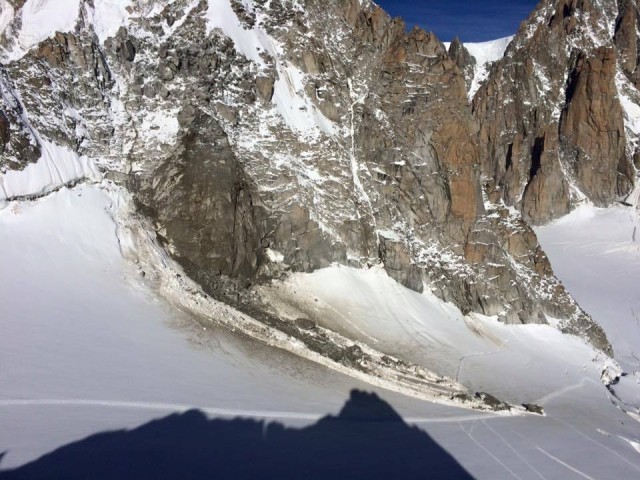
Gianluca Marra via Planet Mountain
.
 Dave Petley is the Vice-Chancellor of the University of Hull in the United Kingdom. His blog provides commentary and analysis of landslide events occurring worldwide, including the landslides themselves, latest research, and conferences and meetings.
Recent Comments