
19 February 2021
Trends in landslides and landslide losses in Nepal over three decades
Posted by Dave Petley
Trends in landslides and landslide losses in Nepal over three decades
I have written frequently about landslide losses in Nepal, both on this blog and in papers. I started to work on landslide problems there 20 years ago. Subsequently, many others have picked up the baton, such that there is a host of good work being undertaken there at present. A really interesting paper has just been published in the journal Landslides, Muñoz-Torrero Manchado et al. (2021), which is open access, which looks at landslide losses there over three decades. Based on an area in western Nepal, this is significant for two reasons. First, it uses the rapid development in our ability to use time series imagery to extract landslide scars from the landscape, which provides new opportunities to understand temporal and spatial patterns of landslide occurrence. Second, it casts light in an unprecedented manner on landslide patterns themselves with time and in space.
Muñoz-Torrero Manchado et al. (2021) have extracted annual landslide maps for their study area between 1992 and 2018, mapping 8,778 landslide events during the study period (and many more that preceded the start of the study). They have then been able to link these annual events to the weather and other conditions in the study area.
Not surprisingly, the strongest correlation that they found was between total monsoon precipitation and the number of landslides – in wet years there were more slides. Interestingly, this effect was amplified when a year with high rainfall monsoon came after a year in which the monsoon that was warm and dry.
In many ways the most interesting aspect of this study is explained in this diagram from the paper:-
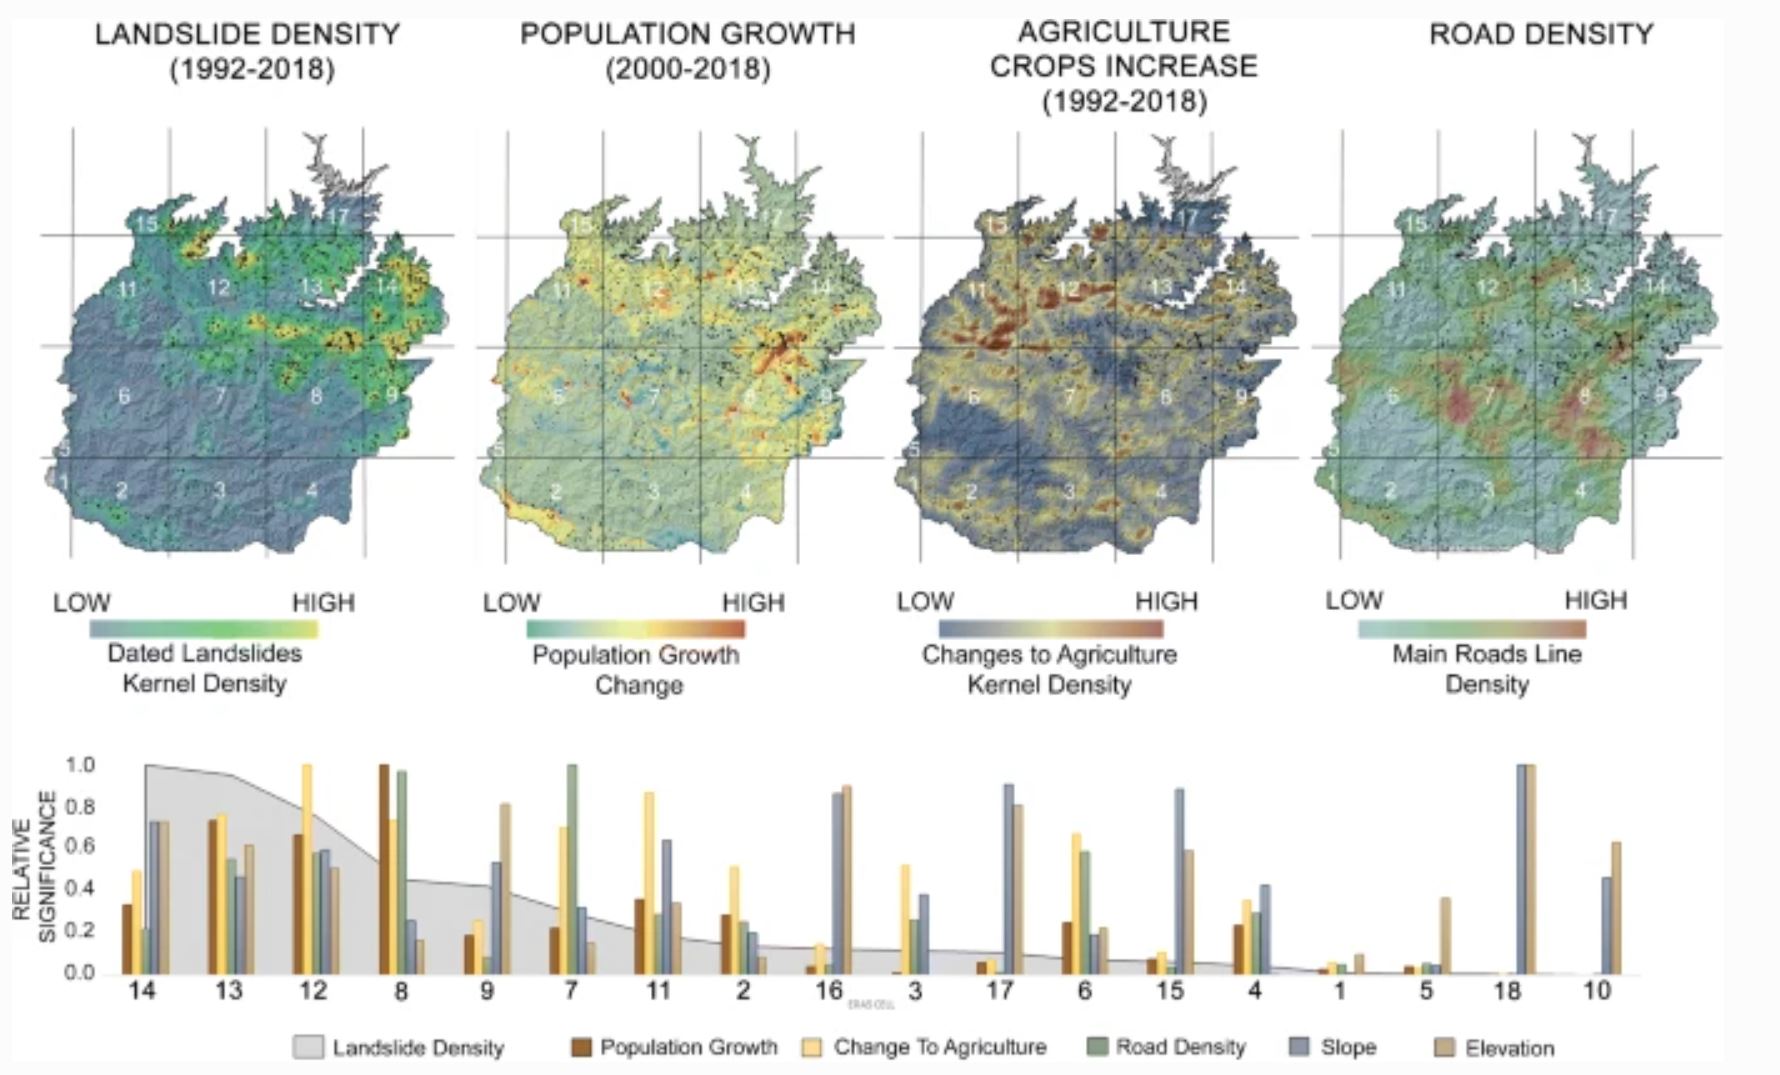
Patterns of landslides over three decades in western Nepal. Figure from Muñoz-Torrero Manchado et al. (2021).
.
The four panels at the top show maps of the study area. The black dots are the landslides. The heat maps show variability in key parameters as per the labels. The graph below divides the study area in a set of smaller zones. The grey shading shows the landslide density, and the bars show the influence of various factors. In those areas with the highest landslide density there has been population growth, and associated changes to agriculture, and increases in the road density.
Thus, Muñoz-Torrero Manchado et al. (2021) conclude that the annual pattern of landslides is being heavily driven by the patterns of the monsoon in this area, but it is also strongly affected by human factors such as poor slope management and road construction.
The paper ends with a very clear message about the need for community-led landslide management:
[T]he increase in reported landslide fatalities in western Nepal relates primarily to the notable demographic expansion in this area, placing more people and assets in harm’s way. Hence, there would appear to be significant potential and need for community-focused disaster risk management strategies to reduce local exposure levels and minimize landslide losses.
I agree completely.
Reference
Muñoz-Torrero Manchado, A., Allen, S., Ballesteros-Cánovas, J.A. et al. 2021. Three decades of landslide activity in western Nepal: new insights into trends and climate drivers. Landslides (2021). https://doi.org/10.1007/s10346-021-01632-6
 Dave Petley is the Vice-Chancellor of the University of Hull in the United Kingdom. His blog provides commentary and analysis of landslide events occurring worldwide, including the landslides themselves, latest research, and conferences and meetings.
Dear Dr. Petley. A similar work has been published in landslides almost concurrently regarding Indian Landslide scenario by a team in ISRO. Here is link. https://link.springer.com/article/10.1007%2Fs10346-021-01645-1
Will be glad if we receive your comments on yor blog.
A similar work had been concurrently published regarding India.
https://link.springer.com/article/10.1007%2Fs10346-021-01645-1