
16 September 2019
An update on landslides from the 2019 Northern Hemisphere monsoon season
Posted by Dave Petley
An update on landslides from the 2019 Northern Hemisphere monsoon season
At the 2019 Northern Hemisphere summer monsoon season starts to decline, I have run a quick analysis of the landslides that I have recorded to date (following up on my post of a month or so ago looking at the number of landslides in July). Whilst the 2019 total will increase slightly as I work back through the dataset to validate it (a process that usually uncovers some unrecorded events), the graph below is the dataset up to 11th September. The plotted data shows the cumulative number of landslides and the cumulative total number of fatalities worldwide up to that date:-
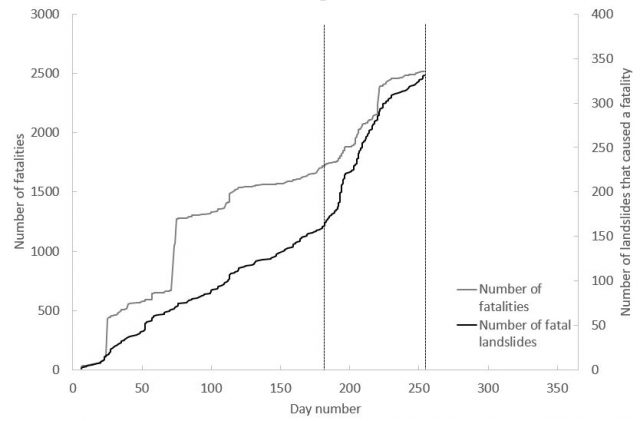
The cumulative total number of fatal landslides, and the cumlative total of the resulting fatalities, for 2019 up to 11th September 2019. Note the effects of the 2019 Northern Hemisphere summer monsoon.
.
The effects of the 2019 Northern Hemisphere summer monsoon season are clear, showing a distinctive increase in the rate of fatal landslides from about day 180 (29th June, marked with the first vertical dashed line). This dramatically increased rate persists until about day 230 (18th August), when the number of recorded events reduces back to close to the normal (background) rate. Some of these landslides after this event are of course in the monsoon affected areas – for example, although they are not in the database as yet, Nepal suffered some fatal landslides at the end of last week, with one event killing six people.
Overall, the 2019 landslide year looks to be very similar to 2018. As of the end of August I had recorded 315 fatal landslides in 2019 (this number will rise as noted above), against 319 at the same point in 2018. The average for the period 2003 to 2018 (i.e. the entire range of the dataset) is 266 landslides, so the last couple of years have been notably worse than the long term average.
I would also like to highlight an interesting aspect that I cannot really explain at the moment. This graph shows the number of fatal landslides recorded worldwide in August over the period 2003-2019:-
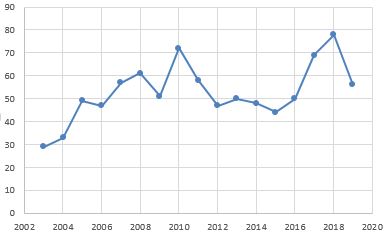
The total number of fatal landslides recorded in August worldwide for 2003-2019
.
It shows a generally increasing trend; August 2019 does not look exceptional (but will increase when I improve the data). By comparison, July shows quite a different pattern:-
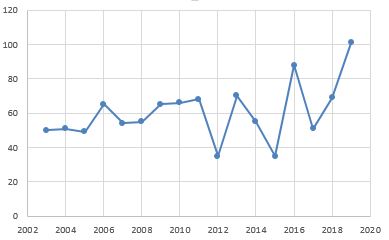
The total number of fatal landslides recorded in July worldwide for 2003-2019.
.
Again, there is a clear rising trend. But from 2011 onwards the pattern seems to have changed, with the number of recorded landslides become highly variable from year to year. 2019 is clearly the worst year on record.
This apparent change in pattern may or may not be significant, but requires further investigation.
 Dave Petley is the Vice-Chancellor of the University of Hull in the United Kingdom. His blog provides commentary and analysis of landslide events occurring worldwide, including the landslides themselves, latest research, and conferences and meetings.
It must be noted that a large part of the 2019 monsoon concentrated in the central and southern parts of India with sporadic high rainfall events in the Himalayas. The Met Department in Nepal recently published a report saying that there was a rain deficit fo 70% this monsoon in the western part of the country. The Indian agencies also say that the overall north Indian area also had a deficit of 20% of rain. The point is that had the rain been normal in the Himalayas, we would probably have seen a much higher number of fatal landslides.