
18 December 2018
New satellite tech offers a more detailed map of moving Antarctic glaciers
Posted by Lauren Lipuma
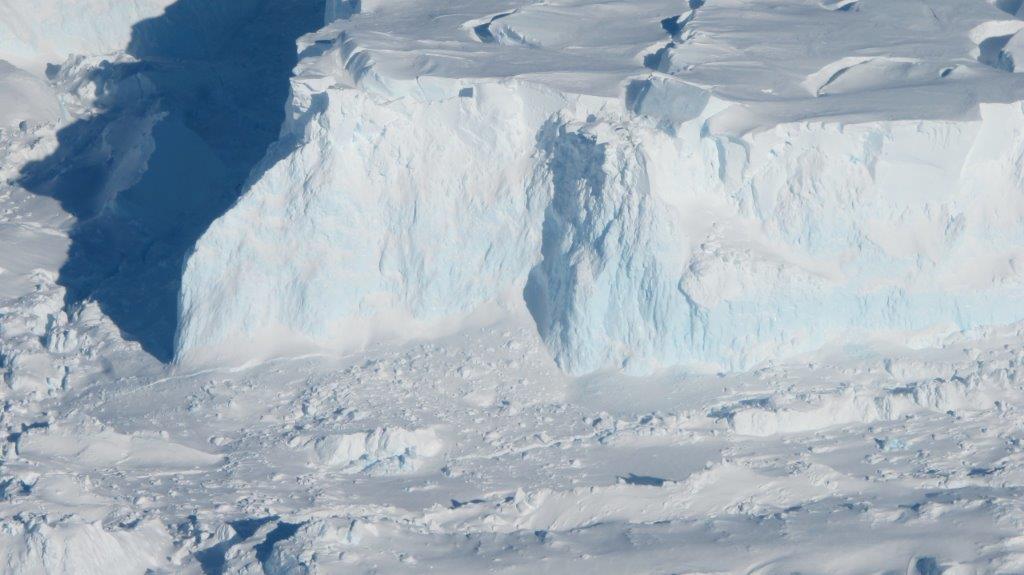
West Antarctica’s Thwaites Glacier. Scientists can now measure ice flow in Antarctica in far more detail, thanks to the help of a new satellite technology.
Credit: NASA/James Yungel.
By Helen Santoro
Scientists can now measure ice flow in Antarctica in far more detail, thanks to the help of a new satellite technology.
Using a novel satellite technique called interferometric synthetic aperture radar, or InSAR, scientists can measure the direction of slow ice movement with extreme levels of precision. Slow ice movement is defined as a shift of 1 to 30 meters (3 to 98 feet) per year.
InSAR also allows scientists to map Antarctica far deeper inland, providing them with a better understanding of the continent’s topography, according to researchers. Glaciologists want to use this new tool to track changes in ice as often as weekly or monthly. This could help them better understand how the glaciers are responding to climate change, according to Bernd Scheuchl, an associate project scientist at University of California, Irvine who presented new maps of Antarctica made with InSAR at the 2018 American Geophysical Union Fall Meeting last week in Washington, D.C.
“We want to better represent the evolution of Antarctica in a rapidly warming world,” said Eric Rignot, a professor of Earth system science at UC Irvine and co-author of a new study of the new images. “Accurate [ice] velocity is at the cornerstone of these predictions because it is the dominant way by which Antarctica contributes to sea level rise.”
The lowest segments of glaciers that are exposed to warming sea water are slowly melting away, causing shifts across the ice and a rise in sea levels. By tracking the velocity of these ice movements at a more frequent rate, scientists may be able to anticipate when and where sea levels will change.
The new maps are a big improvement from previous maps made in 2011 by scientists from the University of California, Irvine, who used billions of data points captured by European, Japanese and Canadian satellites and meticulously pieced together a map of Antarctica’s glacial shapes and movements. This included a bulk of previously uncharted East Antarctica that makes up 77 percent of the continent.

By tracking the velocity of ice movements in Antarctica at a more frequent rate, scientists may be able to anticipate when and where sea levels will change.
Credit: NASA.
“Our first goal was achieved in 2011,” Scheuchl said. “But in areas of slow movement, this was not really good enough for creating accurate models. We didn’t have a good sense of the direction of where the ice was moving.”
By using multiple radar images, InSAR can measure the difference between the satellite and its target on a glacier. The goal is to generate detailed maps that measure small-scale changes in glacial structure and ice flow over time. Better yet, this technique can help uncover which direction the ice is moving.
The new maps have colors that represent different ice velocities in meters per year, with brown being the slowest (less than 10 meters or 33 feet per year) and red being the fastest (more than 3,000 meters or 10,000 feet per year).
Antarctic glacial mapping will even get better in 2021, when NASA and the Indian Space Research Organization will be launching a new InSAR mission called NISAR.
Satellites normally leave gaps in their mapping, but with NISAR, scientists will now be able to map almost all of Antarctica every 12 days, Scheuchl said. With more extensive data, scientists’ models of Antarctica could become far more accurate – a true replica of the natural world.
“For modeling and understanding, it is important to characterize the whole system,” Rignot said.
Helen Santoro is a graduate student at the UC Santa Cruz Science Communication Program.


