
1 June 2018
Reconstructing America’s longest water level and instrumented flood record in Boston
Posted by Nanci Bompey
By Jan Lathrop
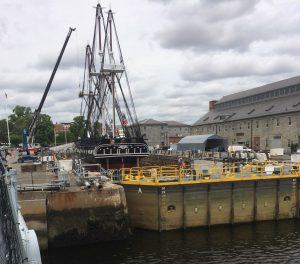
Boston dry dock with the U.S.S. Constitution. This photo shows the inlaid “tide staff”, the oldest tide gauge in the US, which has been there since about 1830. The top of the sea-wall, known as the coping, was built to withstand the highest floods known up to that time.
Credit: Stefan Talke
Using newly-discovered archival measurements to construct an instrumental record of water levels and storm tides in Boston since 1825, researchers report that local averaged relative sea level rose by nearly a foot (0.28 meters) over the past 200 years, with the greatest increase occurring since 1920. The work also highlights tides and their significant effect on flooding in the city.
The evaluation of storm events since 1825 suggests that changes in flood risk are driven by relative sea-level rise and tidal trends, according to the new study in Journal of Geophysical Research – Oceans, a journal of the American Geophysical Union.
The new study reports on the recovery, data reconstruction, digitization, quality assurance and analysis of 50 years of pre-1920 tide records from Boston Harbor found in documentary archives at Harvard University and MIT, among other sources.
“It’s a great value for any major city to extend the historical record back like this because it’s really hard to come up with an accurate estimate of a 100-year storm based on only a few decades of data,” said Jon Woodruff, a geoscientist at the University of Massachusetts-Amherst, a co-author of the new paper.
A 100-year storm refers to an event that statistically has a one percent chance of occurring every year. “Our work also helps to show the importance of not only sea-level rise, but changes in extreme tides in driving changes in flooding frequency for a city like Boston,” Woodruff said.
The authors used daily water-level data mostly from the inner part of Boston Harbor at gauges within about 2 miles (3 km) of one another, plus archival notes, correspondence and other reports.
“When combined with available NOAA measurements since 1921, these records span the period of 1825-2018 to form the longest known water-level record outside of northwest Europe,” said Stefan Talke, an assistant professor of civil and environmental engineering at Portland State University, and lead author of the new paper.
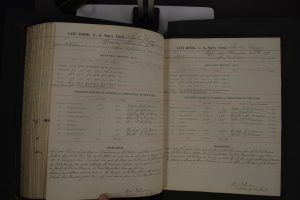
Logbook from November 27 and 28, 1898.
Credit: Stefan Talke
The findings also note that in Boston, sea level rise is a combination of climate change and land still sinking via processes linked to the last glaciation.
“People have known that tides are important in Boston, but our research really stresses that,” said Woodruff. “It’s not the storms alone that cause flooding. It’s the storm that hits during an extreme high tide that does it. You can’t have record flooding in Boston without it, which makes the times when Boston is susceptible to flooding a bit more predictable. This is true not only on monthly and annual time-scales but also on the decadal-scale.”
Woodruff goes on to explain, “The astronomical influences on tides can be a bit confusing, but our research shows that slow changes in the moon’s orbit around the earth relative to the earth’s orbit around the sun results in high tides increasing and decreasing over an 18.6-year cycle. This means extreme high tides being as much as one-third of a foot greater at the high point in this cycle relative its low point. Right now, we have just passed the peak, so the odds are greater of having a record high tide. In the 2020s they’ll swing back to be slightly lower, then back higher in 2030s.”
“So in the 2020s, nature is working with us,” Woodruff said “But in the 2030s it will be working against us. We are coming up to a decade where flooding is slightly less likely. That means we have a window of opportunity to be prepared for the 2030s when flooding associated with tides becomes more likely.”
“Determining long term trends in sea-level, tides and high water marks gives us the potential to make better decisions about infrastructure investment,” added Talke. “Understanding the past helps us prepare much better for the future.”
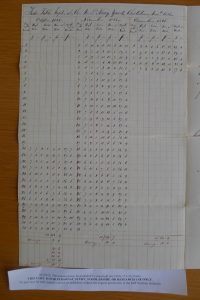
Daily tide record, October – December 1826
Credit: Stefan Talke
Woodruff and colleagues also point to sea level rise as an important driver of increased flood frequency. They recall that in January and March of 2018, two extra-tropical cyclones caused flooding in the Boston area, which were respectively the first and third highest measured water levels since at least 1800, and probably back to 1700.
“There have been higher storm surges and storm tides prior to the winter 2018 events,” said Woodruff, “but sea level rise resulted in the winter 2018 events likely having the highest documented water levels going all the way back to the onset of European colonization.”
The Jan. 4 and March 2, 2018 events were the fourth and eighth largest “storm tides” on record since 1825, where a storm tide is defined as the sum total of the predicted astronomical tide and storm-induced surge, Woodruff and his colleagues note. Historical storm tide events greater than Jan. 4, 2018 event include the Blizzard of 1978, the famous Minot’s Ledge Storm in April 1851 and the Christmas Storm of December 1909.
“Interestingly, all the top storms have virtually the same typology – large spring tides close to two meters and a storm surge of around one meter,” Talke added.
The study’s authors point out that archives of tides offer one of the best ways of identifying past changes to the three most important components driving changes in extreme water levels to places like Boston: long-term sea level rise, tidal trends and storm activity.
“A lot of concern is sometimes placed on changes in storm activity but for Boston, changes in sea level and tidal trends seem to be the most important factors that drive changes in flood frequency to the city,” Woodruff said.
This work was supported by U.S. Army Corps of Engineers, the National Science Foundation, Massachusetts Sea Grant and the National Archives.
Listen to Stefan Talke talk about using archival data in his research on AGU’s podcast, Third Pod from the Sun.
— Jan Lathrop is a science writer at UMass Amherst.

It is good to know that currently that Boston is at the point of experiencing the tidal lows in the 2020’s. However, will they become complacent when the 2030’s come around? Will they experience the same large spring tides and storm surges and have in place the required provisions for such events?