
27 October 2015
Reading revealing reversals (or charting magnetic patterns to map history)
Posted by lcooper
This is the latest in a series of dispatches from scientists and education officers aboard the Schmidt Ocean Institute’s R/V Falkor. The crew is on 36-day research trip to study Tamu Massif, a massive underwater volcano, located 1,500 kilometers (930 miles) east of Japan in the Shatsky Rise. Read more posts here.
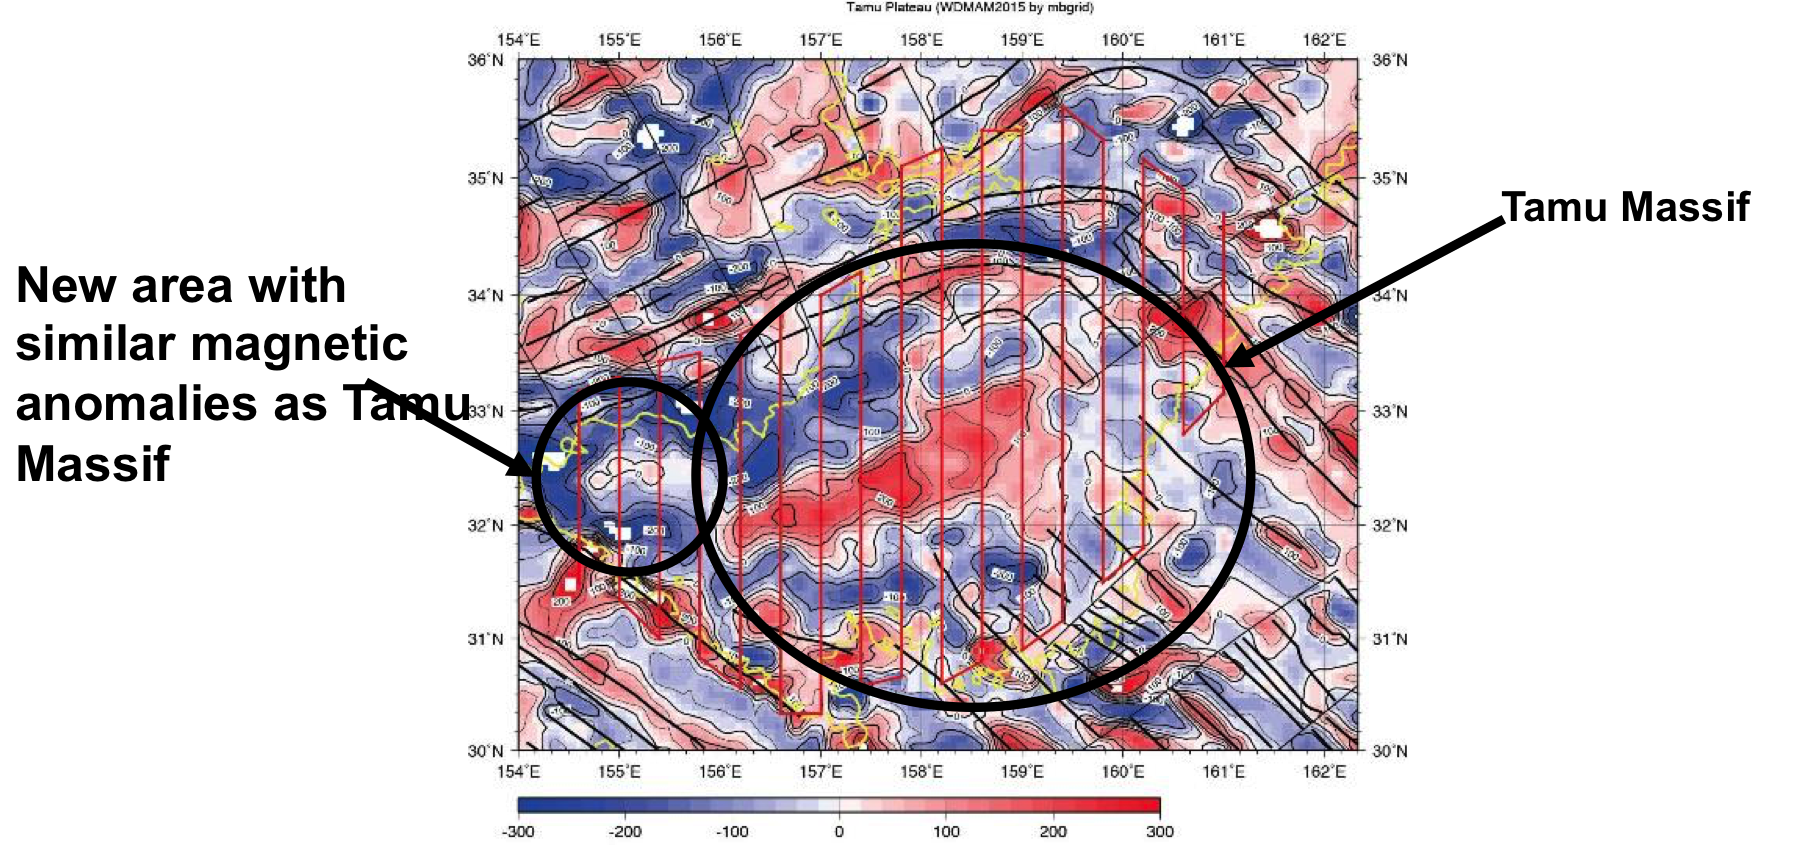
Wiggle map (as compared to the DMAM) showing positive and negative magnetic anomaly data along the survey transects. Right side of line is positive and left side of line is negative.
Credit: Yan Ming Huang/SOI
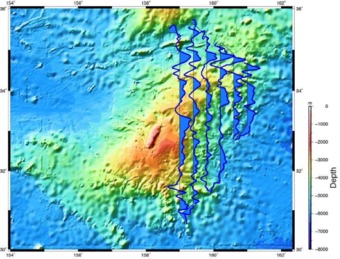
World Digital Magnetic Anomaly Map with an overlay of our cruise plan over Tamu Massif.
Credit: SOI/wdmam.org and William Sager
Observations of Maggie’s data
Our magnetometer has been playfully named “Maggie,” but what she accomplishes is pure work, not recreation. Maggie records how much the Earth’s magnetic field is perturbed by crustal magnetism. With these data sets, a pattern of geomagnetic reversals along the ocean bottom is shown. These reversal patterns can be used in assessing age distribution of the ocean floor. The data sets we have collected thus far are being compared with the DMAM – World Digital Magnetic Anomaly Map. The DMAM is an international scientific project that comprehensively compiles and makes available magnetic anomalies caused by the Earth’s lithosphere – on both continental and oceanic areas – all over the world. As chief scientist Dr. William Sager compares the preliminary wiggle data along our lines (see wiggle map) and overlays our cruise plan over the DMAM (see figure), his observations are currently what he expected, within the location of positive and negative areas on the DMAM map (where red is positive/normal polarity and blue is negative/reversed polarity). He has also noticed a small mass to the left of Tamu Massif showing a similar pattern of red (+) in the center with flanks of blue (-) surrounding it. But until we map more of the ocean floor in this area, we will not be able to say exactly what it is. Another question surrounds the stripes (black lines on DMAM) on or near the volcano: as stated in earlier blogs, Tamu Massif formed at spreading ridges, indicating it would have magnetic stripes going through both its north side and south side. However, the stripes are not present on the south side. What does this mean? How much more data is needed to explain what we are seeing? Does it just seem like there are no magnetic stripes or are we missing something? In science, it may take months or years to analyze what we have collected, but it is possible to start making some educated guesses soon. Then again, the data may reveal more questions than answers: Tamu Massif still has secrets to reveal.

Rough weather and Super Typhoon Champi have caused some modifications and detours to the planned routes.
Credit: SOI/Suraida Nanez James
WOW: Waiting on weather
We have had a phenomenal first half of the cruise, in which we were able to run survey Lines 1 through 8, getting ahead of schedule. The other night we took advantage of favorable conditions and ran Line 14 on the west end of Tamu Massif. When we finished the line, the weather forecast indicated conditions would not be good enough to survey for about two days, but now it seems there will be more than a few days of bad weather – which is common during this time of year. That said, we are weathering the seas and are currently mapping Line 17. We will continue to survey as many lines as we can, with a priority of mapping the west side of Tamu Massif, because this area has not been mapped in detail compared to the center area of Tamu Massif.

“Maggie” showing the damage caused by what are thought to be sharks biting the magnetometer.
Credit: SOI/William Sager
Uninvited guests: Sharks and magnetism
In my previous blog, I mentioned having to pull out Maggie (the magnetometer) for a short while to allow the captain flexibility as he maneuvered us away from rough seas. When the crew retrieved Maggie from the water, they observed some obvious wear and tear and what appeared to be teeth marks. Sharks are widely thought to use the earth’s magnetic field for navigation and can potentially sense the changes of the geomagnetic field on the ocean bottom. So Maggie is a perfect target for these apex predators. Since then, we have deployed Maggie back into the water and resumed data collection but have noticed unusual spikes in the data. We can only speculate as to what those spikes can be attributed to but the thought is that Maggie is being nipped at by sharks – just another reminder that we are the guests here.
– Suraida Nanez James is the Manager of Distance Learning and Outreach at the Texas State Aquarium


