
26 October 2015
Crossing and cleaning while tossing and turning
Posted by lcooper
This is the latest in a series of dispatches from scientists and education officers aboard the Schmidt Ocean Institute’s R/V Falkor. The crew is on 36-day research trip to study Tamu Massif, a massive underwater volcano, located 1,500 kilometers (930 miles) east of Japan in the Shatsky Rise. Read more posts here.
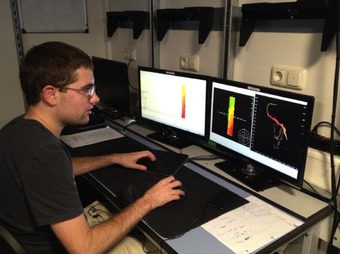
Ph.D. student John Greene processes bathymetric data recently collected over survey line 8.
Credit: SOI/Suraida Nanez-James
Toronto Ridge
Our eight survey lines were completed around midnight today, and now we are headed west to avoid the bad weather. This last survey line crossed over and mapped Toronto Ridge, the shallowest point on Tamu Massif, which is approximately 1900 meters (1.2 miles) below the ocean surface. According to chief scientist William Sager, this large and shallow ridge appearing on Tamu’s summit is even younger than the main shield volcano.
Radiometric dating is a technique used to date materials such as rocks or carbon by comparing the abundance of a naturally occurring radioactive isotope within the material and the abundance of its decay products. Using this technique, it was determined that the ridge formed approximately 15 million years ago by small volume eruptions occurring after the initial formation of Tamu Massif. These post eruptions are common on many large volcanos and therefore was not a surprise to scientists. It was thought that the ridge would have gone through subaerial erosion had it been atop the shield summit prior to subsidence. With seismic profiles (and now with bathymetry data) we can produce a more comprehensive visual of this ridge.
Bad Weather = Bad Data
As we detour away from the survey site, we will continue processing the bathymetric information collected over Tamu Massif, as well as continue to collect multi-beam data while doing our maneuvers. That said, the last day or two of data collection over the volcano will considerably take more effort to “clean” and process because as the seas have been progressively worsening, so did the anomalies and data gaps we saw on the monitors. John Greene, a PhD student in geophysics at Texas A&M University, is the lead student scientist processing the data using the computer program CARIS. He has been training others on the science team to use the software as well. CARIS enables users to process data in near real-time, saving valuable time and resources. He has started his processing and shared before-and-after photos of the images produced. As mentioned previously, our multi-beam is located under the ship near the bow. In a perfect situation, the multi-beam would be able to send soundings straight down to the ocean floor, but with waves and the ship pitching, this can be difficult to do. As Falkor pitches, it makes contact with the ocean surface, causing air to get trapped under the ship. This produces bubbles that can be interpreted as craters, blank areas, or appear on the monitor as other features that seem illogical. Now it will be up to the scientists to use their knowledge of geophysics to pick out the bad data collected, making the maps produced as accurate as possible.
As for Maggie the magnetometer, she was brought in shortly after survey line eight was completed. By bringing in the tethered instrument, it will give the captain more freedom to adjust speed. Maggie will be redeployed upon our return to Tamu Massif.
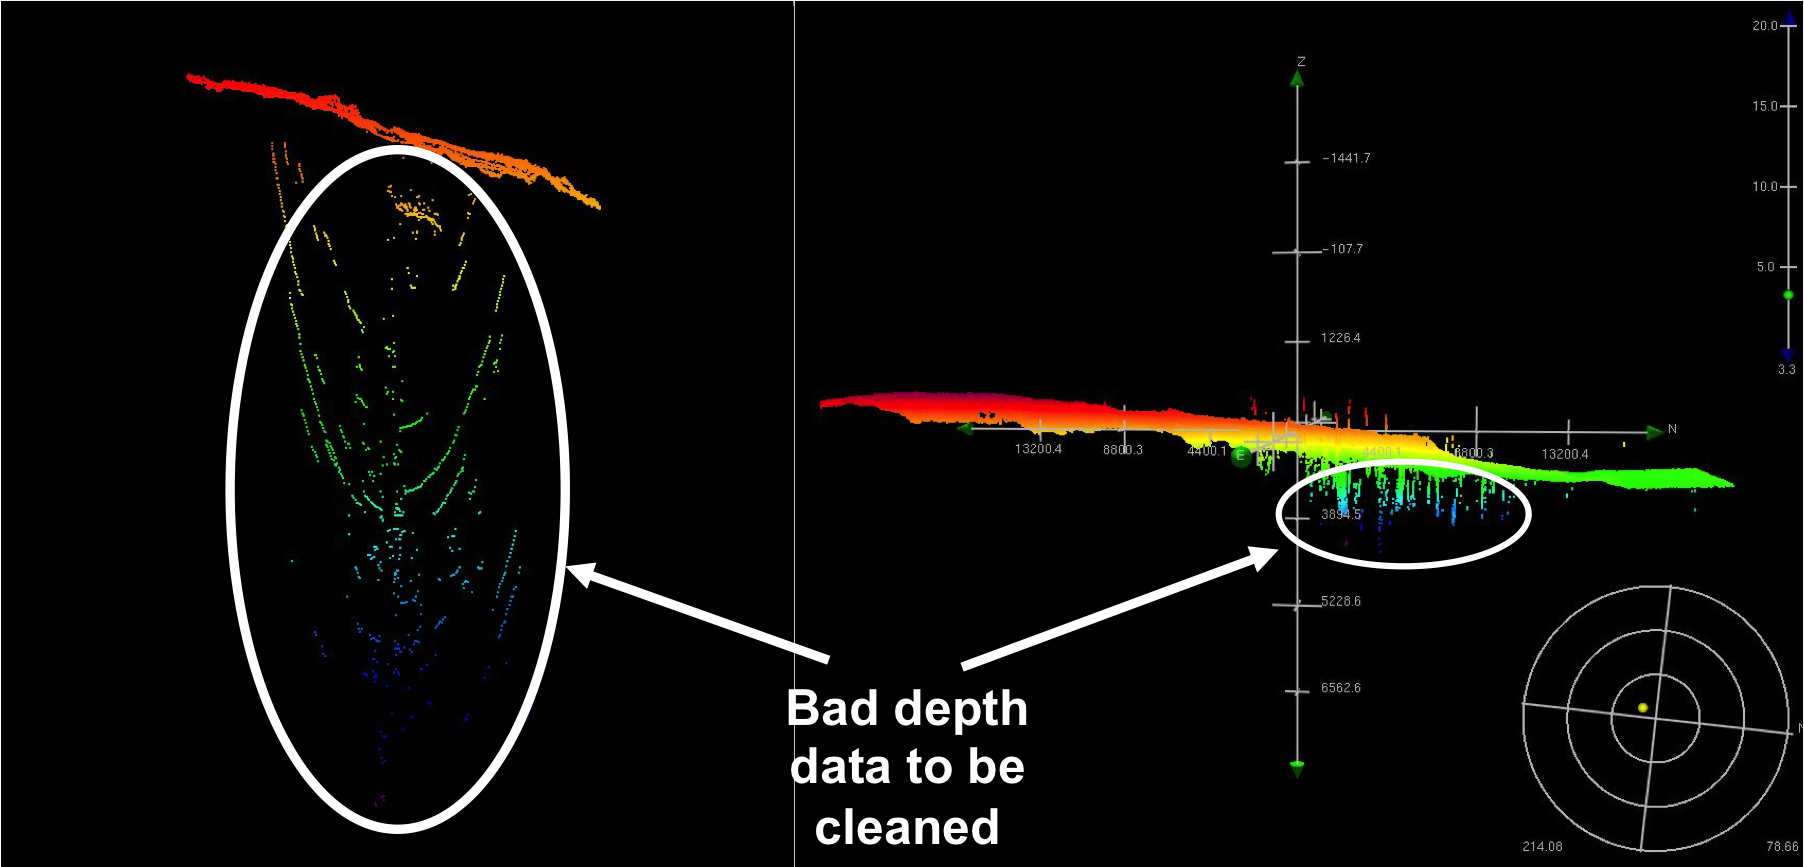
These are examples of bad data collected during rough seas. The parabolas and points shown in the white circles will be deleted/cleaned.
Credit: SOI/Suraida Nanez-James
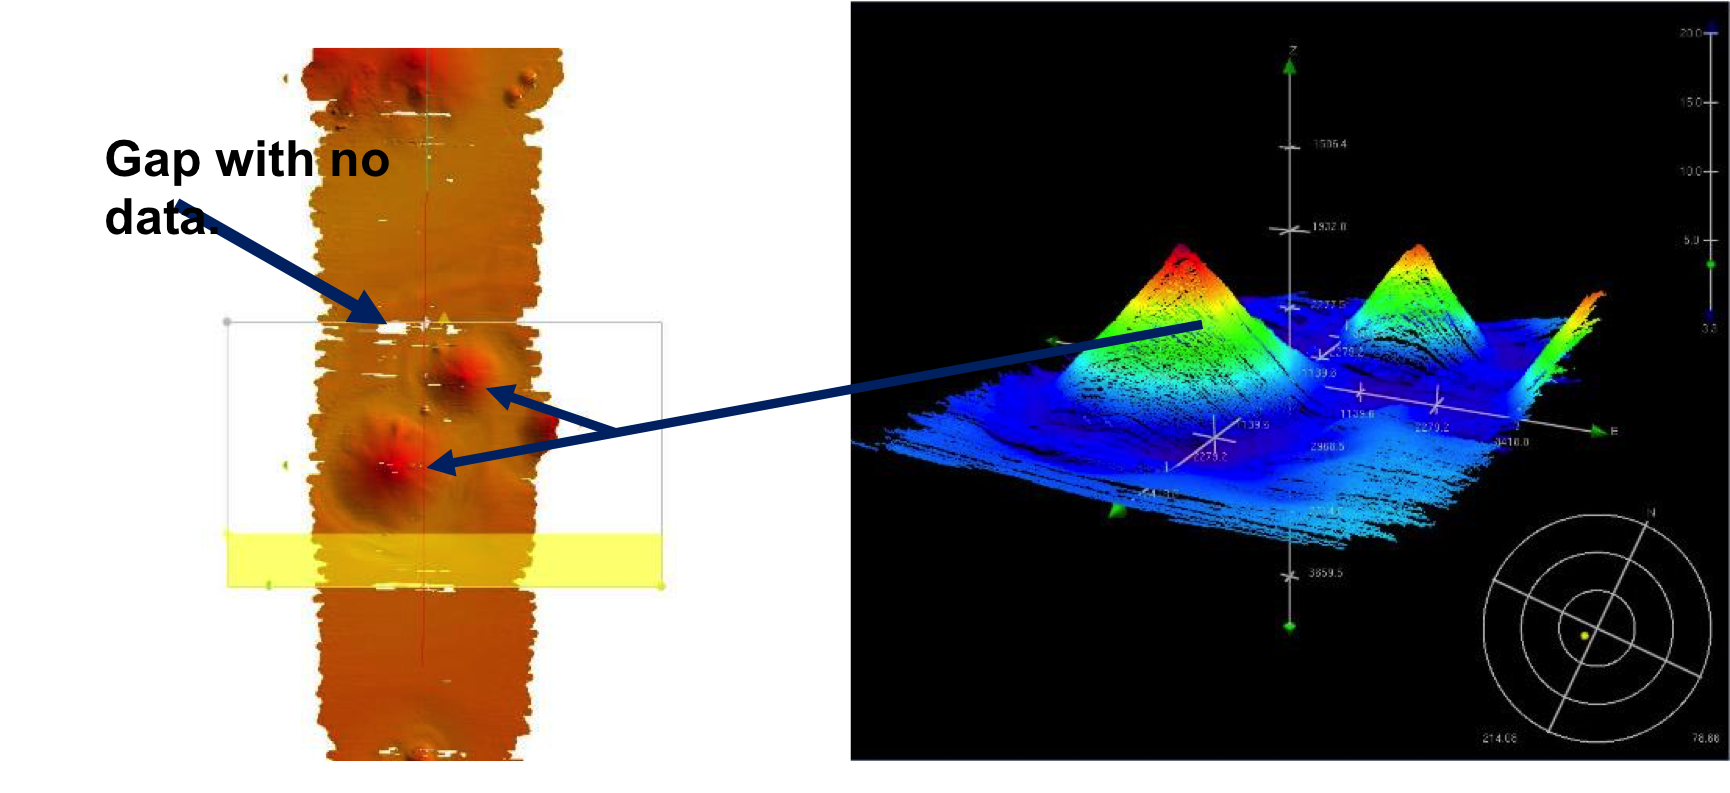
(Left) A swath with visible white spaces representing gaps in the data set. (Right) 3D image of processed data from the adjacent swath.
Credit: SOI/John Greene
Headed West
For those of you asking for a quick weather update, we are headed out to avoid a couple days of rough weather as Typhoon Champi begins to link up with the low pressure storm in the far north Pacific. Heading west will help avoid the weather and when conditions improve, we will come back to the survey area. Keep following our journey as we weather the storm.
– Suraida Nanez James is the Manager of Distance Learning and Outreach at the Texas State Aquarium


