
29 June 2015
Beijing quadrupled in size in a decade, new study finds
Posted by Nanci Bompey
By Carol Rasmussen
Data from NASA’s QuikScat satellite show the changing extent of Beijing between 2000 and 2009 through changes to its infrastructure. Gray and black indicate buildings, with the tallest and largest buildings in the city’s commercial core appearing lighter gray. Other colors show changes in areas not yet urbanized (for example, clearing land or cutting down trees), with the rate of change indicated by color. Blue-green indicates the least change, yellow-orange more change, and red the greatest change.
Image credit: NASA/JPL-Caltech
A new study has demonstrated a novel technique to quantify urban growth based on observed changes in physical infrastructure. The researchers used the technique to study the rapid urban growth in Beijing, China, finding that its physical area quadrupled between 2000 and 2009.
A team led by Mark Jacobson of Stanford University, Palo Alto, California, and Son Nghiem of NASA’s Jet Propulsion Laboratory, Pasadena, California, used data from NASA’s QuikScat satellite to measure the extent of infrastructure changes, such as new buildings and roads, in China’s capital. They then quantified how urban growth has changed Beijing’s wind patterns and pollution, using a computer model of climate and air quality developed by Jacobson.
New infrastructure alone — the buildings and roads themselves, not including additional pollution created by the new city dwellers and their vehicles — created a ring of impacts around the older parts of Beijing. The impacts included increasing winter temperatures by about (3 to 4 degrees Celsius (5 to 7 degrees Fahrenheit) and reducing wind speed by about 1 to 3 meters per second (2 to 7 mph), making the city air more stagnant.
“Buildings slow down winds just by blocking the air, and also by creating friction,” Jacobson explained. “You have higher temperatures because covering the soil reduces evaporation, which is a cooling process.” Roads and roofs heat up more during the day than soil or vegetation would because they are drier. The heat and more stagnant air create a cascade of consequences, such as increased ground-level ozone pollution.
Beijing’s official city limits enclose an area larger than the state of Connecticut, but much of that real estate is undeveloped and likely to remain so — nature preserves and rugged mountains, for example. The Chinese capital is far from the only world city whose official area differs from its actual footprint.
“There are so many definitions of urban extent, both legislative and administrative,” Nghiem pointed out. “To learn how physical change affects the environment, you cannot use an arbitrary political definition. The reality is what’s happening on the ground.” The new method allows researchers to pinpoint just that.
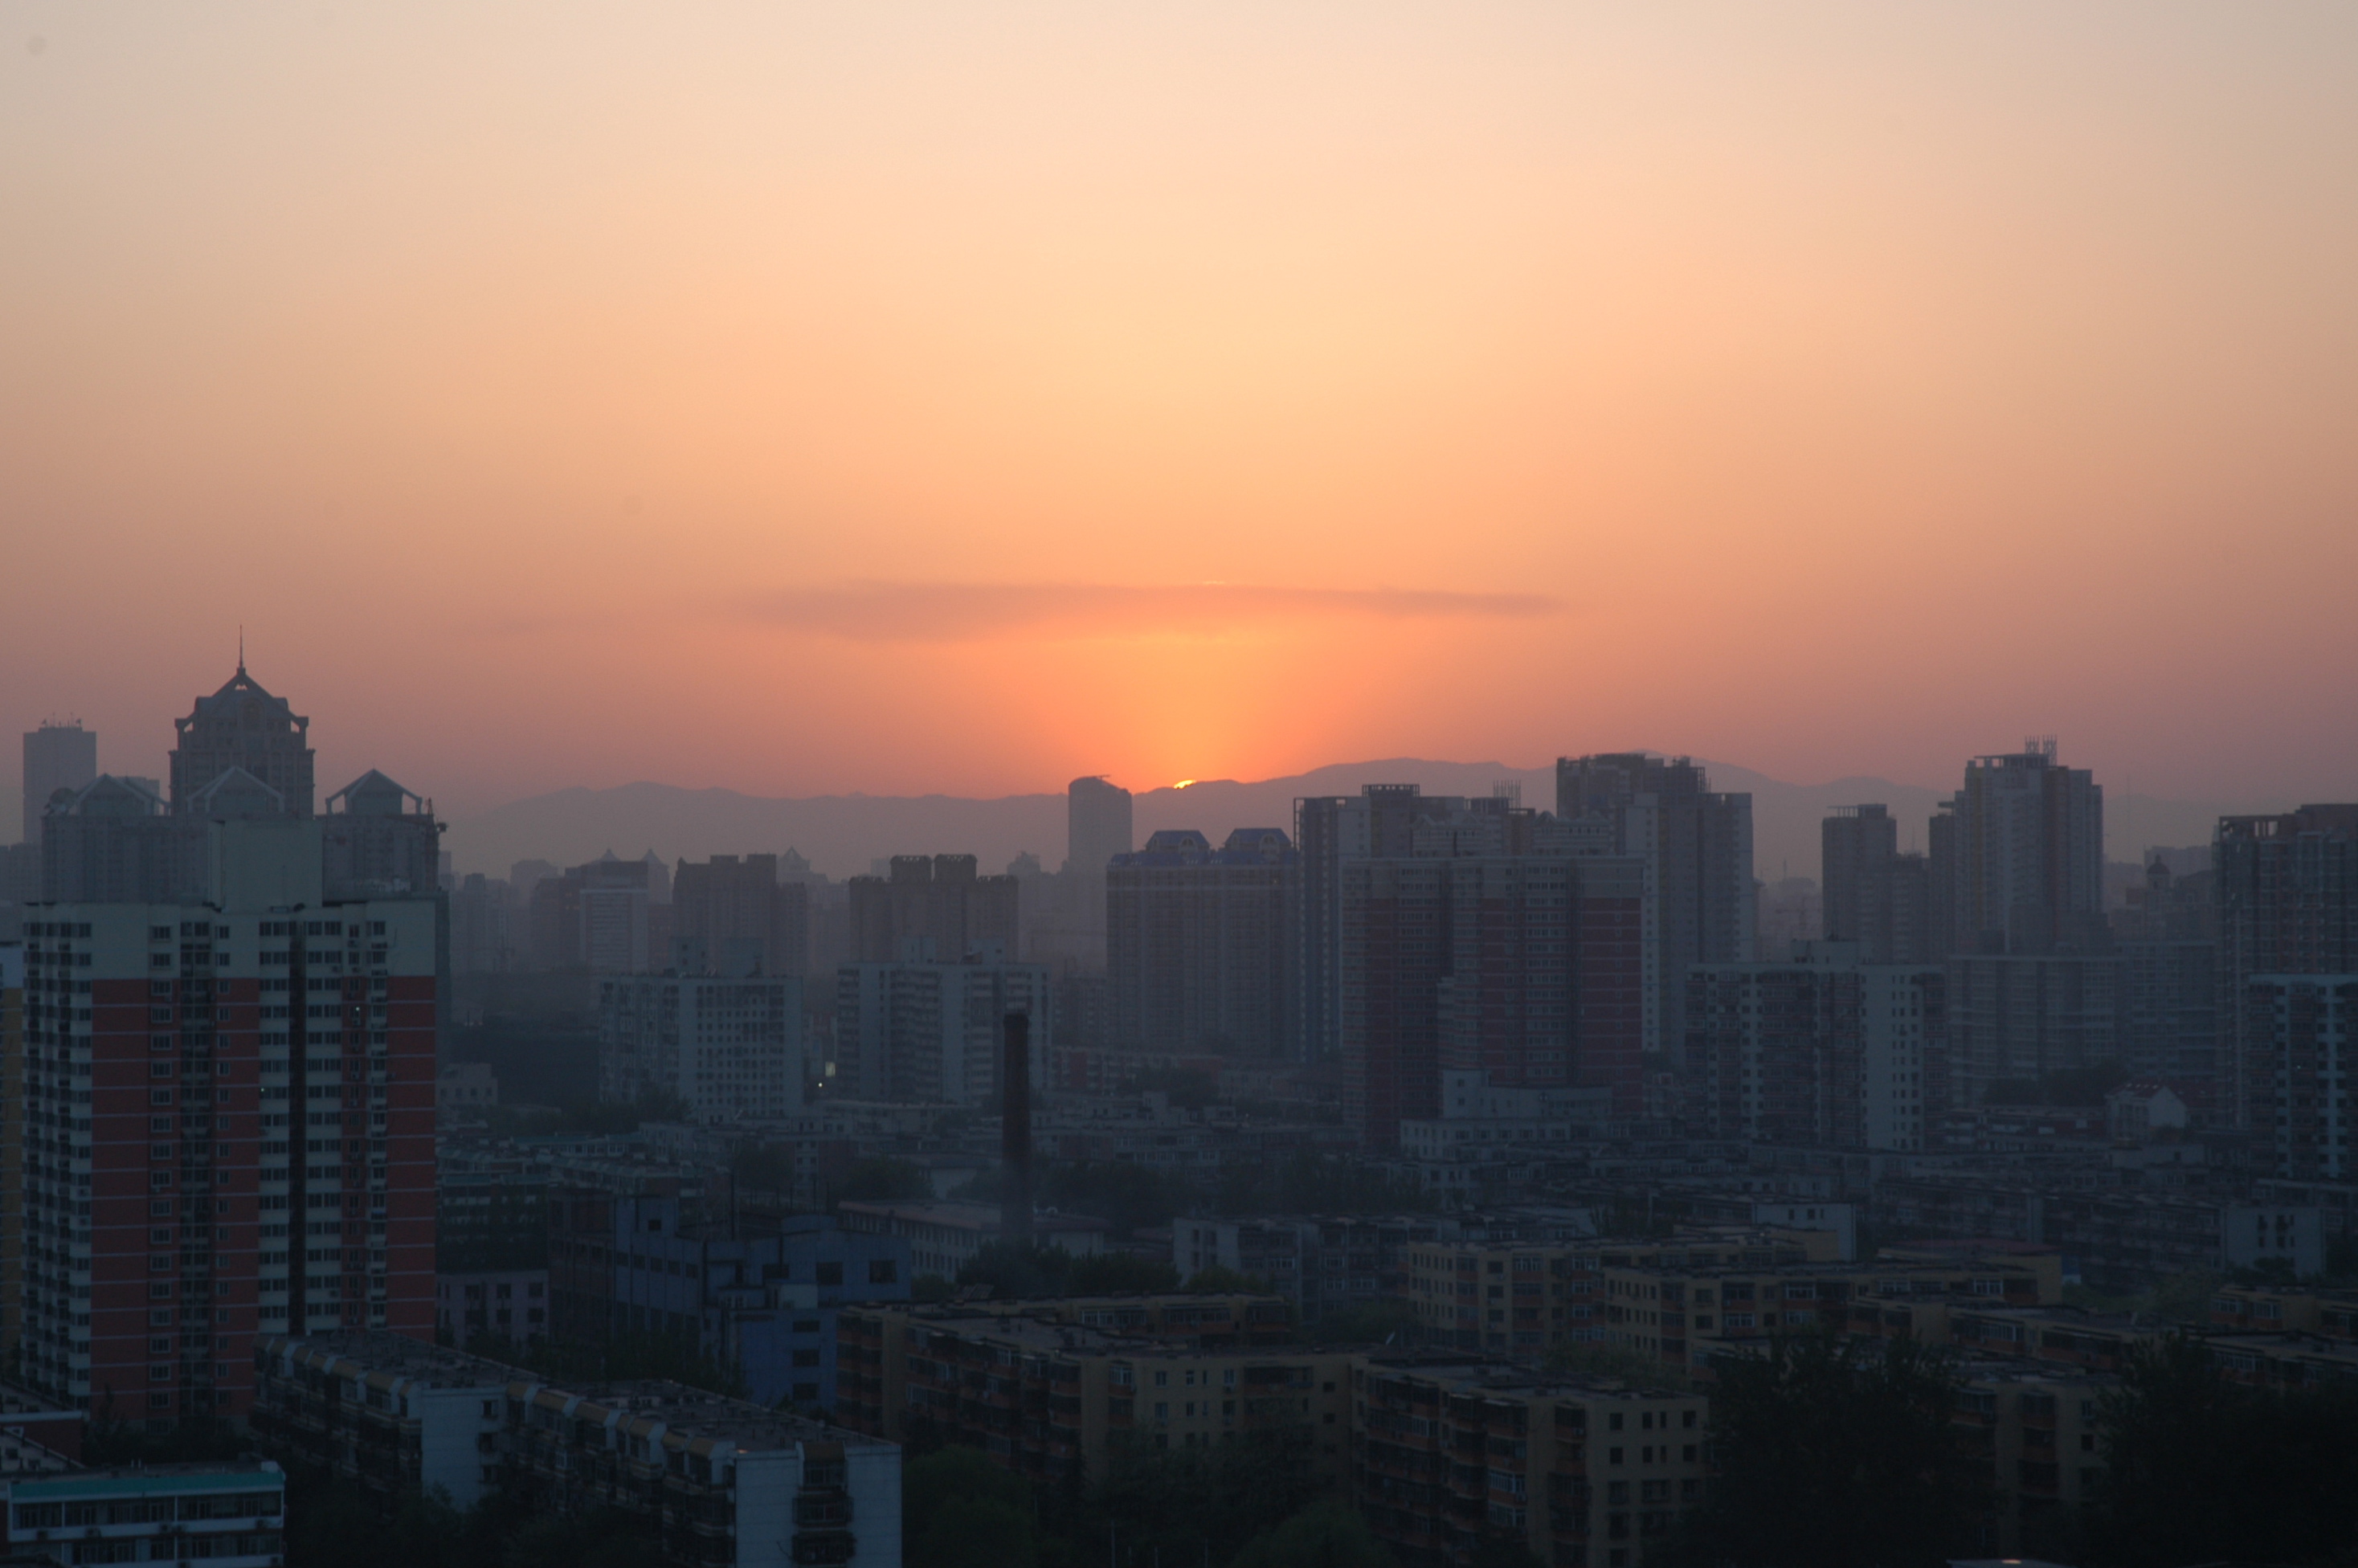
Beijing city center.
Image credit: Wikimedia Commons
Other satellites such as Landsat, operating since 1972, and the Visible Infrared Imaging Radiometer Suite on the Suomi National Polar-orbiting Partnership satellite also track urbanization in various parts of the world. These mostly use visible evidence, such as changes in the extent of city lights or clearing of vegetation, as stand-ins for growth. These measures have recognized limitations, however. For example, city neighborhoods without streetlights may be indistinguishable from the countryside at night. Nghiem’s technique can enhance and complement existing measurements.
Nghiem used advanced data-processing techniques on measurements from NASA’s QuikScat scatterometer, a satellite radar managed by JPL that operated from 1999 to 2009. Like all radars, QuikScat sent pulses of microwaves toward Earth and recorded the waves that bounced back, called backscatter. Nghiem’s technique takes advantage of the fact that human-built structures produce stronger backscatter than soil or vegetation. The more, larger or taller the buildings are, the stronger the backscatter. His data-processing method improves the “focus” of the QuikScat image from a pixel size of about 25 kilometers (15 miles) per side to 1 kilometer (0.6 mile) per side, allowing the researchers to capture detail at the scale of a few city blocks.
Nghiem emphasized that the study set only the lower bounds for the impacts of urbanization on local weather and pollution. “If you were to develop a city that didn’t allow any pollution sources, not even a single gas-powered car, you would still have these bad effects.”
For more information about NASA’s Earth science activities, visit: http://www.nasa.gov/earth
— Guest blogger Carol Rasmussen is a member of NASA’s Earth Science News Team. This post originally appeared on the NASA JPL Website.


