9 November 2015
Tamu Massif: Closing thoughts from Chief Scientist Dr. William Sager
Posted by lhwang
By Dr. William Sager
This is the last post in a series of dispatches from scientists and education officers aboard the Schmidt Ocean Institute’s R/V Falkor. The crew was on a 36-day research trip to study Tamu Massif, a massive underwater volcano, located 1,500 kilometers (930 miles) east of Japan in the Shatsky Rise. Read more posts here.

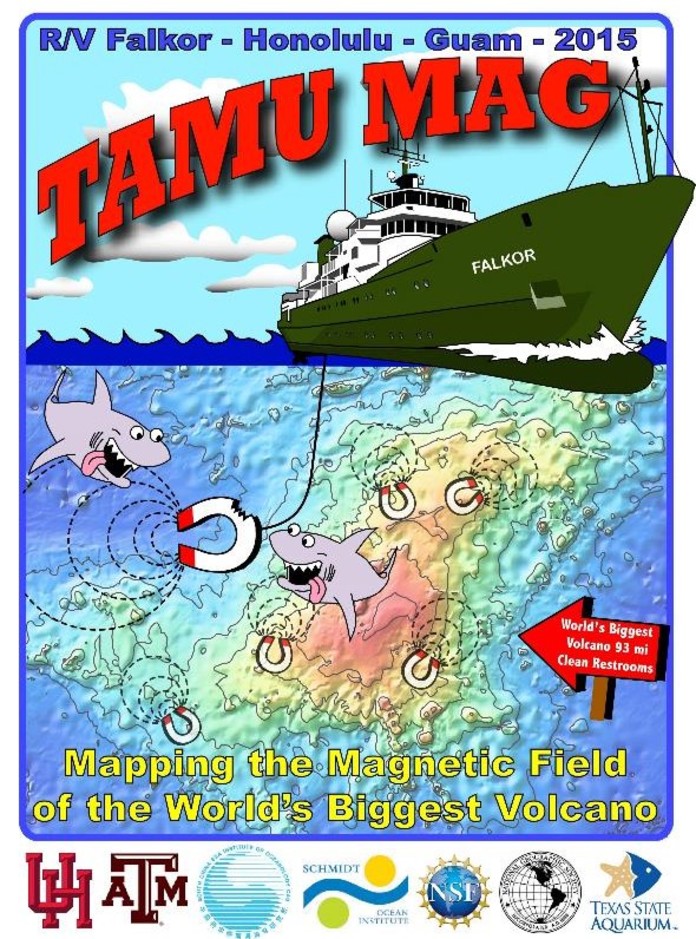
A specially designed t-shirt for Science team members and the Falkor crew. Dr. Sager designed these shirts for expedition FK151005.
Credit: Dr. William Sager
Statistics on Tamu Massif
The Tamu Massif cruise has been tremendously successful having sailed 98% of the planned track lines in an ambitious pre-cruise plan. Scientific cruises are rarely this successful due to Murphy’s law operating from many fronts, including weather, equipment, personnel, and this time – yikes! – sharks. This success is a testament to the dedication of the R/V Falkor crew.
One thing that stands out about this cruise is the size of area covered. It was an ambitious survey to cover all of Tamu Massif, the world’s largest known single volcano. In all, the survey covered an area of nearly one million square kilometers. We spent about 477 hours in the survey, gathering about 73 million bathymetric soundings and about 1.7 million measurements of the magnetic field.
Massive Data Sets and Taming the “Magnetic Spaghetti Monster”
To quote Dr. Seuss’ Cat in the Hat: “this mess is so big, so wide, and so tall – there is no way to clean it up – no way at all” – at least not in the short term. Now that we have our data drives overflowing, my students and I will now analyze these data. We will also make a new magnetic anomaly map to show what parts of Tamu Massif formed at what times.
The existing data set, which consists of many dozens of oceanographic cruises that passed over Tamu Massif in the last 53 years, looks like someone threw a plate of spaghetti at the computer screen. That randomness, along with most of the cruises being from past generations, has made the task of mapping the magnetic anomalies very difficult. We call this mess the “magnetic spaghetti monster”. The grid of north-south magnetic lines we collected look like the bars of a prison cell – so we now have the monster penned up.

Dr. Sager instructs PhD student and watchstander John Neese on data collection.
Credit: SOI/Suraida Nanez-James

Chief Scientist Dr. William Sager presents his final science update of the expedition.
Credit: SOI/Suraida Nanez-James
Bathymetry Highlights
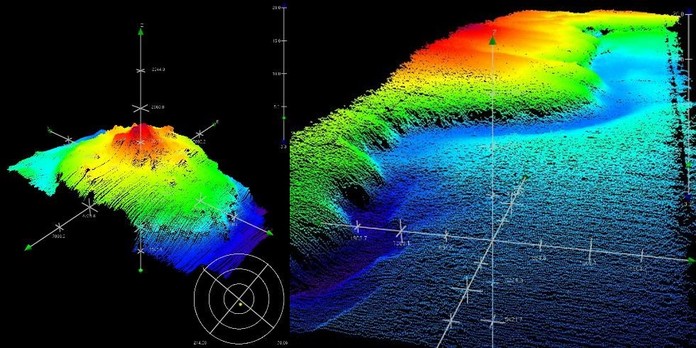
Everyone wants to know if we have seen something that helps us answer our pre-cruise questions. We observed various features in our multibeam bathymetry swath that we will process, but everything will take a lot of looking and thinking. We mapped dozens of secondary cones atop the big volcano that probably formed late in the volcano’s history, as is found at other large volcanoes. In places like Hawaii, many volcanoes form along rift zones, but here they are scattered all over, implying Tamu Massif does not have well-defined rift zones. There were many canyons cut into the sedimentary cover by downslope sediment flows, which will be identified and traced using our new data. The data also showed basal escarpments (cliffs) on the west side of Tamu Massif. The current idea is that these faults are formed by different parts of the volcano sinking at different rates, but Dr. Jinchang Zhang “Dr. Sam” and I think they look more like cliffs formed by landslides, so we are going to take a closer look.

(Right) A secondary cone atop big volcano that probably formed late in volcano’s history. (Left) Image showing basal escarpment (cliff) on Tamu Massif.
Credit: SOI/John Greene
Magnetic Highlights
The magnetic anomaly map will take some time to analyze, but we clearly see a wide positive anomaly oriented SW-NE along the axis of Tamu Massif. This is flanked by deep low magnetic anomalies on the north and south side. In a paper 23 years ago, I published a model showing the magnetic anomaly that Tamu Massif would create if it were all one magnetic polarity. It looks a bit like this, but the model anomaly is much wider. Somehow Tamu Massif has zones of stronger and weaker magnetization. As I was looking at this data set one day during the cruise – which looks much the same (but with less data) as it did many years ago – it occurred to me that I may be looking at it wrong. It does have zones of strong and weak magnetization. Normally, we would call those the magnetic stripes recorded by the mid-ocean ridges. The one over the middle of Tamu Massif is just wider. Maybe there was a ridge along the axis of Tamu Massif. It sounds a little crazy right now, but we will see if we can make a plausible explanation from this hypothesis. With the new data afforded by this cruise, we will have a data set with much better coverage to define the limits of the different anomaly bands.
— Dr. William Sager is the Chief Scientist aboard the R/V Falkor


 GeoSpace is a blog on Earth and space science, managed by AGU’s Public Information staff. The blog features posts by AGU writers and guest contributors on all sorts of relevant science topics, but with a focus on new research and geo and space sciences-related stories that are currently in the news.