20 June 2018
Seeing the World With New Eyes
Posted by Dan Satterfield
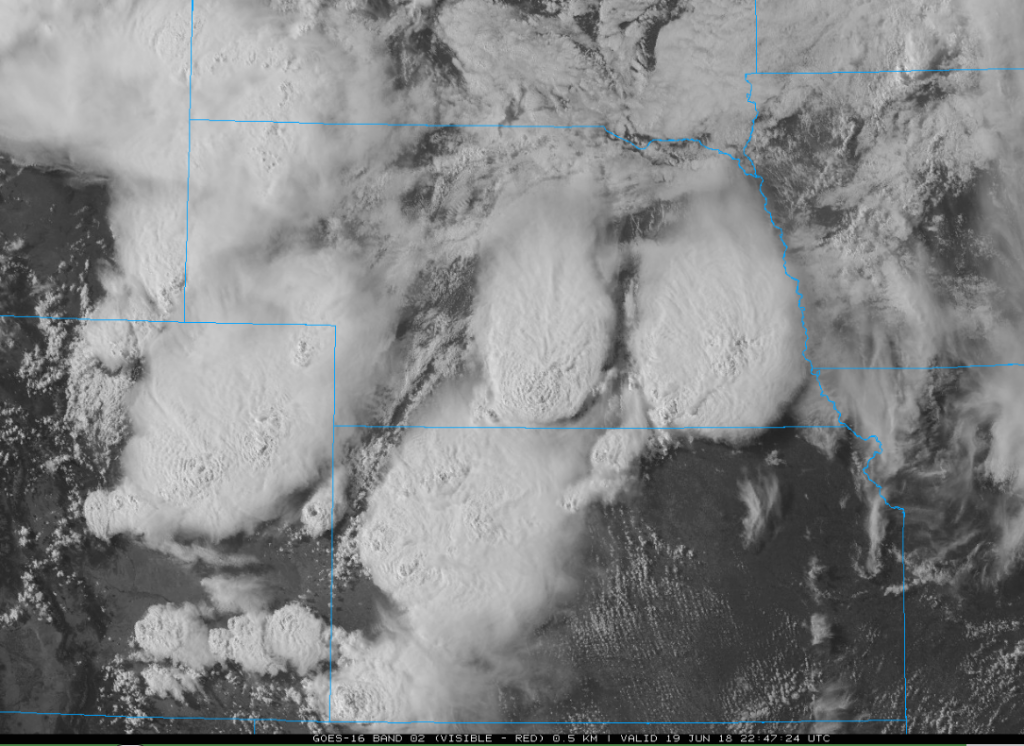
I want to share with you the kind of satellite imagery forecasters like me are using on a daily basis now, and show you how incredible it is. Thanks to GOES-R we are seeing things we never saw before, but one type of imagery, in particular, is my new favorite. So much so, that I have a running loop up every day on the monitors in our forecast center. It takes some explaining though, so let’s start with the more familiar first.
You’ve probably seen images like the one above online (and often colorized on TV weathercasts). With GOES-R however, we have twice the resolution that we had before, and we get an image every 5 minutes. If severe weather is possible, we can get an image every 30 seconds, but this just scratches the surface of what is really cool.
Let’s add one more set of data:
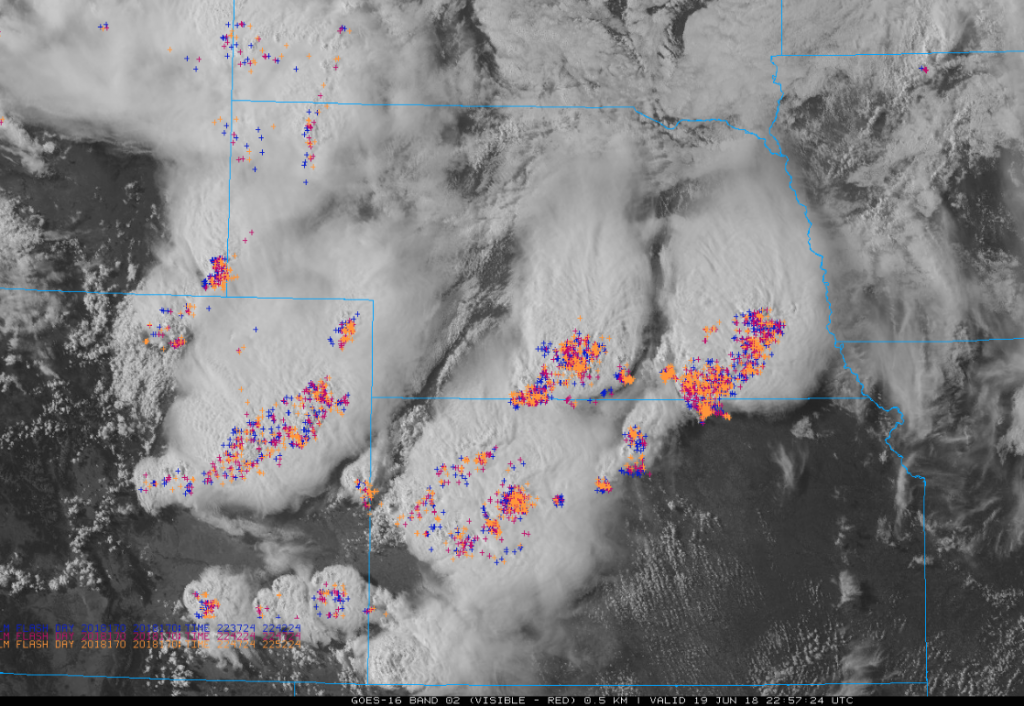
Image from the excellent College of Dupage satellite web page. All images in this post are from this site.
Now you are looking at the same image with lightning strikes added in. You may have seen lightning strikes on radar images before, but those are just cloud to ground strikes detected by ground-based antennas. The lightning on the image above is from the GOES Satellite’s lightning mapper and it shows ALL flashes (cloud to cloud, cloud to ground etc). Looking at total lightning is a much better way to judge how strong the updraft is in a storm, and can be an indicator that a storm is about to produce severe weather. This data can give a warning of up to 15 minutes that a storm may be about to become dangerous, and we can see this lightning data in near real-time now.
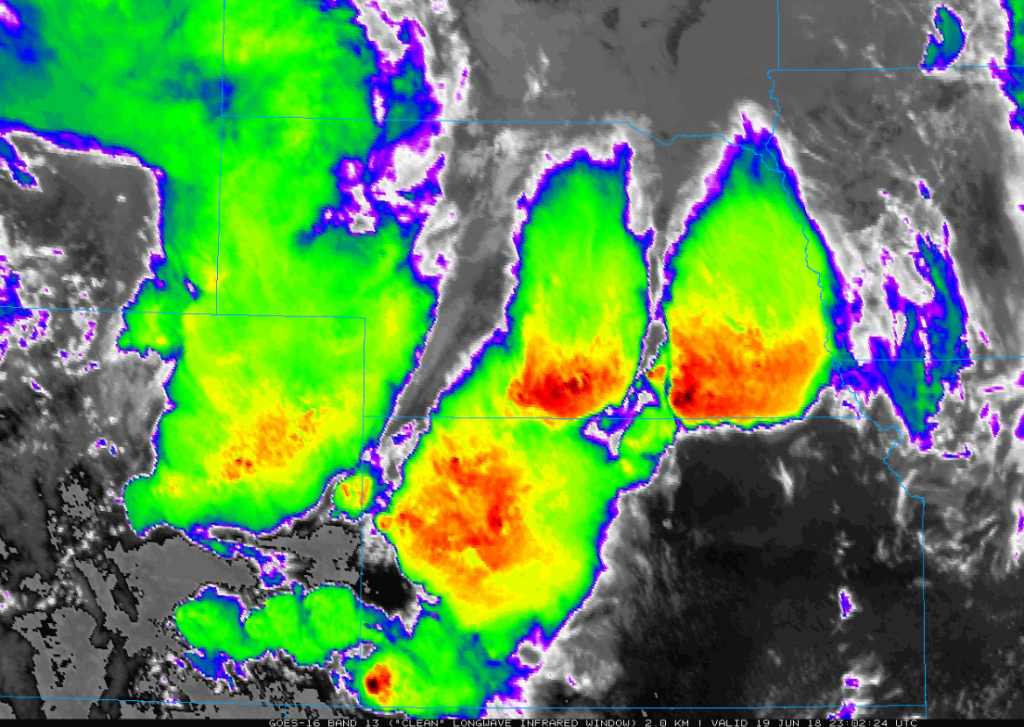
It gets better though. Let’s see what the storm looks like in light our eyes cannot see- at a wavelength of 10.3 microns. This is called the clean window IR. Water vapor in the air does not block radiation at this wavelength, so we can see clouds and ground and essentially the IR radiation given off is a function of temperature. The higher a storm reaches into the atmosphere, the colder it is and we can see this easily with IR.
 Can you spot the coldest clouds tops? See that dark red spot at the bottom of the image? That is what we call an overshooting top. A strong updraft produced that cold cloud top which is punching into the stratosphere. The cloud temp. there was -75C! Yes, you can get the temperature off the satellite image. I put the scale below on the right.
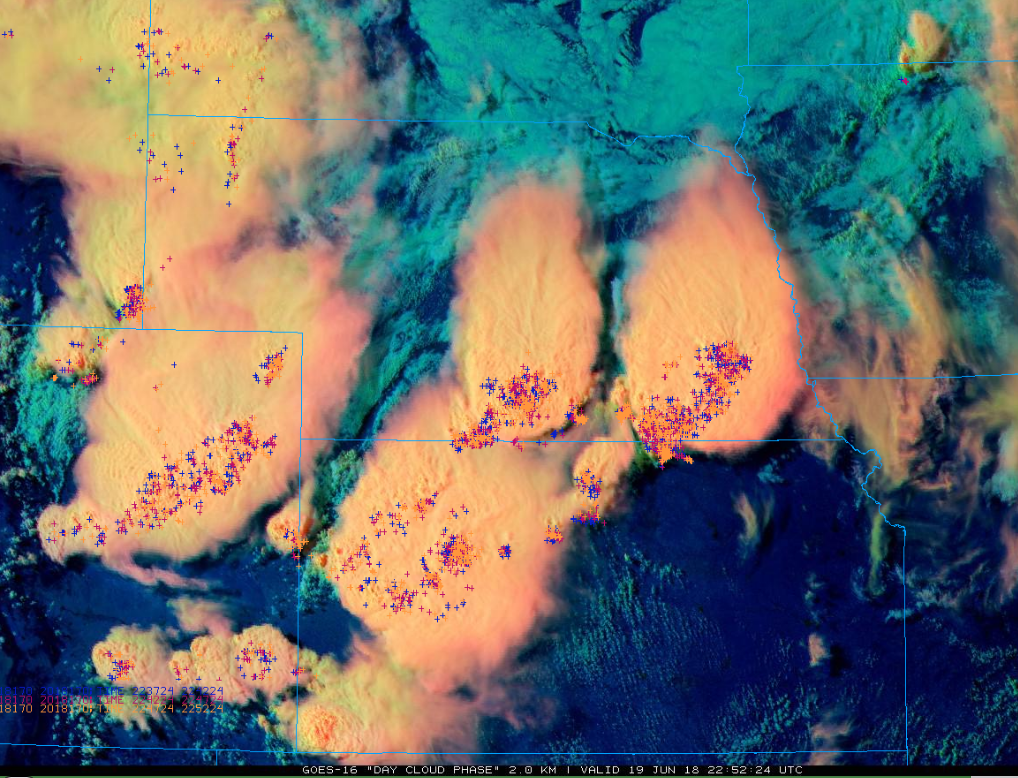
Now, we are getting to the cool stuff. We can combine a visible, near infrared and IR images into one image. This is done by assigning a different color scale to the visible, IT and near IR images. Look at the image below. It’s what we call an RGB Day Cloud Phase image. This is my fave!
Click on this image and take a good look at it. There is a ton of information here. Here’s how it’s put together:
The visible image is in red with bright white being bright red. The IT is green with very cold being bright green and warm being dark green. The near IR is made of blue shades. The thunderstorm tops look pink because they are very cold but show up very bright in the visible. Low clouds are fairly bright in visible light but are warmer in the IR and when you combine the channels you get low clouds made of water (vs. ice crystals) tinted aqua. The warm ground is dark in the visible and near IR and shows up as dark blue (mainly from the IR channel!)
So, in this one image I can see ice clouds, low water clouds, and if there was snow on the ground, it would be a bright green! Add in the lightning data, and there’s suddenly a lot of information there about what’s happening in the atmosphere. I’ve not shown this imagery on air yet, because as you can see, it takes some explaining!
These RGB images are very valuable and this isn’t the only one. If you want to play around with making your own RGB satellite images, then check out a module developed by COMET. Meteorologists use COMET modules for continuing education but they have a module on RGB images and anyone can do it! Do a few of those modules and you’ll see a lot more on those pretty satellite images than others do!
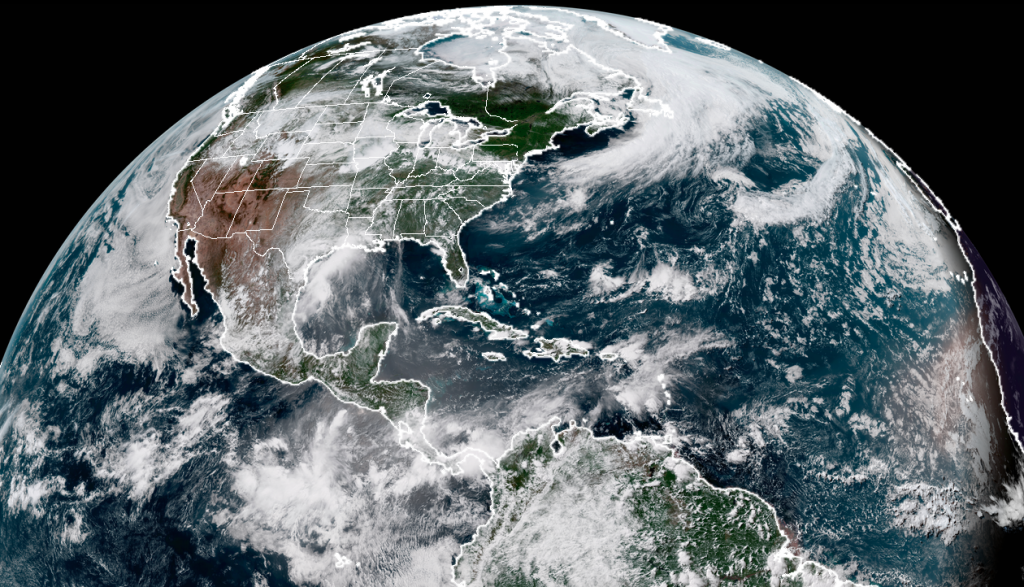
This is a GEOCOLOR image developed by CIRA that uses a near IR channel to make an image close to what the eye would see. Using this filter, it even makes the Himawari satellite’s true colour images look better.
Now GOES-16 does not have a sensor for green light, but we can cheat and use a near IR wavelength that is close to the green and guess what we get? An almost true colour picture:
While these look gorgeous, I hope you now realise why we really care more about the separate channels and the information they can provide. The Japanese Himawari Weather Satellite does have red, blue, and green sensors and can produce a true visible image. The image below is about 20 minutes old as I post it and was taken at 06 GMT 20 June. It looks a little different than what your eye would see because the Himawari green channel is at .51 micrometers vs .55. The NASA Terra satellite in polar orbit gives a stunning colour image and I have that below as well.
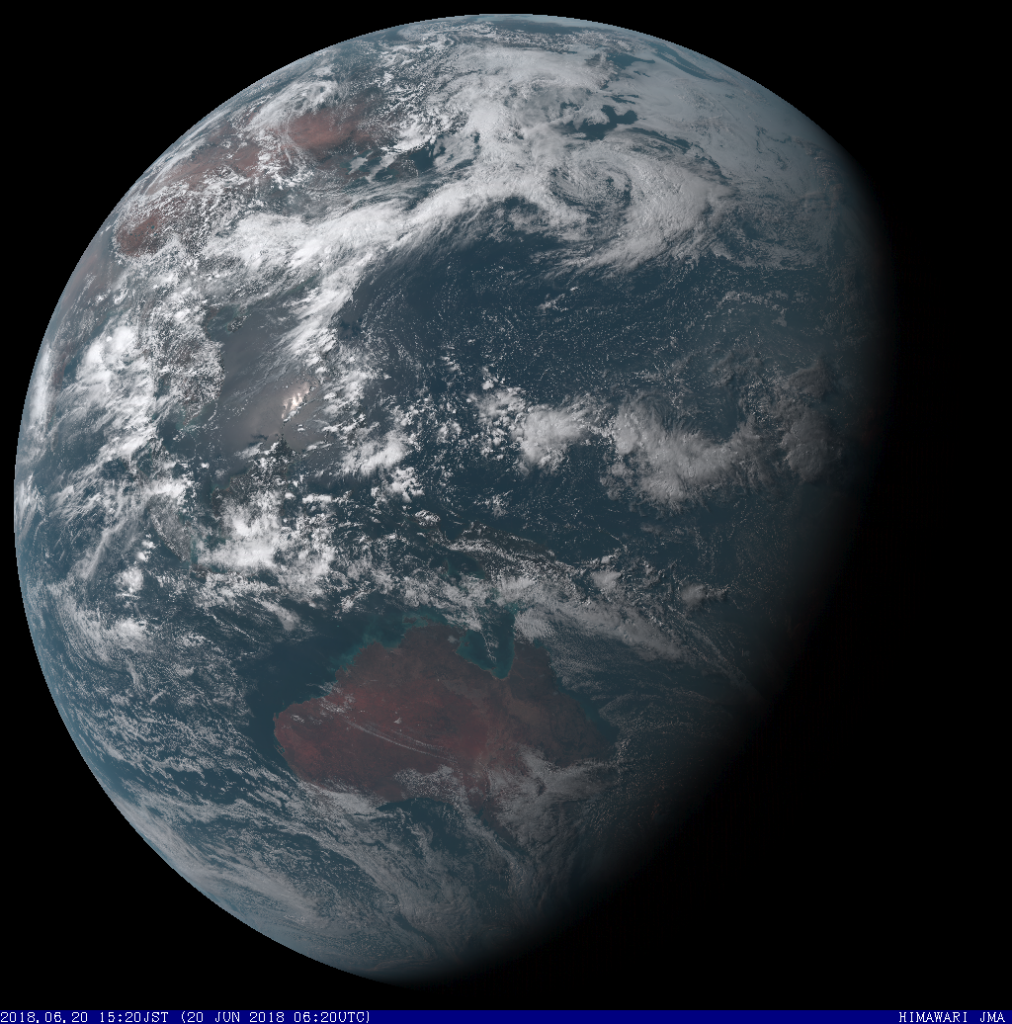
Himawari image in true colour. It looks a little “dirty because the green light sensor is at .51 micrometers vs .55um.
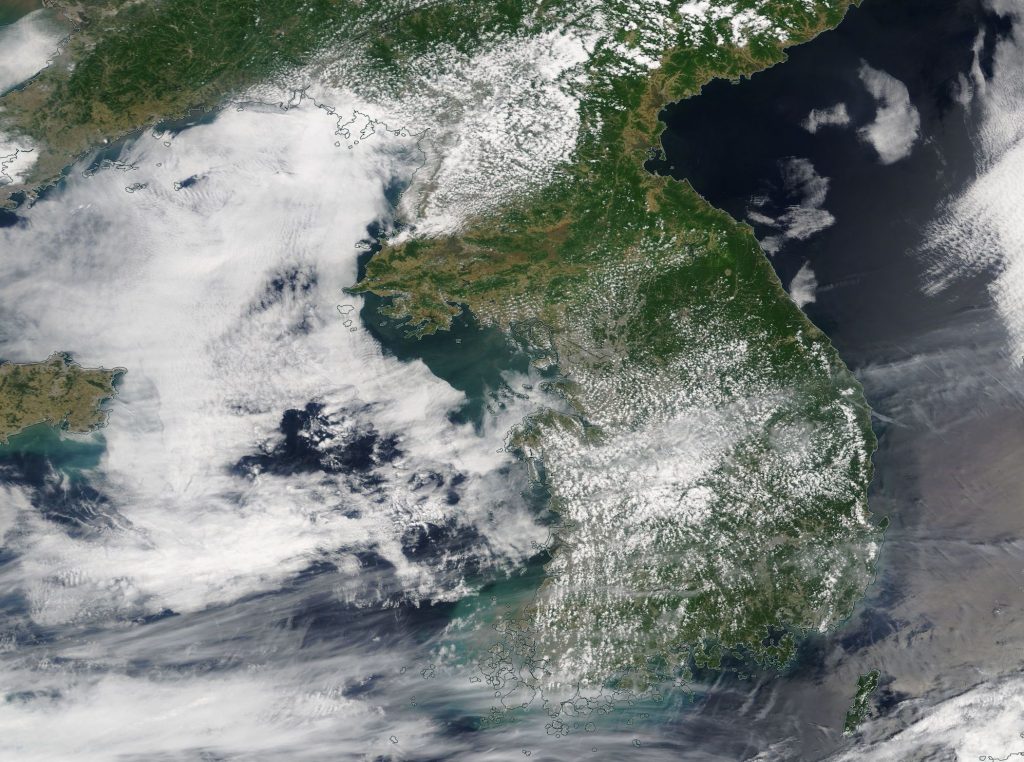
Below, is Korea today from the NASA Terra satellite. This is pretty close to what an astronaut would see.
If you are a student who finds this fascinating, you should know that this is just the tip of the iceberg, because remote sensing is revolutionizing all of Earth science. You should see what the astronomers are putting into the new Webb Space Telescope! If you’re around people telling you that chemtrails are real, climate change is a hoax, and evolution is just an unproven theory, then escape from the middle ages! Get to know your science teachers. Ask for help in preparing for college science courses, and then go make the world better.
It needs you. Start with this book.
Note: Half the world types colour and half color. I prefer colour.


 Dan Satterfield has worked as an on air meteorologist for 32 years in Oklahoma, Florida and Alabama. Forecasting weather is Dan's job, but all of Earth Science is his passion. This journal is where Dan writes about things he has too little time for on air. Dan blogs about peer-reviewed Earth science for Junior High level audiences and up.