6 February 2017
The Graph The Daily Mail Does Not Want You To See
Posted by Dan Satterfield
The Daily Mail says that NOAA is manipulating the climate data! No, really? That’s certainly a first for them.
NOT.
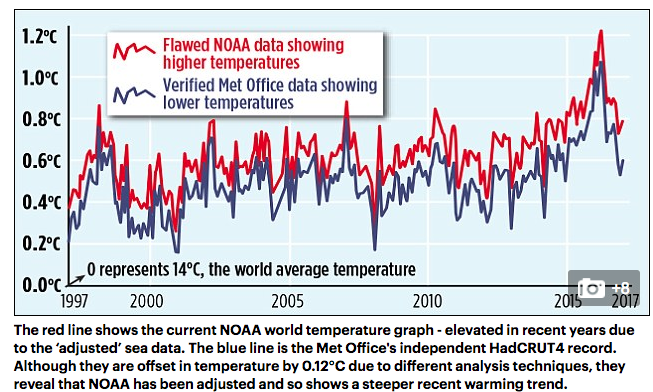
Here is a graph they published as proof.

From the Daily Mail. They changed the caption to say that they are offset by .12C but left the misleading graph up, rather than correct it! Look below to see the graph after their mistake is corrected.
Now, there is just one tiny problem, well actually, there are a bunch of them.
The Hadley (UK) data is based on an average from 1961-1990 while the NOAA data they plotted is based on 1901-2000. The baseline choice does not make any difference when you measure the rise or fall in temperature, but if you want to compare the two datasets, you must plot the graph with both using the same base time period.
The Daily Mail did not do that.
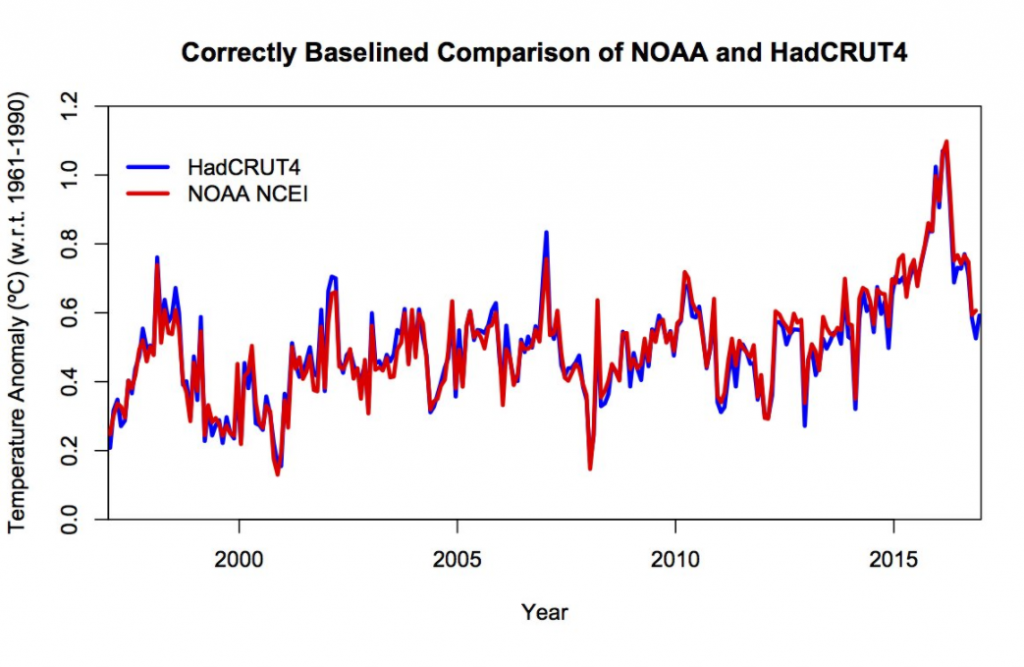
NASA climate expert Gavin Schmidt spotted this immediately and posted the correct graph on Twitter Saturday night before the Daily Mail was even on the street in the UK!
Zeke Hausfather, wrote about the error in detail shortly after it was published online, and he WAS involved in the NOAA temperature reconstruction.
When you correct for the baseline error, you can see how closely the UK Hadley data agrees with NOAA, and here’s the REAL graph below.

The correct comparison of the NOAA/UK Hadley Centre data. Posted by Gavin Schmidt at NASA on Twitter.
OOPS!
It looks pretty close to me!
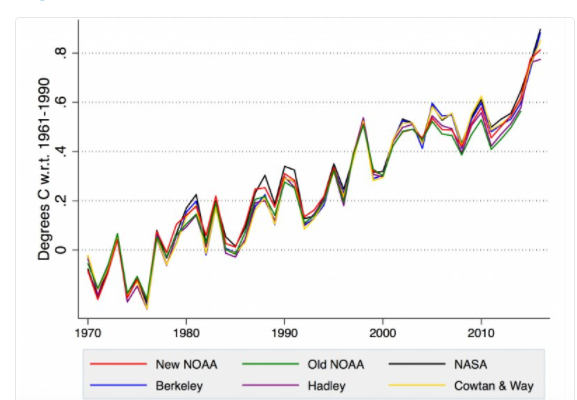
It’s not easy to reconstruct the Earth’s surface temperature record, and NOAA and the Hadley Centre each have their own with slightly different methods. A new updated analysis is soon to be released by NOAA, while U.C. Berkely has an independent reconstruction as well. Remarkably, though, they are all in close agreement, unlike what the Daily Mail tried to make you believe:
Did you notice the Daily Mail graph did not show any part of the reconstruction before 1997? I guess they didn’t want to show that big rise in temperature to their readers. Here is a tip: When I see a graph of Earths temperatures that starts within the last 25 years or so, it almost always sets off my fake science alarm. Someone is holding back all the data, and I start wondering what they DON’T want me to see?
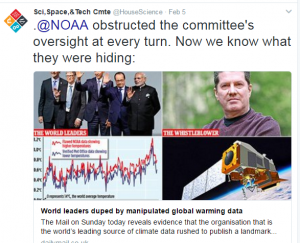
Take the time and read what Zeke wrote about this because he’s an expert on the subject and he shows how specious (adjective- superficially plausible, but actually wrong.) the story really is. The House Science Committee apparently relies on the Daily Mail for their science. Look at what they posted on Twitter:
 I guess they were too busy to ask the NOAA scientists who put together the reconstruction. Now you know how embarrassingly wrong they are.
Honest mistakes happen in journalism, and honest journalists correct them. The Daily Mail graph is still online as of Sunday night, and that should tell you something. Yes, they pointed out the error in the caption, but most people will see the graph, look at the headline, and believe a falsehood. Meanwhile, the print version is now lining garbage bins and bird cages from Dumfries to Dover, and from London to Liverpool.
That’s just where it should be.
Note: If you are trying to appeal to those susceptible to conspiracies, there’s a magic phrase that seems to work very well. It always starts with “What ‘they’ don’t want you to see/know”. Usually they’ is the government, medical doctors, scientists, etc. You see this on websites touting magic cures, super-diets, copper anything, and of course chemtrail conspiracy blogs. So, I thought I’d try it out in the title for this post!


 Dan Satterfield has worked as an on air meteorologist for 32 years in Oklahoma, Florida and Alabama. Forecasting weather is Dan's job, but all of Earth Science is his passion. This journal is where Dan writes about things he has too little time for on air. Dan blogs about peer-reviewed Earth science for Junior High level audiences and up.