17 July 2016
What Not To Do During The Heat Wave Next Week!
Posted by Dan Satterfield
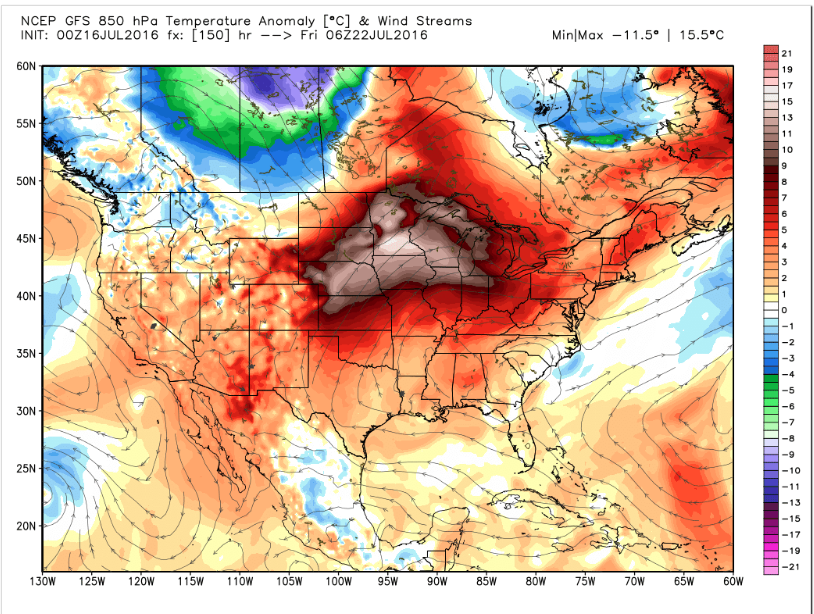
The NOAA GFS Model is predicting temps. as much as 15ºC above normal by late Thursday, across Minnesota, and into the Great Lakes, and as much as 12ºC farther west into Nebraska and KS. This heat wave will hit the major NE population centers by the weekend.
There is very high agreement in the medium range models this morning that an intense heat wave will build across the Eastern U.S. this coming week. It will begin in the Plains on Tuesday, and get much stronger by Wednesday, spreading highs above 100 into the Dakotas and Minnesota. It will then steadily shift eastward, reaching the Northeast and Mid-Atlantic by Friday, and over the weekend.
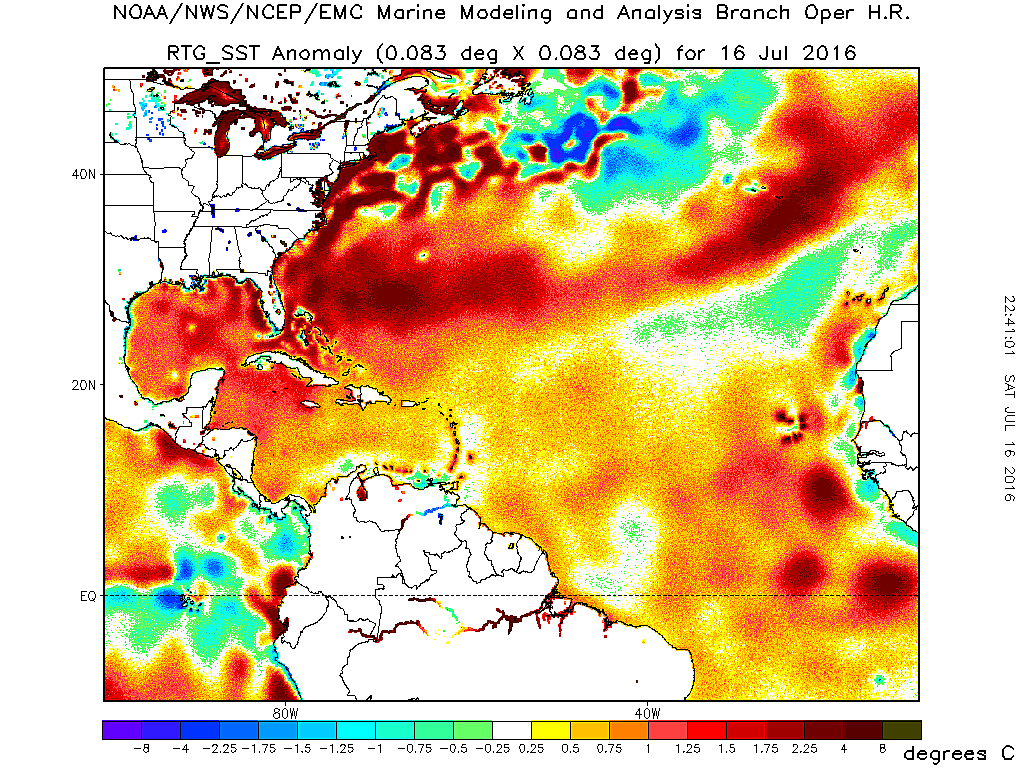
You can see the entire planet wide ocean temp. anomalies here. These are based on the average from 1961-1990. http://polar.ncep.noaa.gov/sst/rtg_high_res/
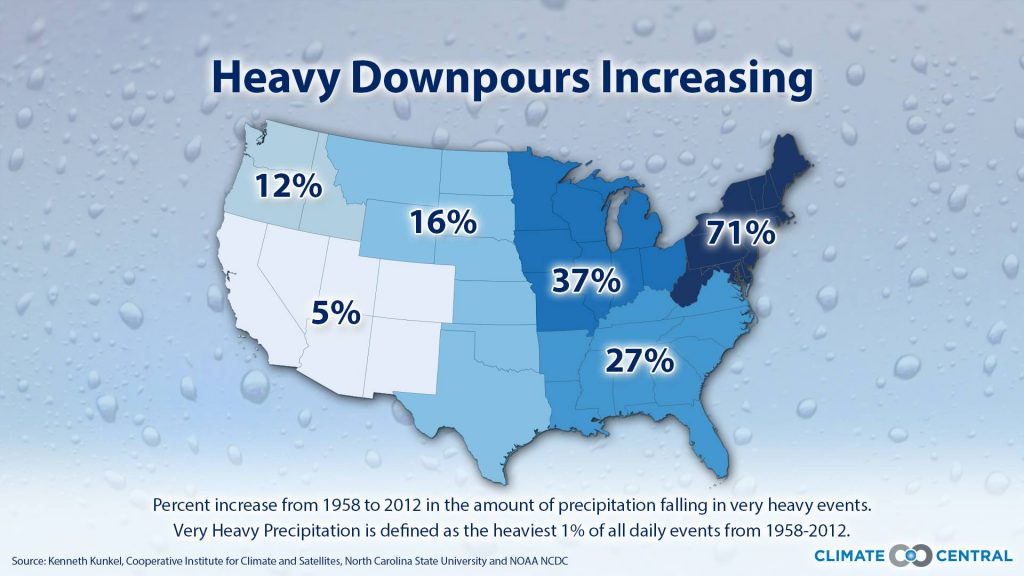 The oceans globally (and around North America) continue to be at record warmth, and this has already led to extremely high dewpoints as far north as Boston, along with some amazing downpours in local areas (The dewpoint reached 75ºF in Central park NYC!). The Delmarva Peninsula (where I am) has had 3 extreme rain events of over 7.5 inches in the last 21 days. One of these (last week) dumped over ten inches of rain west of Seaford,Delaware in just a couple of hours. These extreme rain events are increasing (as the graphic on the left bears out).
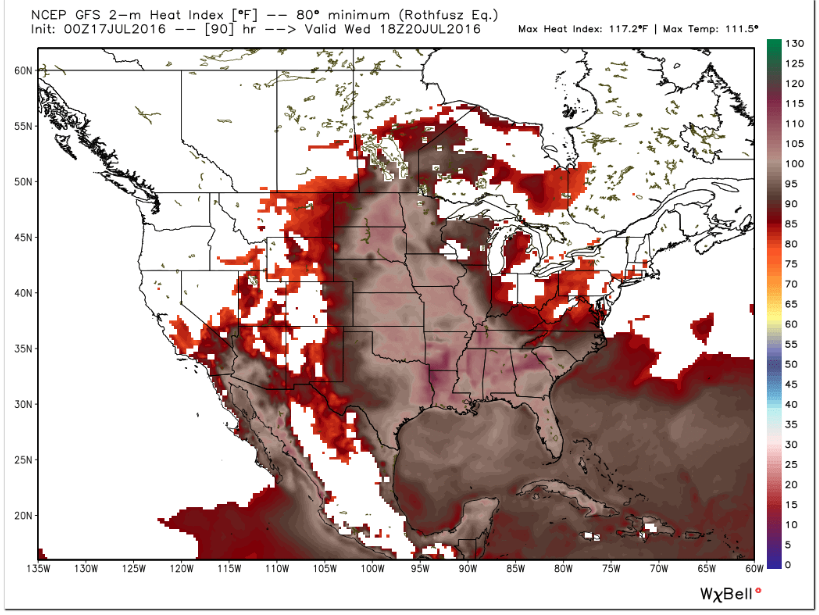
When you combine these expected very hot temps. with this soggy air, the heat index can reach dangerous levels. This is just what the models are predicting, with heat index values east of the Mississippi expected near 111 in some spots, or even higher. The heat index is NOT how hot it feels, anymore than the wind chill is how cold it feels, but it does give you a measure of how well your body can cool itself by sweating. When the heat index goes over 100, you are in definite danger of heat exhaustion, and eventually heat stroke, which can be life threatening. The elderly (and those who are not used to spending time in the heat) are most at risk.
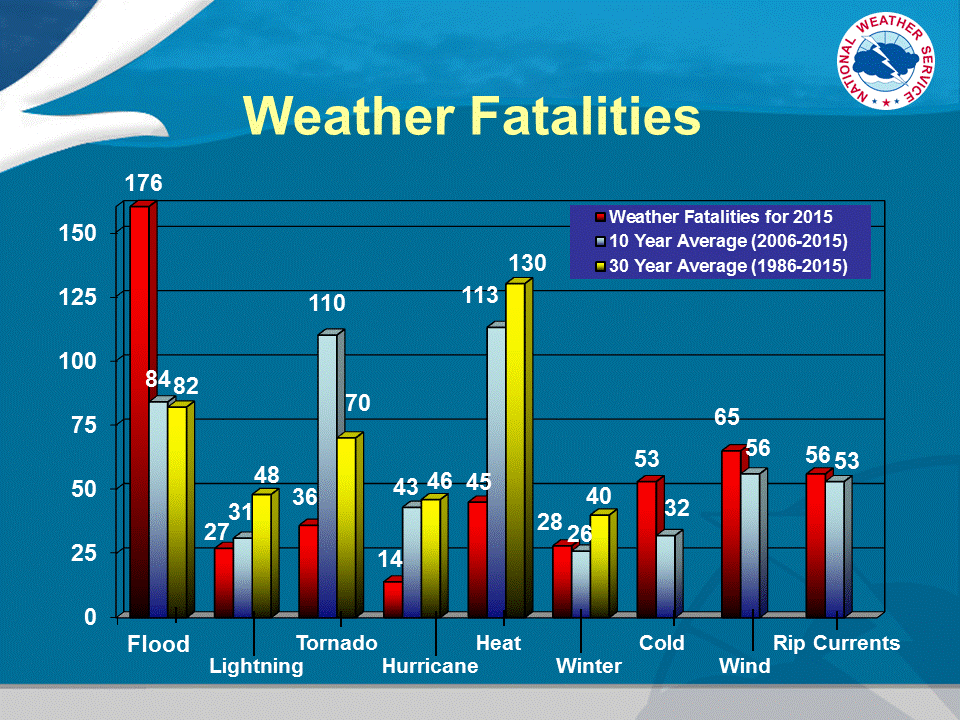
IMPORTANT: Having been in newsrooms for 35 years, I can tell you that we often cover heat deaths due to elderly people turning off their A/C to save from a high electric bill. If you have elderly friends or relatives, do not let them do this! Setting the thermostat at 82 will hold their bill down, and a fan can make them more comfortable. However, beware of using a fan without A/C, as this can be deadly! If the indoor temps gets above 95ºF, a fan can actually act like a convection oven, and heat the body instead of cooling it! This is especially true in high humidity, when the body cannot cool itself by sweating. A cool bath several times a day is the way to go, for those without A/C.
No doubt about it, the weather is going to start making big news this coming week.
Below, are some more images from the model guidance. I rarely post raw guidance, because it’s just that, guidance, but I’m very confident that this data is likely to be in the ballpark. The models have been very consistent over the last few days, and the Euro and Canadian models are also nearly identical. This increases forecast confidence that we will indeed see a major heat event. See the graphics below. (I’ll have one more note about the relationship to climate change after them.)
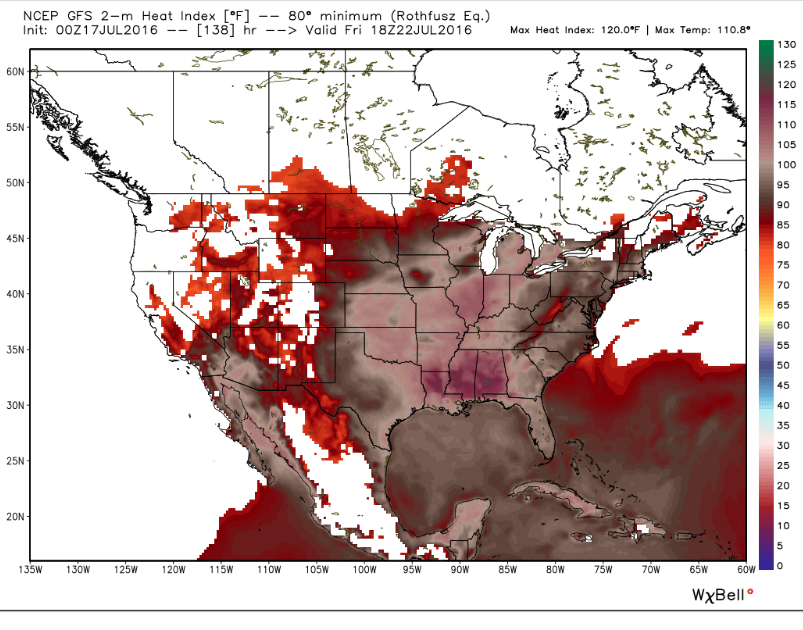
Heat index values near 105 as far north as Mass. are expected by Friday. (This is the NOAA GFS model). Click for larger version. I cannot show EURO model data (due to crown copyright restrictions). I can tell you that is indicating H.I. values of 100-110 from Oklahoma, to Boston, and through the SE U.S. Friday/ Saturday.
The map below shows the 500 millibar pressure pattern, and this is a good map to look at to spot a heat wave. When you have to go higher than 5900 meters to reach a pressure of 500 millibars, there must be a lot of hot air below it. The hotter the air, the higher the pressure levels are pushed up.(Think of the atmosphere expanding like a balloon when heated) The overall heat of the bottom part of the atmosphere can be measured by looking at the distance between the 1000 millibar pressure level at the ground, and the 500 millibar level. The hotter the layer, the bigger the distance. This measurement is called the 1000/500mb thickness, and numerical weather models do a good job of forecasting it. The 500 millibar map below is classic for a widespread intense heat wave.

Note: Hpa=Hectopascals. This is a more modern unit for millibars. The rest of the world actually uses hectopascals in public weather reports. Only the U.S. is left with Fahrenheit and inches of mercury!
THE CLIMATE CONNECTION:
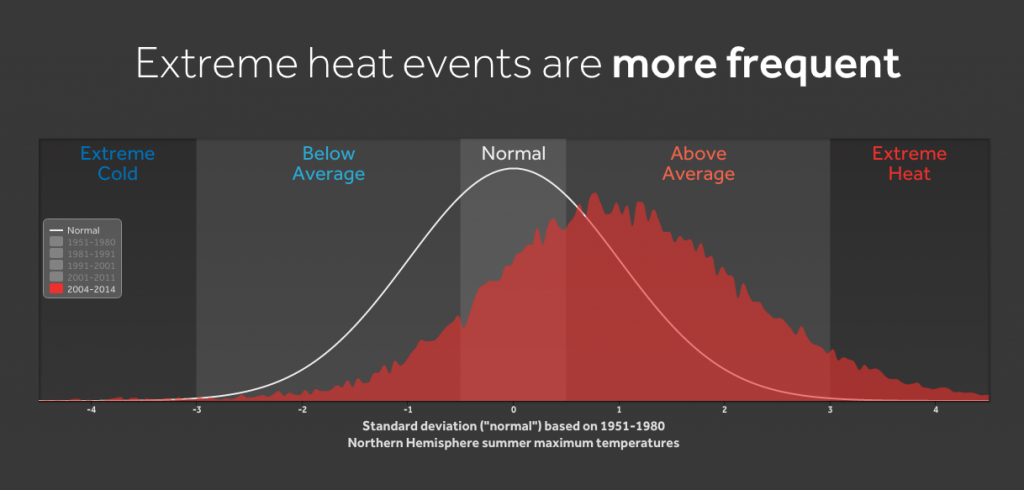
You may be wondering how climate change relates to this heat wave. Some folks this week will claim that it’s summer and heat waves happen. They’re right but there is more to the story. Others will point out that the first 6 months of this year have been so hot, we already will certainly break 2015 for the hottest year ever recorded! The correct way to understand it, is that the increasing greenhouse gases and the warmest oceans on record, make an intense heat wave more likely, and they can make it hotter. The graph below illustrates this very well. Climate change shifts the bell curve to the right. Most of the time the weather is under the big hump, with occasional extremes on one end or the other. When you warm the planet’s temp. as we have done, the heat records are more likely, and while we get cold records they are less likely.
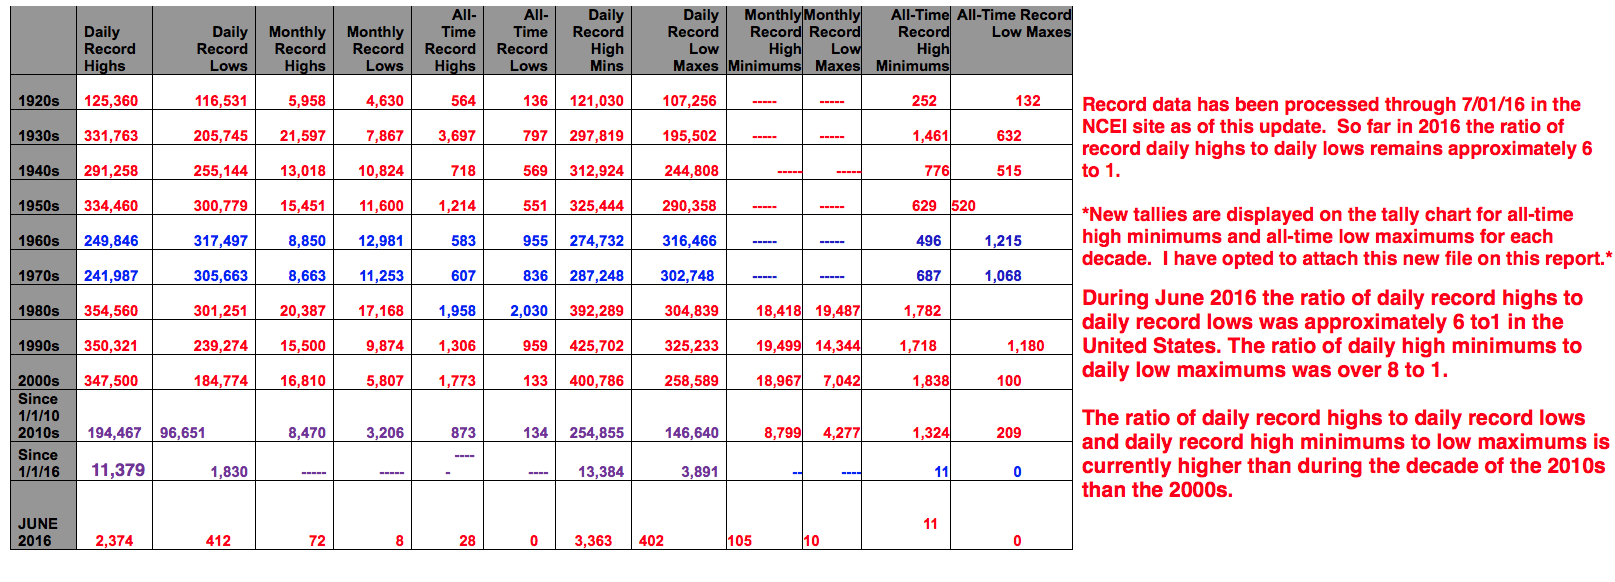
Now let me show you the proof. The numbers above show the record highs versus the record lows in the U.S. Take a minute to look at those numbers, and be prepared to be amazed at how many record highs we have, compared to record lows these days. Scary, no?
Now you have something to show to someone next week, when they say this heat wave has nothing to do with a changing climate.


 Dan Satterfield has worked as an on air meteorologist for 32 years in Oklahoma, Florida and Alabama. Forecasting weather is Dan's job, but all of Earth Science is his passion. This journal is where Dan writes about things he has too little time for on air. Dan blogs about peer-reviewed Earth science for Junior High level audiences and up.