13 October 2012
Fall Colors Are Peaking 10 Days Later Than the early 1980’s
Posted by Dan Satterfield
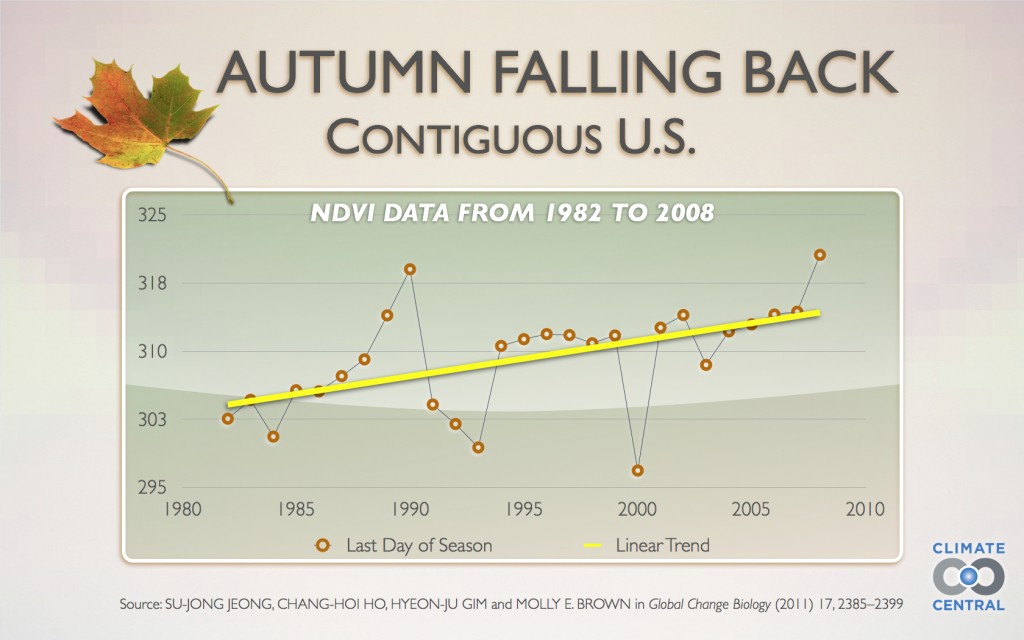
 The fall colors in America are peaking over 10 days later now than 30 years ago. How can you determine such a subjective thing as when fall colors are peaking? Well, that’s just as interesting as the results!
Take a look at the graph below courtesy of Climate Central.
The NDVI is the Normalized Difference Vegetative Index and in this case it was used to graph the times when the leaves were changing colors the fastest over North America. This is a good proxy for peak colors and the results speak for themselves: Fall colors are peaking well over a week later than in 1980-1985. The USGS has a good explanation of the NDVI:
The Normalized Difference Vegetation Index (NDVI) has been in use for many years to measure and monitor plant growth (vigor), vegetation cover, and biomass production from multispectral satellite data.
NDVI = (Channel 2 – Channel 1) / (Channel 2 + Channel 1)
(Channel 1; 0.58-0.68 micrometers) and near infrared (Channel 2; 0.725-1.10 micrometers):The principle behind NDVI is that Channel 1 is in the red-light region of the electromagnetic spectrum where chlorophyll causes considerable absorption of incoming sunlight, whereas Channel 2 is in the near-infrared region of the spectrum where a plant’s spongy mesophyll leaf structure creates considerable reflectance (Tucker 1979, Jackson et al.1983, Tucker et al. 1991). As a result, vigorously growing healthy vegetation has low red-light reflectance and high near-infrared reflectance, and hence, high NDVI values. This relatively simply algorithm produces output values in the range of -1.0 to 1.0. Increasing positive NDVI values, shown in increasing shades of green on the images, indicate increasing amounts of green vegetation. NDVI values near zero and decreasing negative values indicate non-vegetated features such as barren surfaces (rock and soil) and water, snow, ice, and clouds.
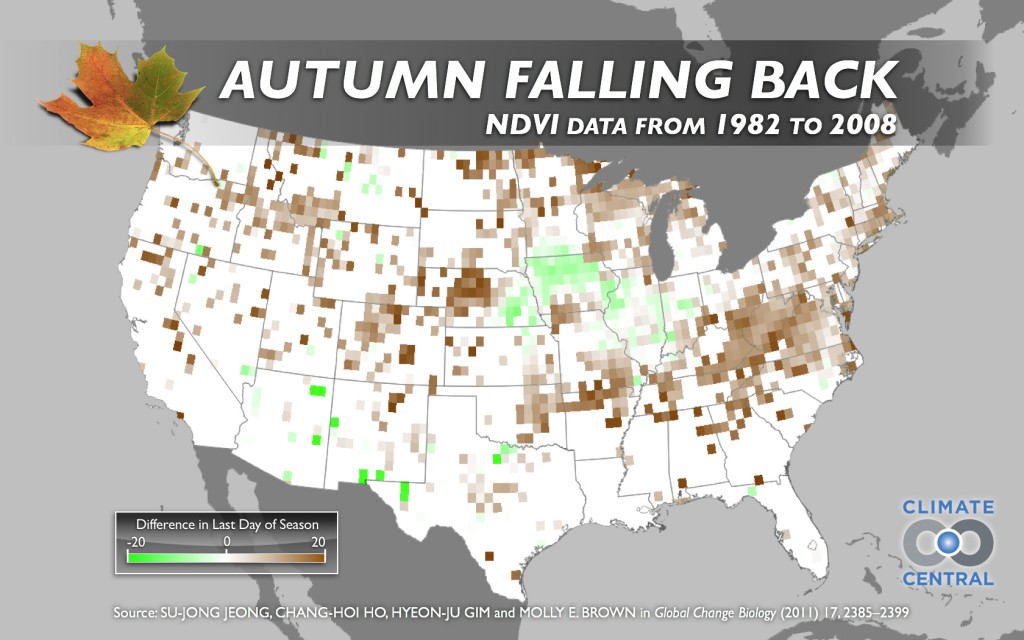
The graph above is based on the image below made from the raw data in the paper in Global Change Biology:


 Dan Satterfield has worked as an on air meteorologist for 32 years in Oklahoma, Florida and Alabama. Forecasting weather is Dan's job, but all of Earth Science is his passion. This journal is where Dan writes about things he has too little time for on air. Dan blogs about peer-reviewed Earth science for Junior High level audiences and up.
How about the last mowing date for the @#$% lawn. I was twenty the first time I mowed the lawn in October, I was forty the first time I mowed the lawn in November and the grass needed a trim for the first time in my life last December-I’m fifty-six.
Hope that “pit of hell” becomes a good meme.
If an area is water-stressed, wouldn’t that cause trees to colour earlier? If rainfall patterns were changing in Iowa area then earlier colour??? Also just a guess.
good question and perhaps so!
Exactly. Where I live the colors are just starting to peak, yet only 40 miles away they peaked in late September. So how does one decide when the peak actually is if they peak at different times in different places?