
14 March 2016
NASA: February Temperatures Hottest Ever
Posted by Dan Satterfield
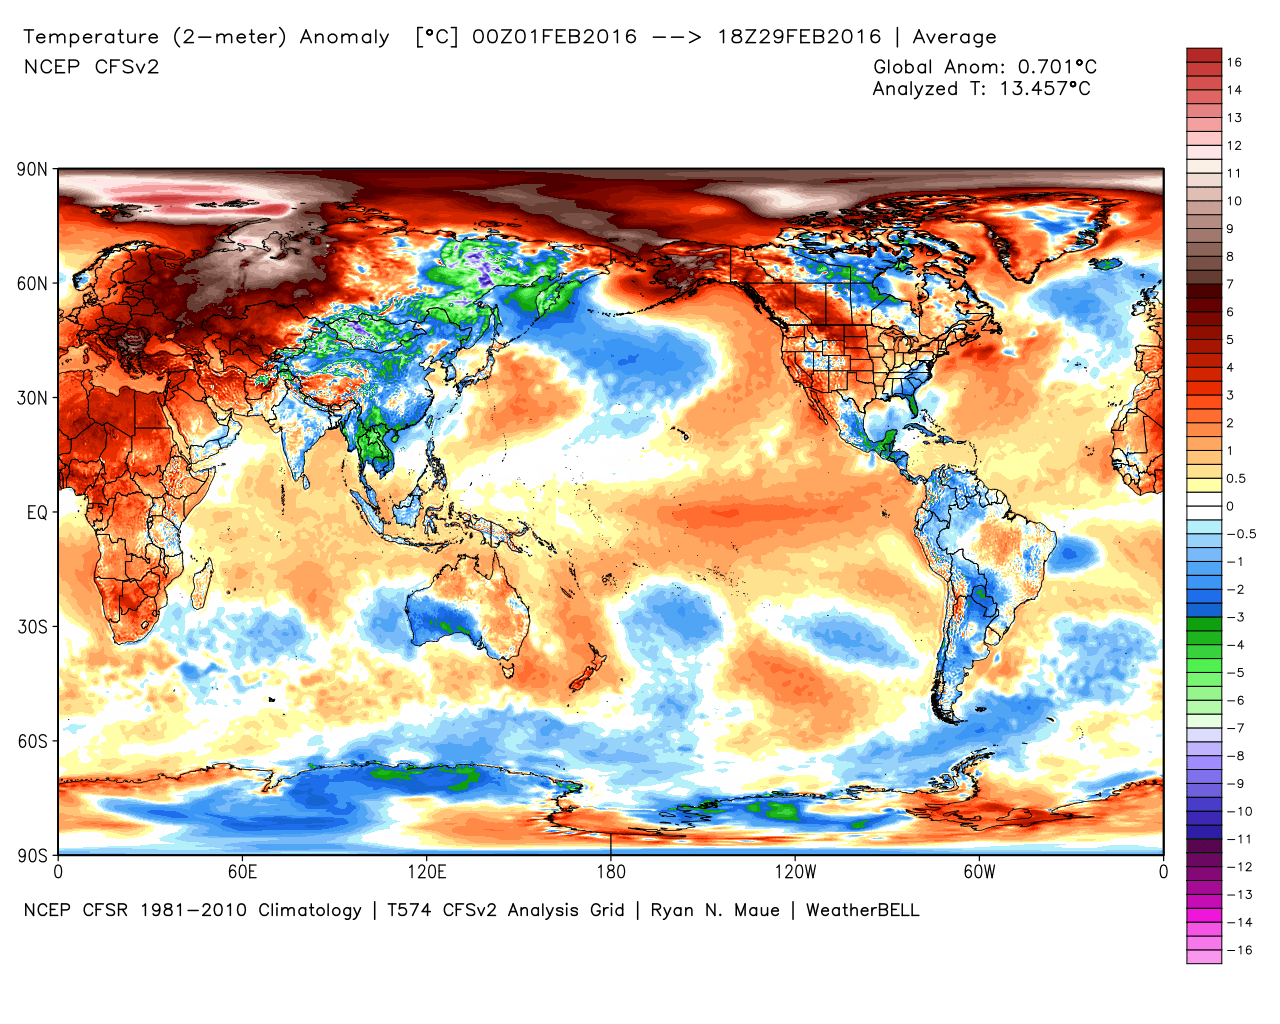
Temp. anomalies in February- image from Wx Bell.
NASA has released the February global temperature data, and the rumors that it would smash the record set just last month by an incredible margin are true. The global temp. was 1.35C above the average of 1951-1980. This passes last month’s record of 1.14C above that average. The overwhelming opinion of experts is that any rise above 2 degrees C will bring unexpected and serious consequences to our climate system.
MYTH BUSTING
This news is sure to incite the repetition of two popular myths and they are both easily shown to be wrong.
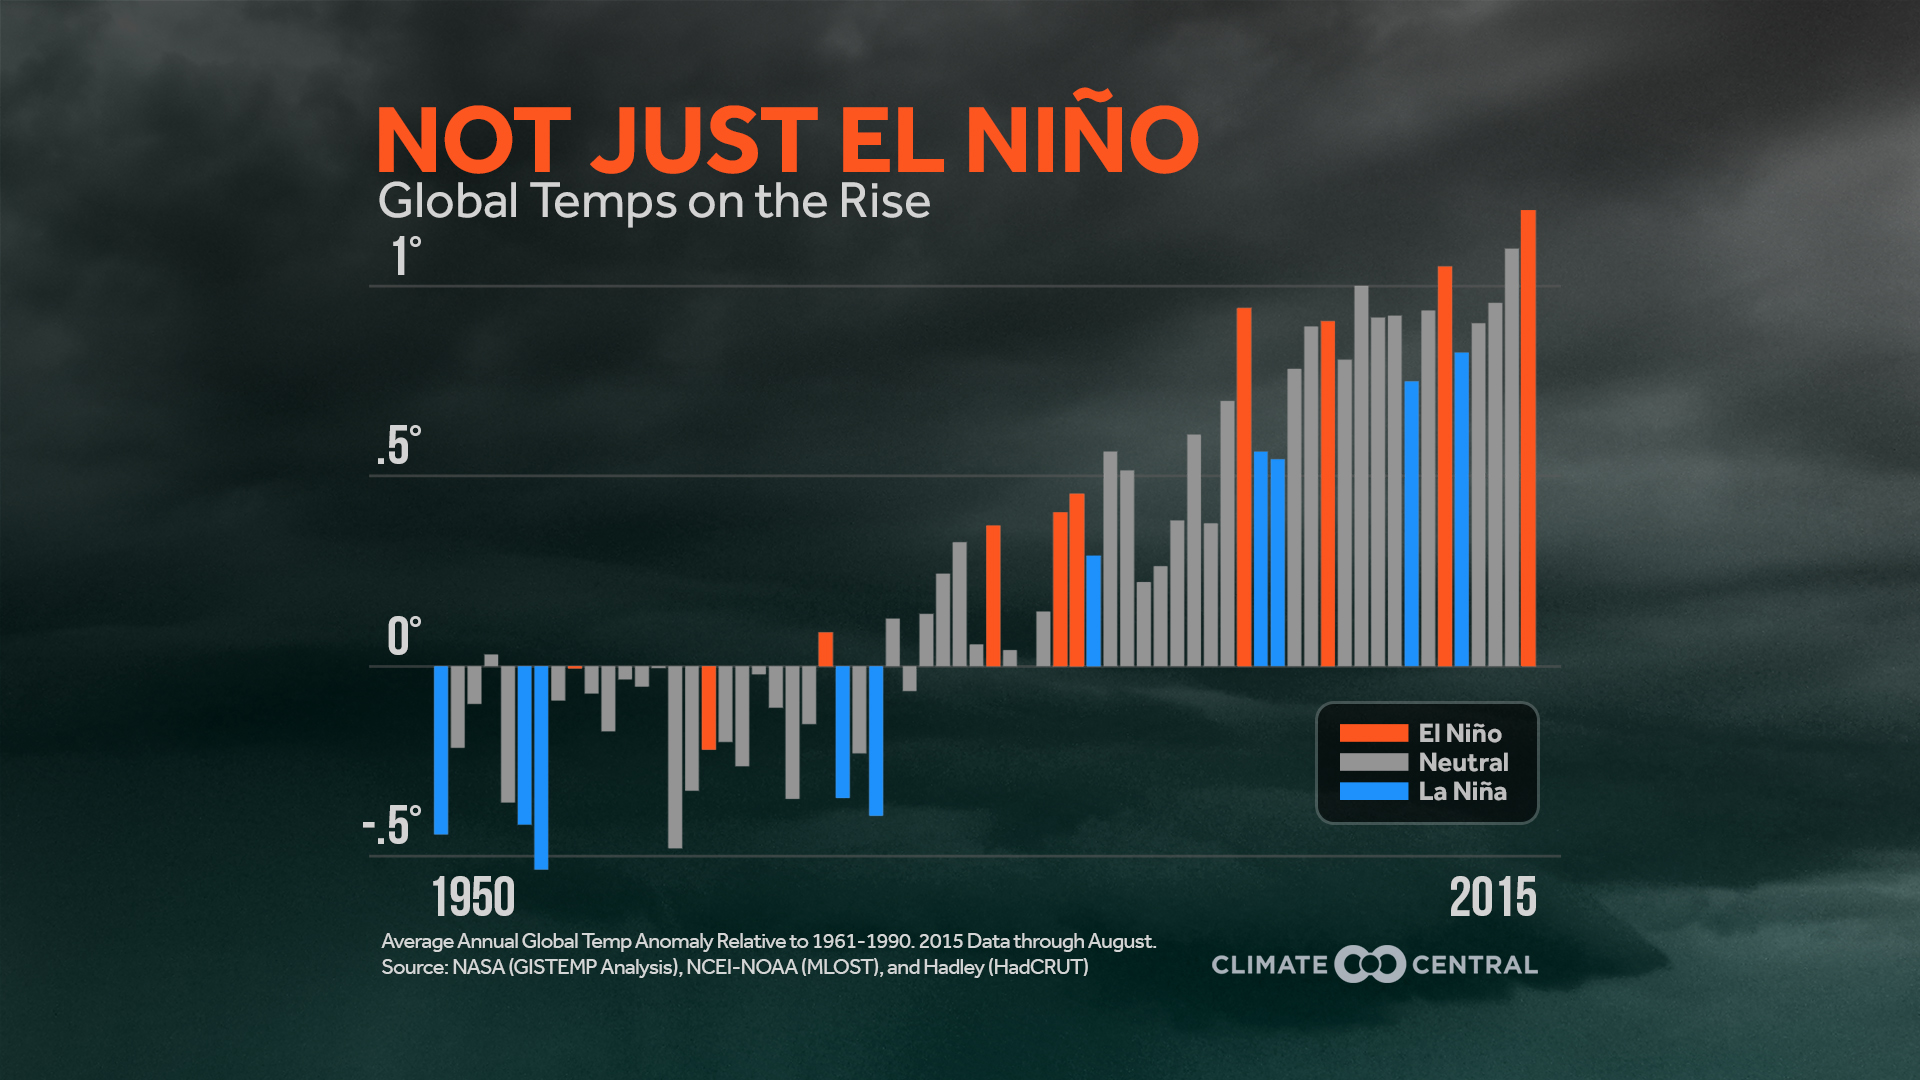 Myth one is that this is due to El Nino, and any myth that has a kernel of truth is a dangerous one, having a high potential of convincing people of something that’s not true. El Nino years are indeed hot years globally, and this past El Nino ranks near the top of the list for strong events. It would not have pushed our temperature up this far though, without the steadily rising greenhouse gases in the atmosphere.
The graph on the left (hat tip to Climate Central) shows the global temps with the El Nino years highlighted. You can see that they are indeed warmer and that they keep getting warmer. This is the greenhouse gases, and the El Nino events acting together. To say this was only El Nino, you’d have to prove that CO2 (and other greenhouse gases) do not trap heat, and since that science was settled when A. Lincoln was President, you’ll fail on that. It is understood now at a sub-atomic level. More on the physics behind this is here.
Wait for It:
By the way, we will soon get claims that the planet is cooling again, because next year will not be as hot as this one, especially if a La Nina develops. It will, nonetheless, still be among the hottest years on the temperature record, because of the greenhouse gas levels.
No It’s Not A Cycle
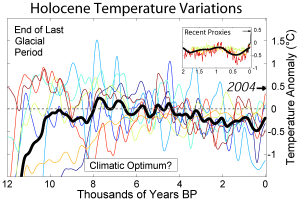
The warmest period after the ice ages until the last three decades was about 6-8,000 years ago. The climate then began to cool until the greenhouse gases reversed the trend. Wiki chart.
Myth Two: This is the claim that this record warmth is just a natural cycle. This is “the climate is always changing” claim that no one who understands the physics would make. For this claim to be true, then greenhouse gases cannot trap heat, and cannot be rising. They can and are, and there’s absolutely zero doubt about it scientifically. You can also run statistical tests to see what the probability is of seeing nearly all of the hottest years occur in the last 15 years. This could happen, just like it’s possible to get 40 heads in a row while tossing a coin. It’s just extremely unlikely. That statistical odds of this being a natural warming are several thousand to one up to a million to one, depending on how you look at it.
Bonus Myth
There’s always the myth of last resort for those who just cannot adjust their world-view, and this is “the satellites don’t show it” claim. Sorry, but February was the hottest month in the data from the microwave sounding unit data (for the lower troposphere). Keep in mind though that this data is indirectly measured (unlike thermometers) and many more assumptions are used to produce this data set than the corrected surface temp. data. This satellite data does show cooling in the stratosphere, which would not happen if this was a natural cycle, or if the surface warming was due to the sun. Only greenhouse gas rises should produce this effect, and it’s happening.The satellite data claim is a favorite of one presidential candidate, and my friends at Yale Climate and their exc. science journalists have a video that blows that claim out of the water:
Can you say OOPS…
How Science Works
NASA is not the only organization that produces a global temp. data set. Good science practice requires independent analyses of data, and when these agree, the likelihood that the truth is there is higher. NOAA, and The UK Met Office do the their own analyses and use slightly different methods(So does Japan’s Metr. Agency). They usually track within a few tenths of a degree though, and a group at UC Berkeley also did analyses a few years back. It was led by a well-regarded nuclear physicist who had expressed doubts in the accuracy of the record. That data showed more warming than NASA/NOAA, and he changed his mind, which is not surprising, because science is based on data and not political belief.
 Dan Satterfield has worked as an on air meteorologist for 32 years in Oklahoma, Florida and Alabama. Forecasting weather is Dan's job, but all of Earth Science is his passion. This journal is where Dan writes about things he has too little time for on air. Dan blogs about peer-reviewed Earth science for Junior High level audiences and up.
I suppose Dan is talking about Richard Muller from Berkeley Earth
http://berkeleyearth.org/summary-of-findings/
Here a video => Richard Muller: I Was Wrong on Climate Change – YouTube
https://www.youtube.com/watch?v=kTk8Dhr15Kw