2 June 2014
Here’s How Scientists Are Improving Warnings of Dangerous Weather
Posted by Dan Satterfield
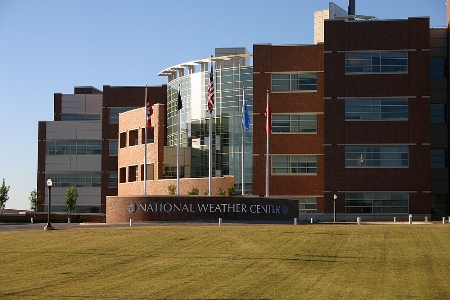
The National weather Center in Norman,OK.
Imagine a hot July weekend, and the beaches and or area lakes are packed with thousands of folks enjoying the sun, sand and water. While there is a chance of thunderstorms in the forecast, the skies are sunny, and the weather is the last thing on the minds of most people. It’s the first thing on the minds of weather forecasters, however, and if strong thunderstorms with deadly lightning are going to develop quickly, we want to know when, where and how strong they will be. I suspect those folks enjoying the great outdoors will want to know that as well and be warned about it with as much lead-time as possible.
Believe it or not, forecasters often have a better idea of what the weather will be doing tomorrow or two days from now, than what may be happening in 4 hours.
I won’t be standing in front of a camera this week, but I will be doing a lot of forecasting, because I’m participating in an experiment that the National Oceanic and Atmospheric Administration (NOAA) is conducting in Norman, OK. It’s all about improving short-term weather forecasts, and especially severe weather warnings. Short term forecast improvement is something that is atmospheric scientists are working very hard on right now, and we are making progress.
The experiment is part of the Hazardous Weather Test Bed which is located in the National Weather Center (the NWC is on the campus of my alma-mater the University of Oklahoma). The NWC also houses the National Severe Storms Laboratory and the Storm Prediction Center (SPC), which is responsible for issuing all of the tornado and severe thunderstorm watches in the U.S. It will be a busy week, but I’ve already learned a great deal in the training I’ve completed to prepare for the experiment.
The experiments at the test bed are a bridge between the latest science, and operational forecasting. New methods of observing the atmosphere are being developed that combine advances in numerical weather models, the Doppler radar network, and satellite imagery to give us a better understanding what the atmosphere is doing now, and what it will be doing a few hours from now. I am one of a select number of meteorologists who work in TV to be invited, and I’ll be working alongside of forecasters from the National Weather Service.
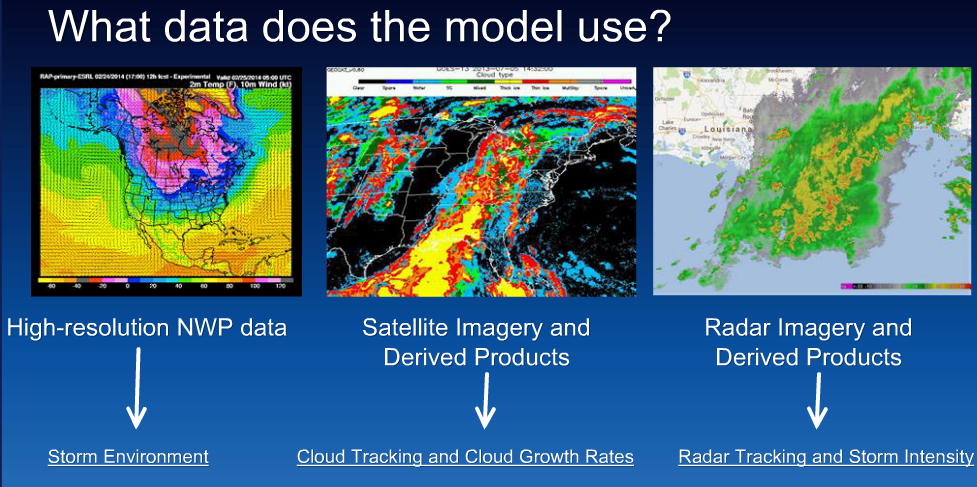 Just one of the things we will be evaluating is a model developed by meteorologists at the Univ. of Wisconsin at CIMMS and at the Univ. of Colorado (CIRA), that combines numerical weather prediction, satellite data and radar to assign a probability that a thunderstorm will produce severe weather. It seems to have great promise, and we will be looking to see how it does in the real world of severe weather nowcasting. The idea is to learn it;s strength and weaknesses and how it might be improved, and in addition how to use it in the normal work-flow during a forecasters shift.
So, this week, I will be doing my part to evaluate the latest techniques being developed to make better “now-casts” in hopes that all forecasters can do a better job of providing important weather information to the public. Many times this can be life-saving information as well. I’ll share some more pictures and video with you during the week!
 Dan Satterfield has worked as an on air meteorologist for 32 years in Oklahoma, Florida and Alabama. Forecasting weather is Dan's job, but all of Earth Science is his passion. This journal is where Dan writes about things he has too little time for on air. Dan blogs about peer-reviewed Earth science for Junior High level audiences and up.
The experiment appears to have a very high degree of difficulty. Last week I saw a singly cumulus cloud produce a deluge perhaps a quarter mile in diameter as it drifted along. Other times I’ve seen it raining on one side of the street but not the other. Following these transient pop-ups and trandmitting the information seems like a formidable job.
I’ve heard that the NWS can’t transmit information on lightening activity since it’s provided by a private company. That would be really useful information.
I have a Dark Sky weather app which purports to provide a 50 minute warning of light, medium and heavy ppt, current temperature and a blurry map of major storm systems over North America. It works pretty well but the drizzle warning has the sensitivity level set too high.
The Dark Sky app shows a variety of radar imagery that you can use to roughly time the approach of heavy stuff using the time-lapse function.
The technology does get better all the time.
The lightning data is proprietary but the NWS has several lightning mapping arrays (LMA) that detect ALL lightning and not just cloud to ground.Lightning data is available in real time though now to NWS forecasters and broadcasters and the most certainly can transmit information about it. The new GOES R satellite will have a very advanced lightning sensor, and we are evaluating the usefulness of this already in several product algorithms that use the LMA’s now. I’ll write more about the different products we are looking at in future posts. Lightning combined with forecasts of updraft helicity may be very valuable in the short term forecasts of supercells.
Small cumulus towers that precip over a small area are not really the subject of what we are doing. Rain falling from a small cumulonimbus has to have a boundary somewhere. Whether that cell will grow into a dangerous supercell is more what we are trying to forecast using a combination of radar data/complex numerical modelling that shows forecasters where wind/instability boundaries are located, along with satellite data in multiple visible and IR Channels.