13 February 2014
Wild Weather and Forecast Uncertainty
Posted by Dan Satterfield
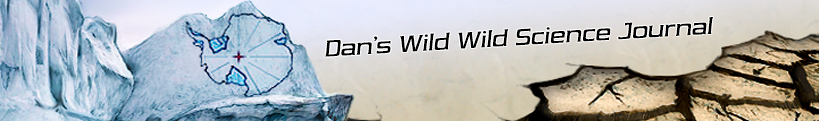
Meteosat Image from Dundee Univ. of the storm that brought 108 mph winds to the UK Wednesday.
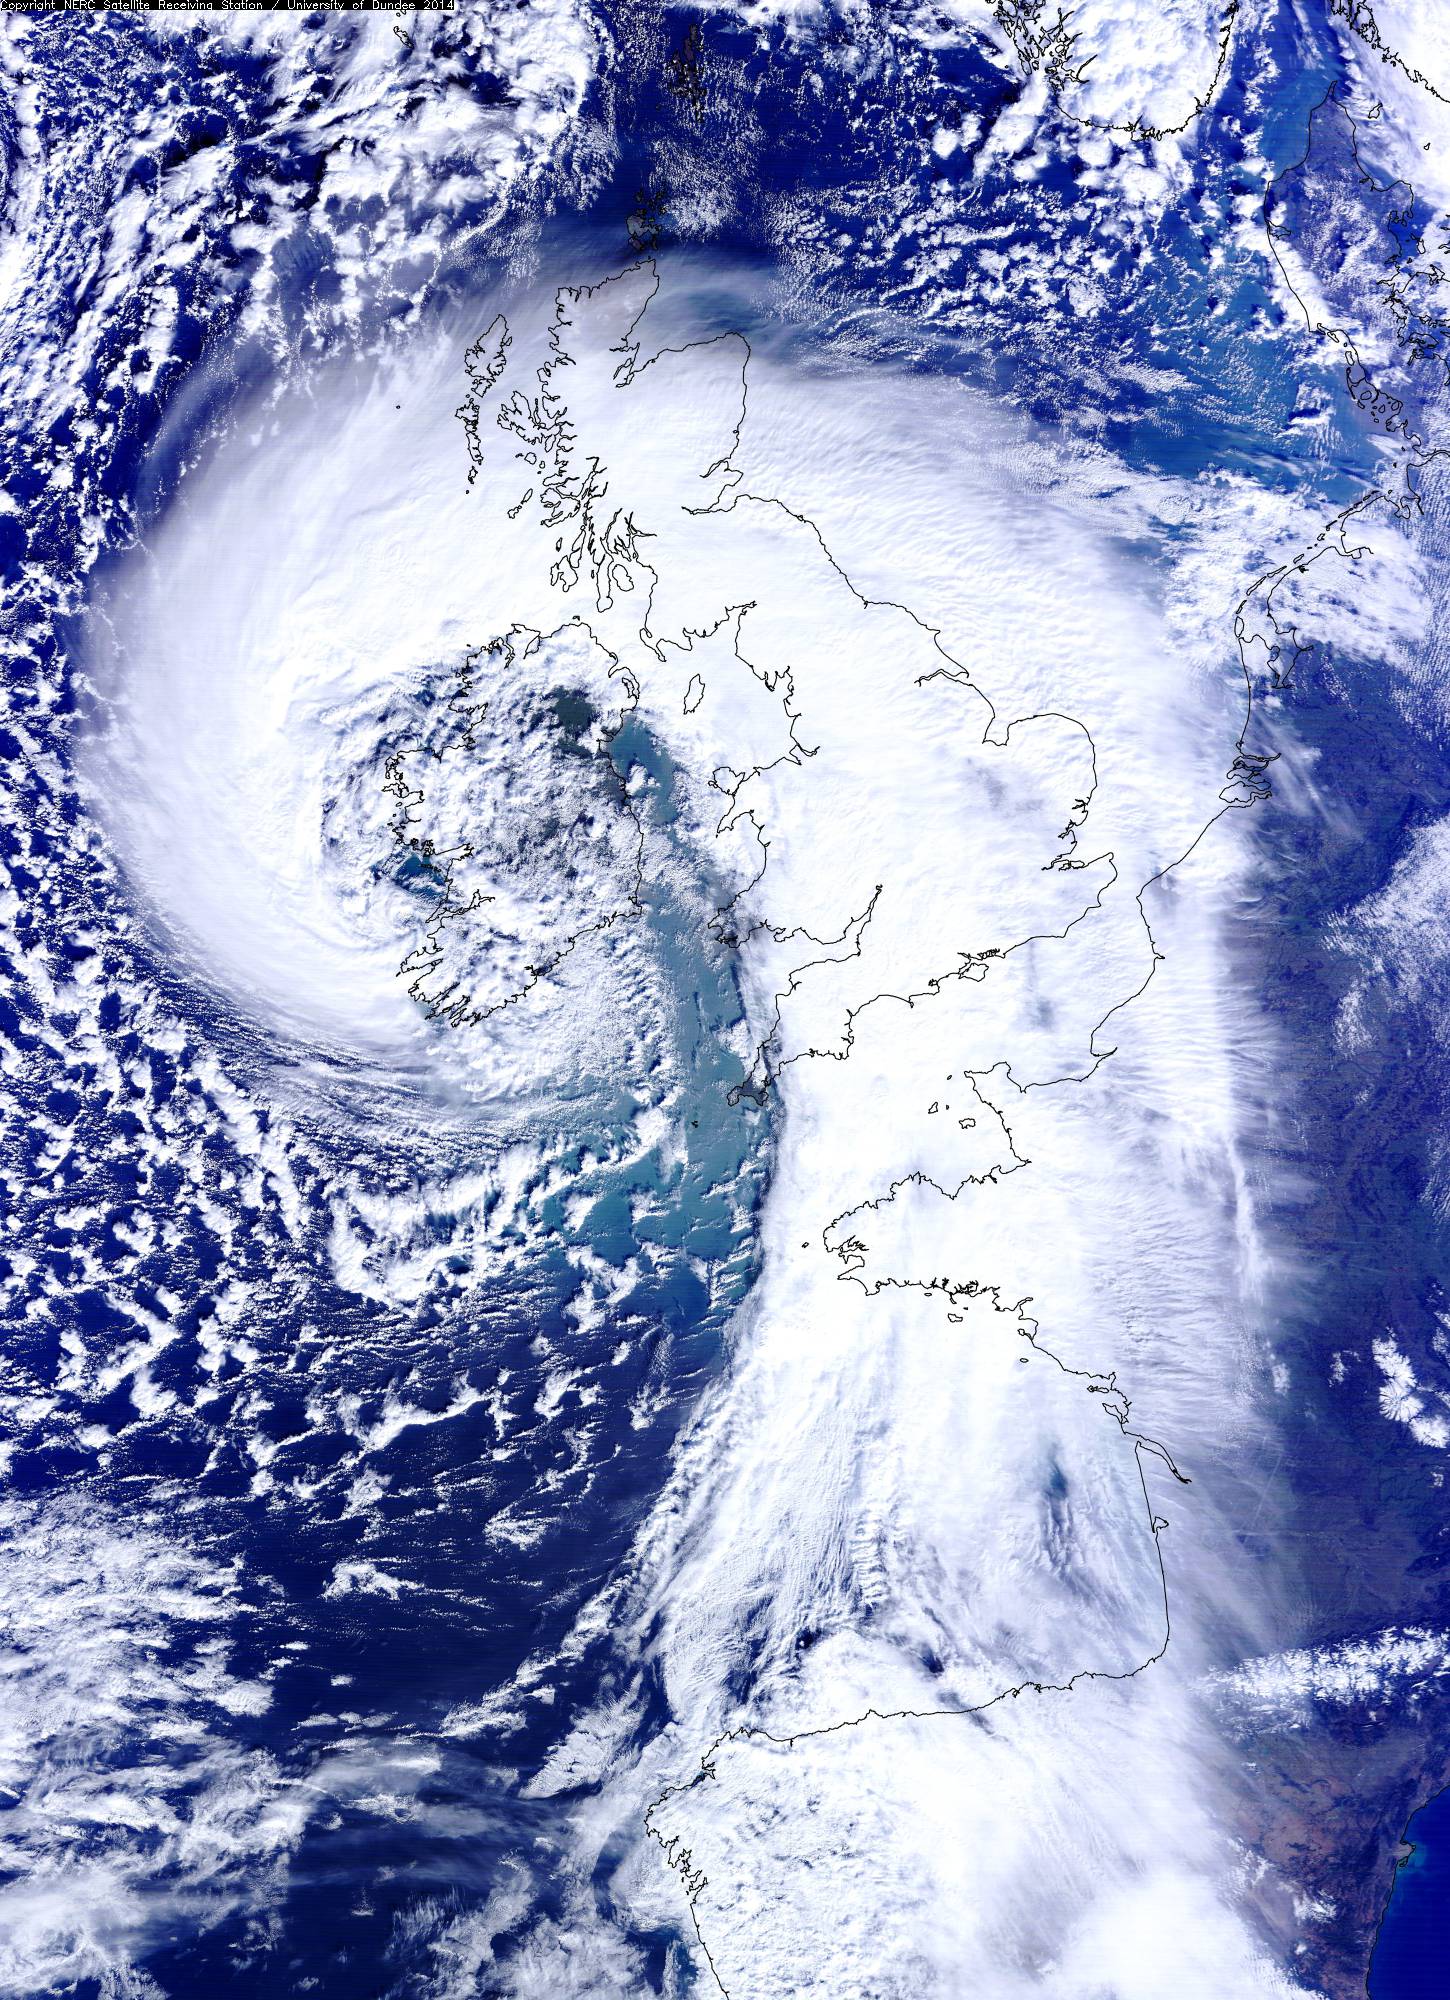
Another BIG storm will hit the UK Friday night. It could be as bad or worse than the last one! (ECM Model from Penn State Metr.)
The flooding in the UK is the worst on record in many areas, and the SW mainline rail to Cornwall has washed away. This being just the latest in a series of powerful storms that have blasted the UK and Ireland since early January. Some areas had a months worth of rain last night alone, and some areas had two months worth of rain in two days. The BBC has more on it here.
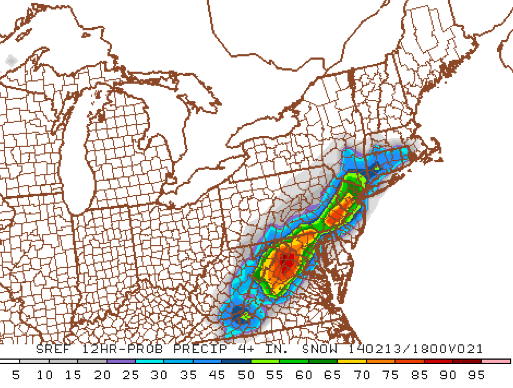
If you are wondering if these storms are connected to the cold and stormy weather over the Eastern U.S. then wonder no more, they are indeed. We’ve had two months of near record level jet stream winds across the Atlantic, and of course a powerful nor’easter is spreading heavy snow up the Eastern Seaboard as I type. Heavy snow has fallen from Alabama to Virginia, and up to 22 inches will fall from North Carolina to Maine before it is through. The Eastern U.S. Nor’easter will produce a heavy wet snow and widespread power outages are very possible. Actually, they are already happening from Alabama to North Carolina, and here in Maryland, rare thunder-snow was reported in Cambridge and Easton (on the Delmarva Peninsula).
More Coming!
There may be another fast-moving storm on Friday night in the Mid-Atlantic that brings even more snow, followed by frigid air and strong northwest winds for the weekend. The UK will get hit on Friday night with a storm that may be worse than the one that is just leaving, and Japan had the biggest snow in over 50 years this week as well! In Australia, Adelaide broke a 117 year old record with a high of 41.5° C Wednesday. It was the 13th day of the summer with a high above 40°C (104°F). In Alaska a high temp. of 61 degrees was reported in January, and this is a good example of how weather is just the planet’s thermostat in action. Powerful storms move cold air south and take warm air high into the Arctic, and if this did not happen, the poles would get colder and colder, and the tropics would melt.
Snow Forecasting Done Right
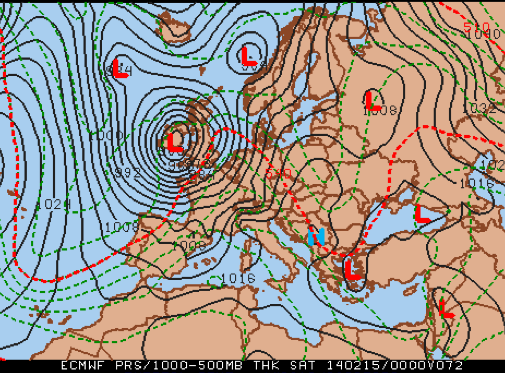
Forecasting snow amounts is very difficult in the best of cases but when you have a storm running offshore, the amount of warm ocean air that comes inland can play havoc with snowfall forecasts. A 50 mile drive can take you from no snow to 6-7 inches and a 100 mile drive will take you from nine to a foot. The NWS in Philadelphia did an interesting study of their snowfall forecasts. The bar graphs are below:
If the forecast is for 3 inches, you have a 60% chance of seeing at least 2″. From NWS Philadelphia
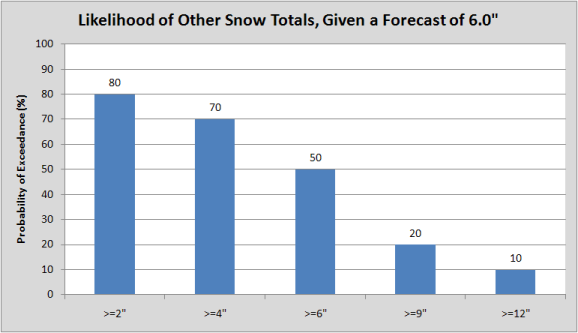
From NWS Philadelphia
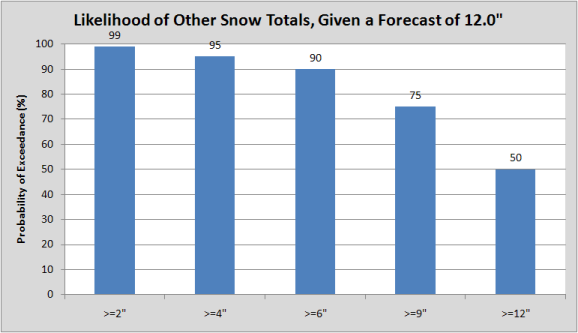
NWS Philadelphia (NOAA)
Using an average of many numerical model runs to estimate the probability of a certain amount of snow, has greatly improved snow forecasts. We need to share this data with the public more often. The NWS office in Philadelphia did just that.
These graphs are really great information to the public and kudos to the forecasters who took the time to gather the data and then put it on the NWS Philadelphia web site. Anytime I make a snow forecast, no matter how accurate it may be, I’ll have complaints, that “you blew the forecast”. That’s part of the job, and most of the time the person complaining only heard what they wanted to hear. It’s also very common to get blamed for another stations or an online amateurs wild forecast as well.
Conveying Forecast Uncertainty To The Public
The NWS graphics give valuable information to the end-user on what to expect based on a forecast of x number of inches. These graphics are only valid for Philadelphia and I suspect they would not at all be applicable in the deep south where snow is rare. Still, when the Philly NWS office forecasts a foot of snow, 90% of the time there was 6 inches or more! 50% of the time there was over 12 inches. I’ll let you study the other charts but I think this is the kind of useful information that conveys forecast uncertainty very well, and would be very useful to local and city governments.
All college level physics courses impress on students that a scientific measurement is worthless unless the uncertainty is included, and that is just what NWS Philly did here. We forecasters need to explore more methods of conveying the uncertainty in a forecast to the public. My adviser at Oklahoma University gave me some advice when I started working in TV (34 years ago this month): “Tell them what you know, and don’t tel them what you don’t know”. The NWS did a good jo of telling the public just what they knew about the storm and their forecast.
 Dan Satterfield has worked as an on air meteorologist for 32 years in Oklahoma, Florida and Alabama. Forecasting weather is Dan's job, but all of Earth Science is his passion. This journal is where Dan writes about things he has too little time for on air. Dan blogs about peer-reviewed Earth science for Junior High level audiences and up.