19 October 2010
NOAA- Every Decade Warmer Than One Before
Posted by Dan Satterfield
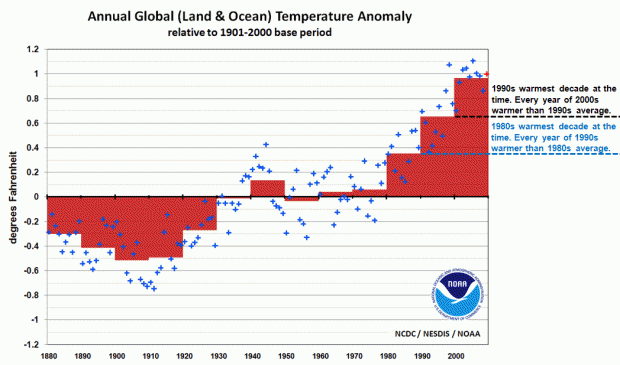
I was on a conference call with some climate experts yesterday when someone mentioned this graph from NOAA. Every decade from the 1950’s through 2000-2010 was warmer than the decade before it.
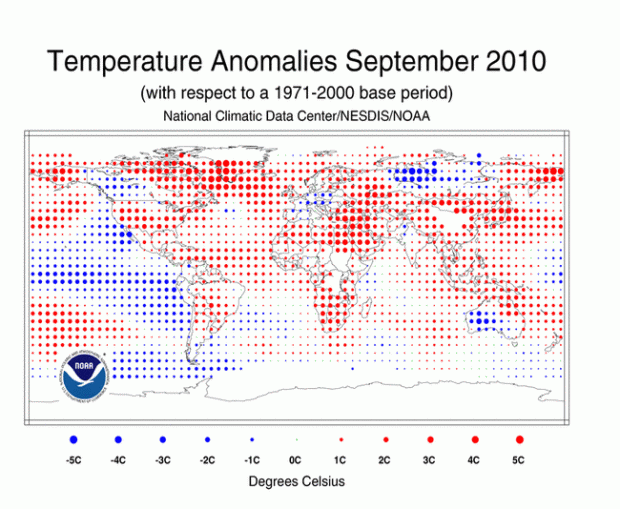
NOAA also has released the September temperature anomalies. Even with the strong La Nina of cool waters in the Pacific, it was the 8th warmest on record. January through September is now tied for the warmest year on record as well.

Red dots are warmer than normal and blue dots are cooler than normal. The string of blue in the Pacific is the strong La Nina developing.
If someone tells you this is being caused by the sun, you can reply that the sun has been unusually quiet this year. It only recently began to get active as the next solar cycle starts.
The graph of the decadal temperatures smooths out the natural cycles like El Nino and the Pacific Decadal Oscillation. It also smooths out the slight rise and fall in the global temperatures from the solar cycle.
Oh, there is this:
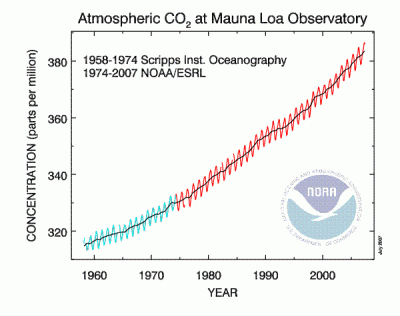
 It’s called the Keeling Curve in honor of Charles Keeling who started the carbon dioxide measurements at Mauna Loa. The reason 97.5%* of climate scientists are sure the planet is warming, and that it’s the greenhouse gases that are doing it is simply this.
Every other realistic possibility has been ruled out. Yes, there are natural cycles but the greenhouse gases will warm the Earth no matter
As Neil DeGrasse Tyson says: The laws of physics are real. Everything else is just politics.
* That number is based on peer reviewed science


 Dan Satterfield has worked as an on air meteorologist for 32 years in Oklahoma, Florida and Alabama. Forecasting weather is Dan's job, but all of Earth Science is his passion. This journal is where Dan writes about things he has too little time for on air. Dan blogs about peer-reviewed Earth science for Junior High level audiences and up.