
24 September 2009
Are The Southeast USA Floods Climate Change Related??
Posted by Dan Satterfield
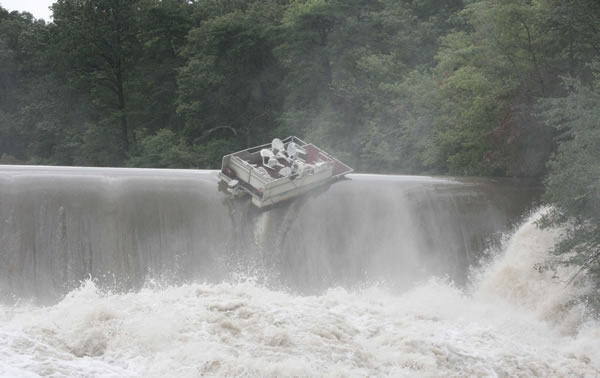
A Boat goes over Desoto Falls in Dekalb County Alabama. Sent to the station website by Cynthia Stinson a professional photographer.
Usually when I am asked a question about whether a weather event was caused by climate change, I respond with the standard answer of “You cannot blame any individual event on climate change, you can only say whether climate change made it more likely to occur.” I see Hurricane Katrina blamed on Climate change frequently and the same applies.
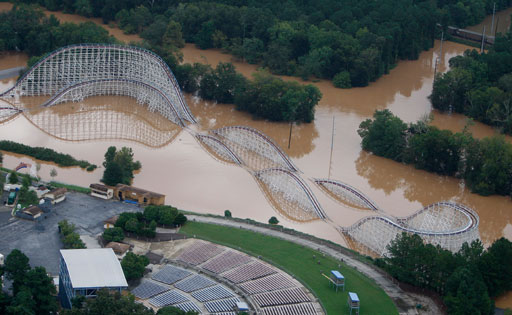
Six Flags Under Water- from CBS/AP
That said, what about the incredible flooding rains over the Southeast United States the past two weeks? Atlanta had a foot of rain in the metro area over the last weekend. Here in the Tennessee Valley, large areas have had over 10 inches of rain in the past 10 days. Flooding this time of year is very rare except from a tropical system coming up from the Gulf.
Was this pattern boosted by climate change?
You can make a decent case for an answer of YES.
First of all let’s talk about the direct cause of the flooding. You can blame that on a very unusual pattern for September that developed three weeks ago. While you see surface maps with fronts on TV weathercasts, meteorologists spend much of their time looking at the wind patterns much higher in the atmosphere.
Instead of looking at a certain height, we tend to look at maps that show the winds at a certain pressure level. For example, as you climb higher, the pressure decreases. Near the surface, the pressure is usually around 1000 millibars, or 100 hectopascals for those of you in countries that use that term. They are interchangeable. At around 5,600 meters above the ground you reach a pressure of 500 millibars. Half the atmosphere is below you. This is a good place to track weather systems, for reasons that are a bit too detailed for this blog. If you are real geeky, look up the “level of non divergence“.
Take a look at the 500 millibar image from this past week below. Notice the strong high pressure aloft over SW Canada with a big low stuck beneath it over Western Kansas. This is called a cutoff low, because it’s cutoff from the main atmospheric flow pattern. These cutoffs will usually move little and last for a long while. Up to a month is possible. Forecaster slang for this High and low combination is to call it a “block”. When they develop they block the flow, and the flow in the atmosphere goes around it.
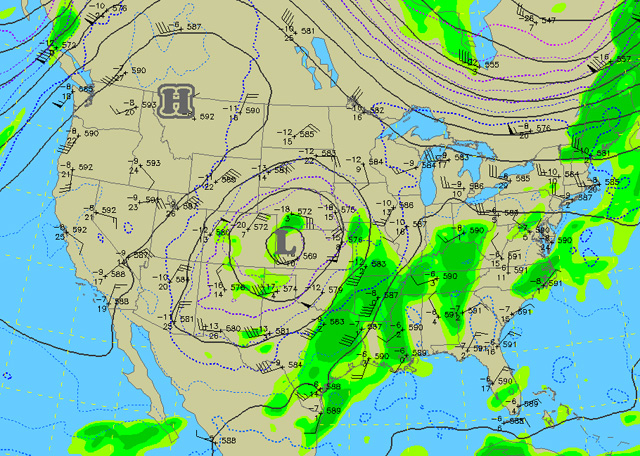
500 MILLIBAR FLOW courtesy NCAR.
In Idaho this evening, the weather balloons had to climb to 5,930 meters to reach the 500 millibar level. The warmer the atmosphere, the more the pressure levels spread out, so this indicates a large dome of hot air aloft over the Pacific Northwest. Let me just say that a 593 decameter height extending into Canada in late September is nearly unheard of!
My friend Stu Ostro, a Meteorologist at the Weather Channel in Atlanta has been following this pattern closely and is researching just how unusual it is. It may turn out to unprecedented in 30 years of data, or longer. Stu has been noticing what he believes is a growing frequency of these blocks, and hypothesizes they may be an atmospheric response to the warming troposphere. You can see his on air piece about this weird pattern here.
Without doubt, we have warmed over the past 30 years, and it would not make sense to see that manifest itself in surface temps. alone.
Now let me throw in a little fact that you may not know. If the air warms by one degree celsius, it can hold 7% more water vapor. That is a huge increase when you get up to temps. near 30C.
Now the main reason for the flooding rains over the south is this pattern you see on the chart above. The Low over Kansas is steering moisture up from the Gulf of Mexico into the Southeast. The developing El Nino n the Pacific also may very well be affecting this area, because heavy rains in the southeast are a common occurrence with El Nino’s. However, this is usually seen more in the winter and not early autumn.
Now, let me show you another image. The image below is showing just how warm the oceans are around the globe right now. The Oceans in August were the warmest ever recorded in 130 years of records! That warm ocean water heats the air above it and evaporates into it. (Remember the 7% increase per degree.)
August Temp. Anomalies. from NCDC (NOAA). The larger the red dot, the warmer it was above average.
The ocean waters in August were especially warm over the Eastern Pacific and this wind flow pattern is bringing that moisture into the Southeast USA.
June through August temperatures worldwide were the 3rd warmest on record as well. This means the atmosphere can hold more water vapor.
Last, but not least, let’s look at how some recent research supports the possibility of a climate related link.
You may remember back in the early summer when the U.S. Global Change report was released. This report marked years of research into the affects of climate change over different regions of the world. Until this report, most imapacts could only be talked about in global terms.
Climate experts developed new techniques to downscale the global models to estimate how day to day and seasonal weather would change in different regions. I wrote a post about it a few months ago called Climate Change in Your Backyard.
Take a look at one of the images from this report.
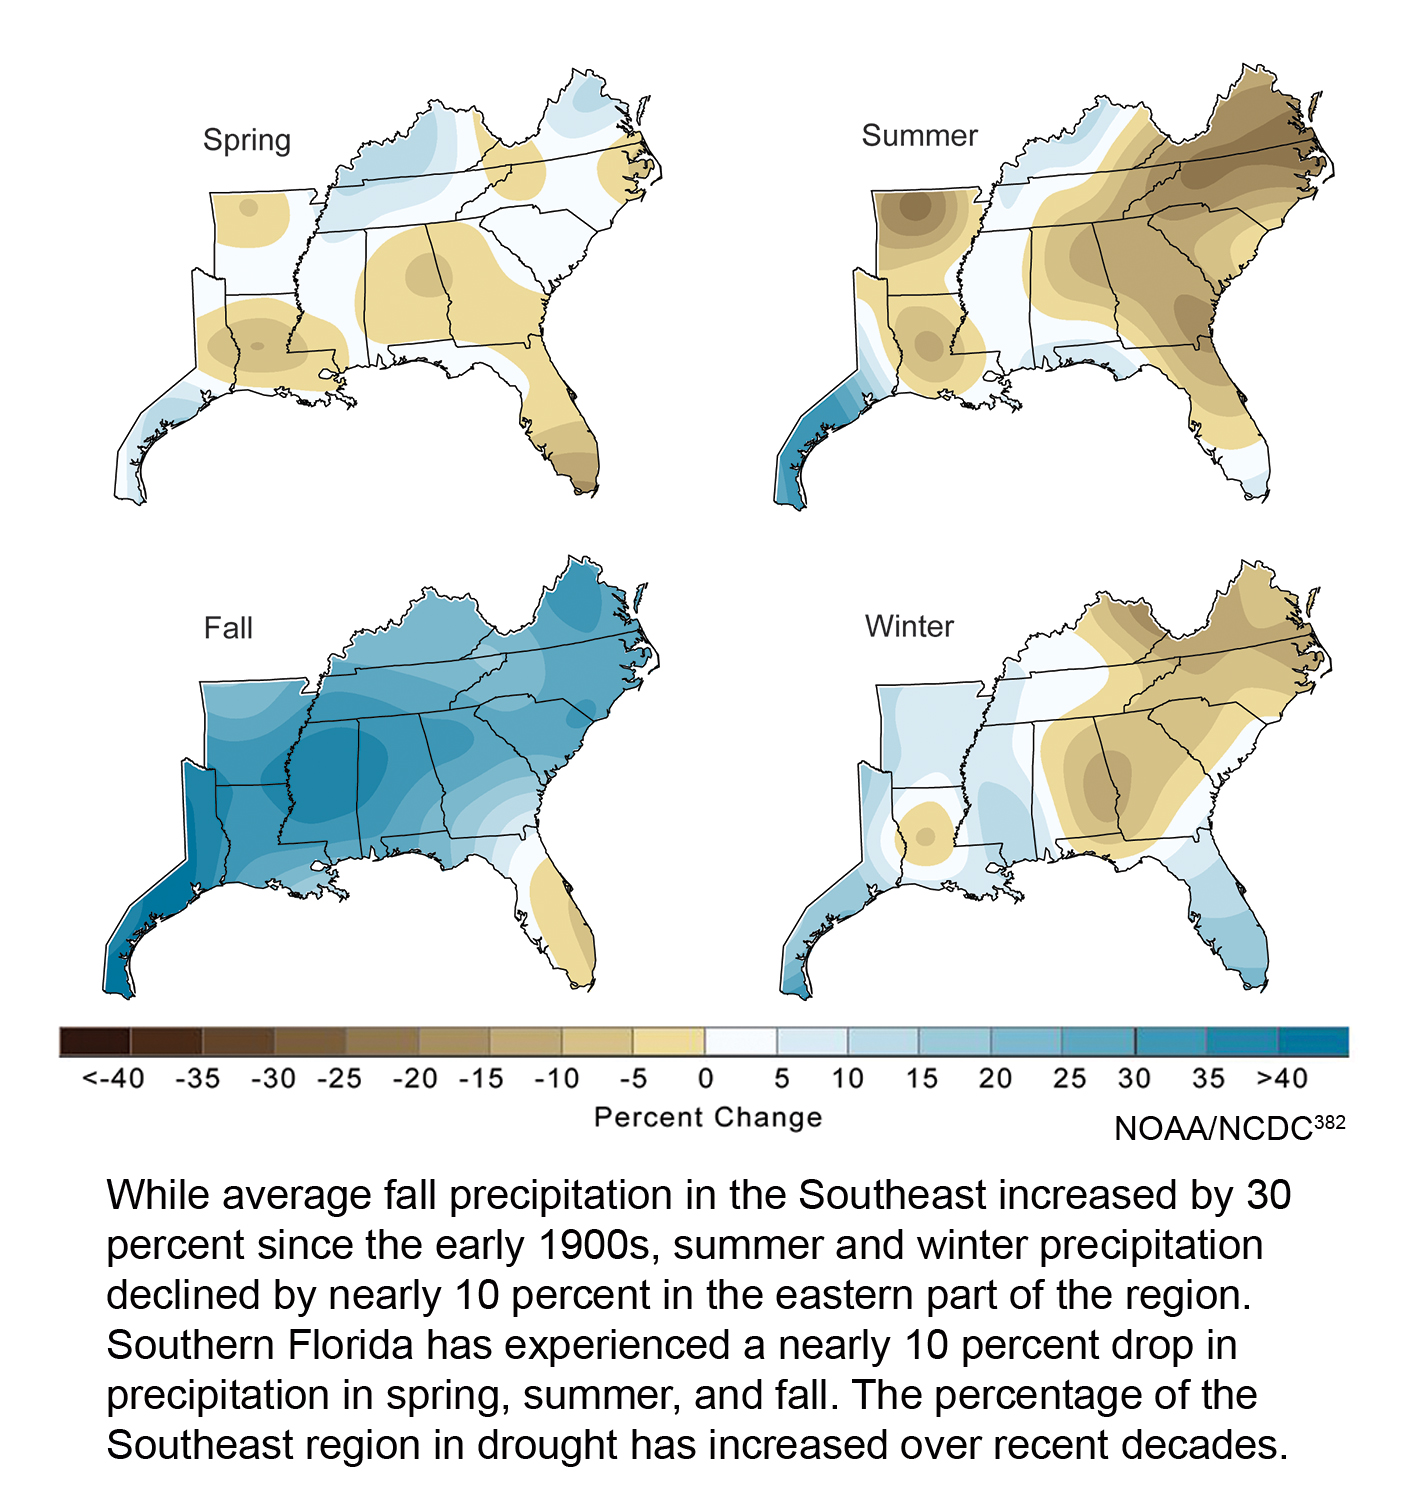 Autumn rain has increased markedly over the southeast over the last century. At the same time the global temperature has risen .7C. Here are some quotes from the U.S.Global change report:
“Floods and droughts are likely to become more common and more intense as
regional and seasonal precipitation patterns change, and rainfall becomes more
concentrated into heavy events (with longer, hotter dry periods in between).”
(Global Climate Change Impacts, page 44)
“One of the clearest precipitation trends in the United States is the increasing
frequency and intensity of heavy downpours. This increase was responsible for
most of the observed increase in overall precipitation during the last 50 years.”
(Global Climate Change Impacts, page 32)
So there you have it. Did climate change cause the flooding rains in the American Southeast? No.
Did it make it more likely to happen and contribute extra rainfall? Very possibly yes.
 Dan Satterfield has worked as an on air meteorologist for 32 years in Oklahoma, Florida and Alabama. Forecasting weather is Dan's job, but all of Earth Science is his passion. This journal is where Dan writes about things he has too little time for on air. Dan blogs about peer-reviewed Earth science for Junior High level audiences and up.
Hi there, I spotted your blog using Yahoo and google while looking for Weather Balloons and your post caught my ınterest .