1 October 2021
#AntarcticLog: Visualizing climate change
Posted by Shane Hanlon
#AntarcticLog is a series of comics by Karen Romano Young. You can find the originals here.
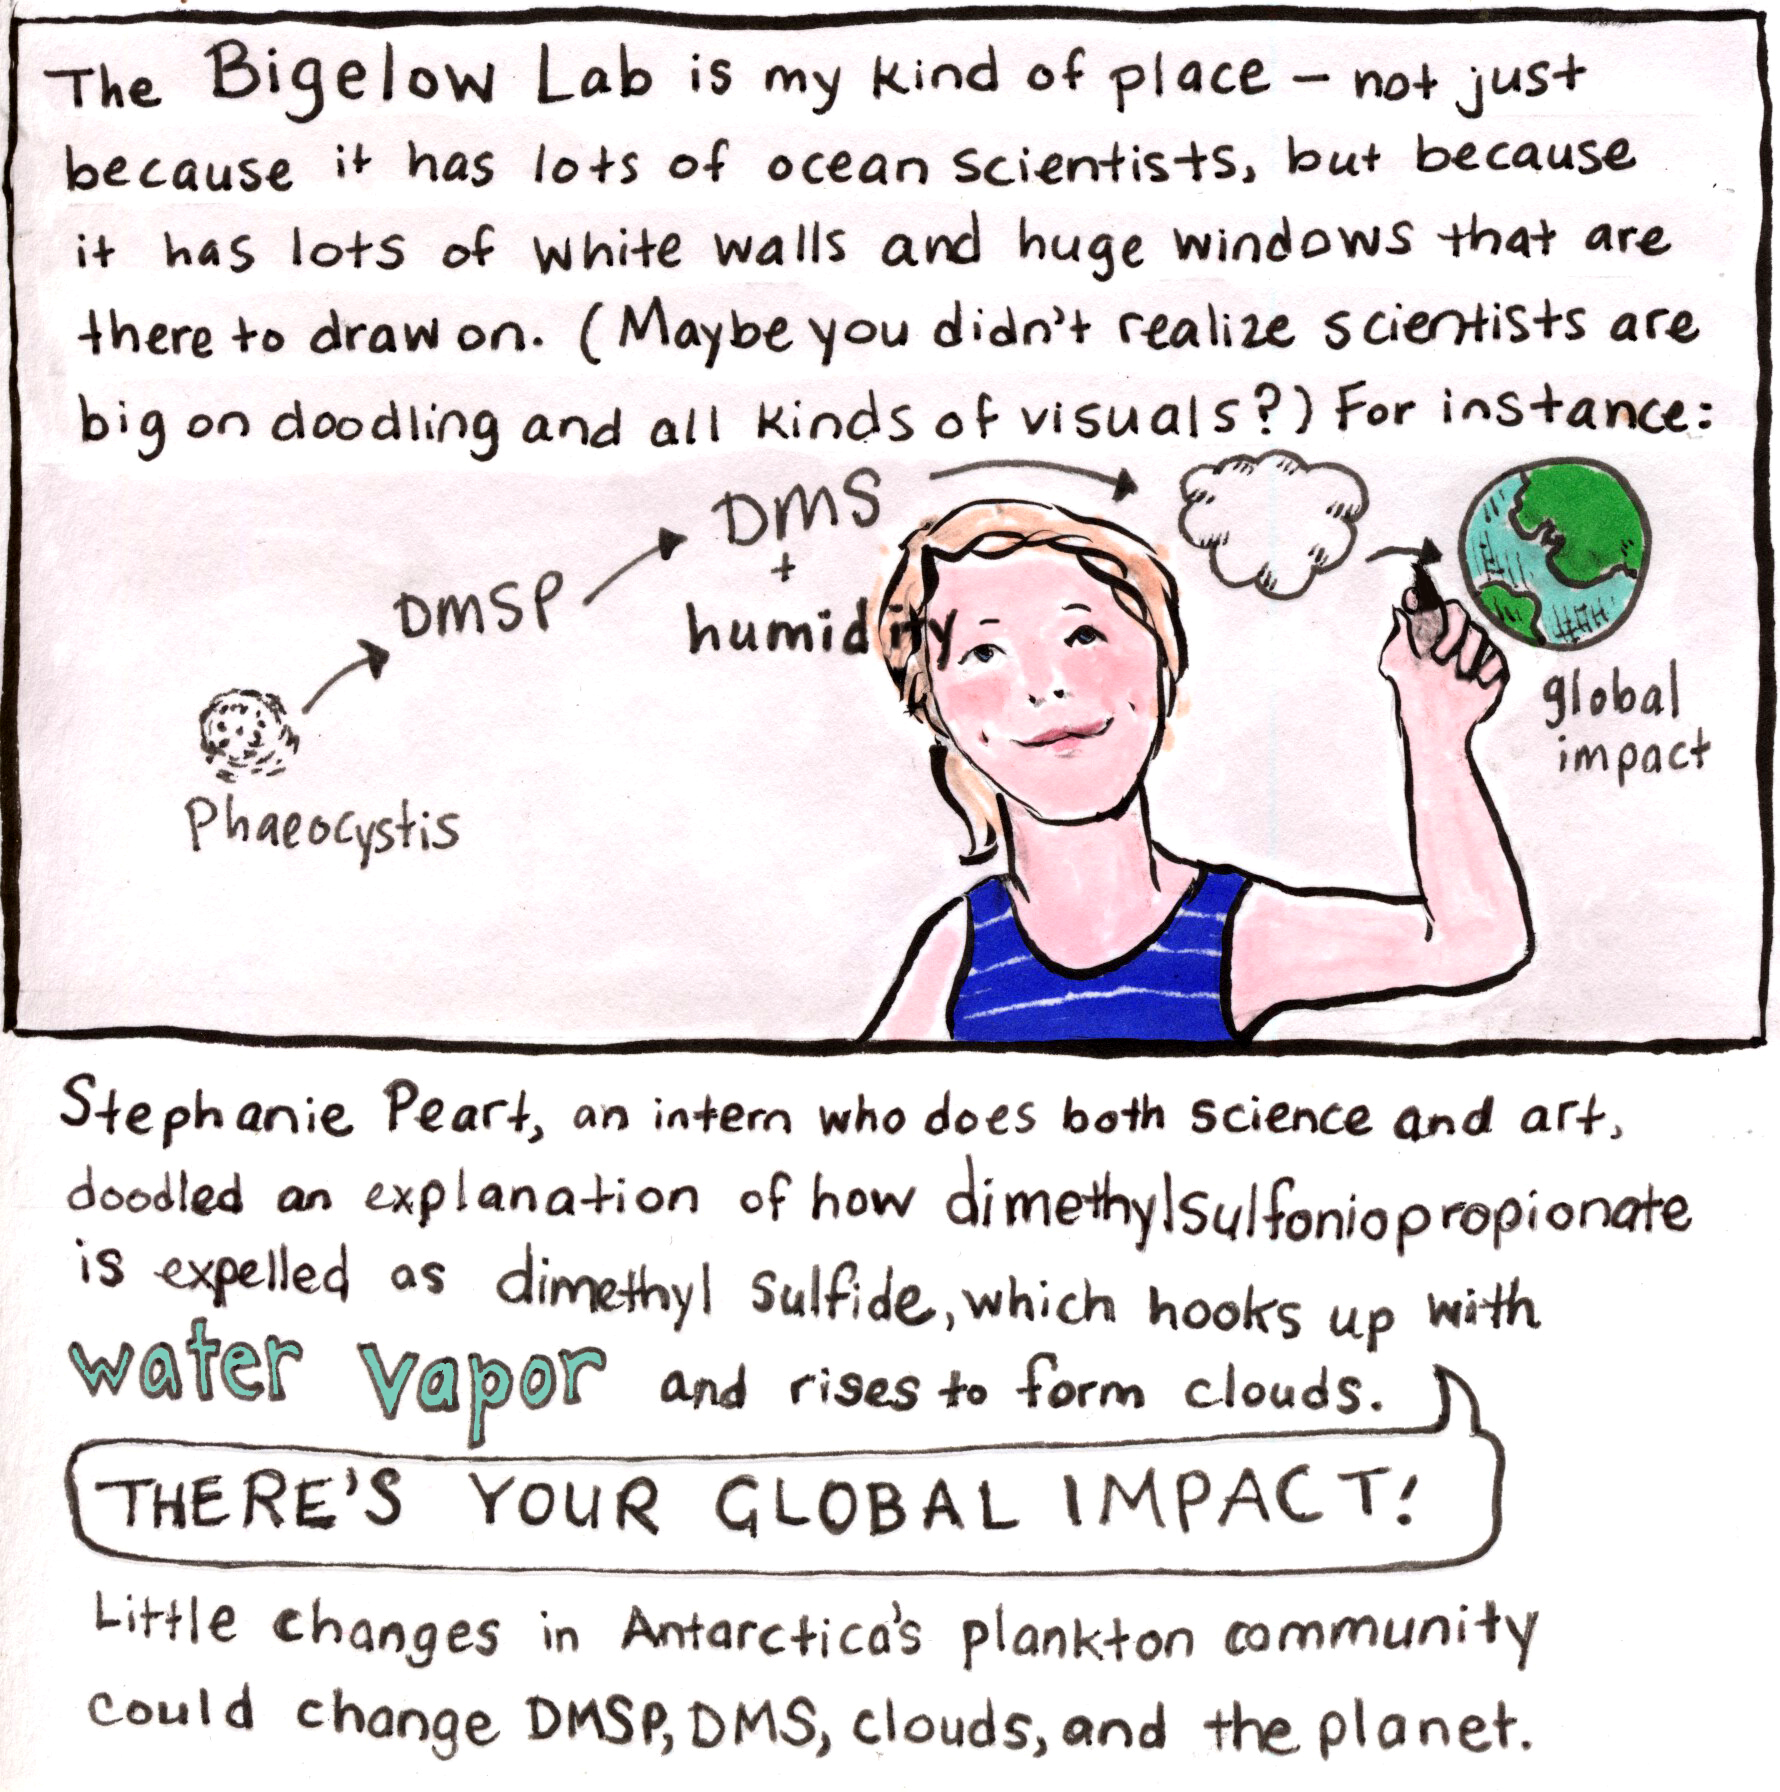
At the Bigelow Laboratory in East Boothbay, Maine, the walls are made of glass. It facilitates communication, not just because it’s transparent, but because it gives the scientists something to draw on. Did you realize that scientists are dedicated doodlers? They embrace visual imagery to convey their processes and their findings. Case in point: Stephanie Peart’s demonstration of cloud formation, in this #AntarcticLog comic:
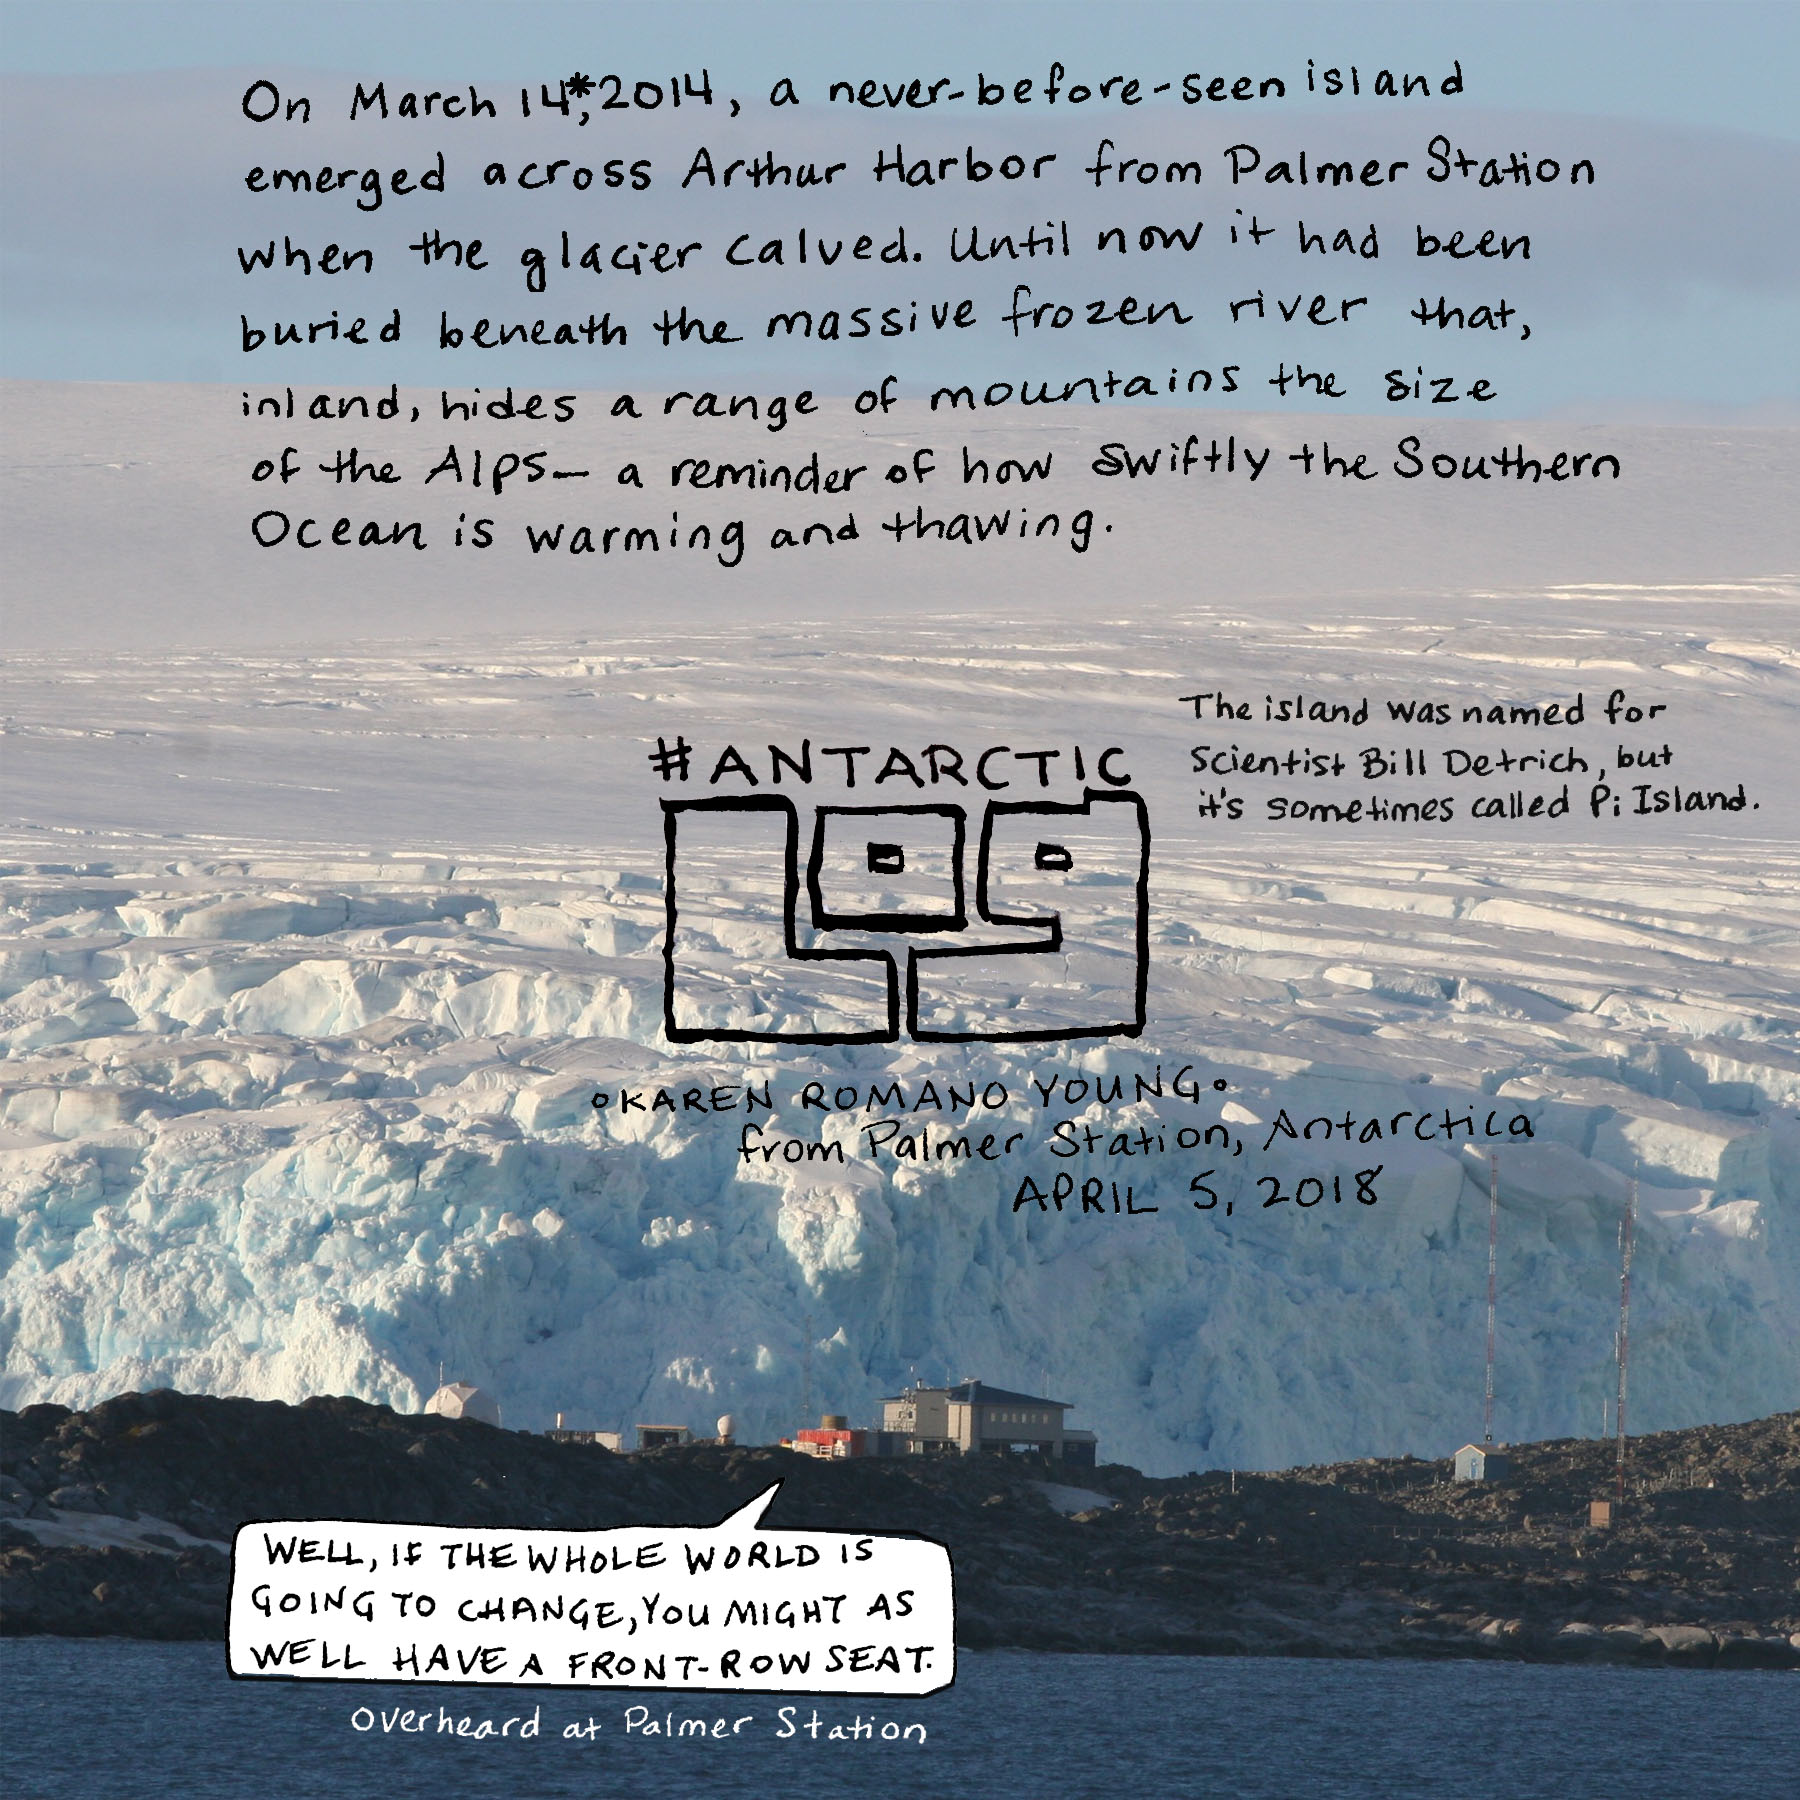
Stephanie was helping prepare me to take my pen, pads, and artist’s brain to Palmer Station, Antarctica, along with her research team, led by Dr. Peter Countway. Here’s my first view of Palmer, from sea. What better portrayal of the potential impact of global warming on the frozen continent than this photo, which shows the Marr Piedmont — just the foothills of the glacier — looming behind the bare ground left by the receding ice.
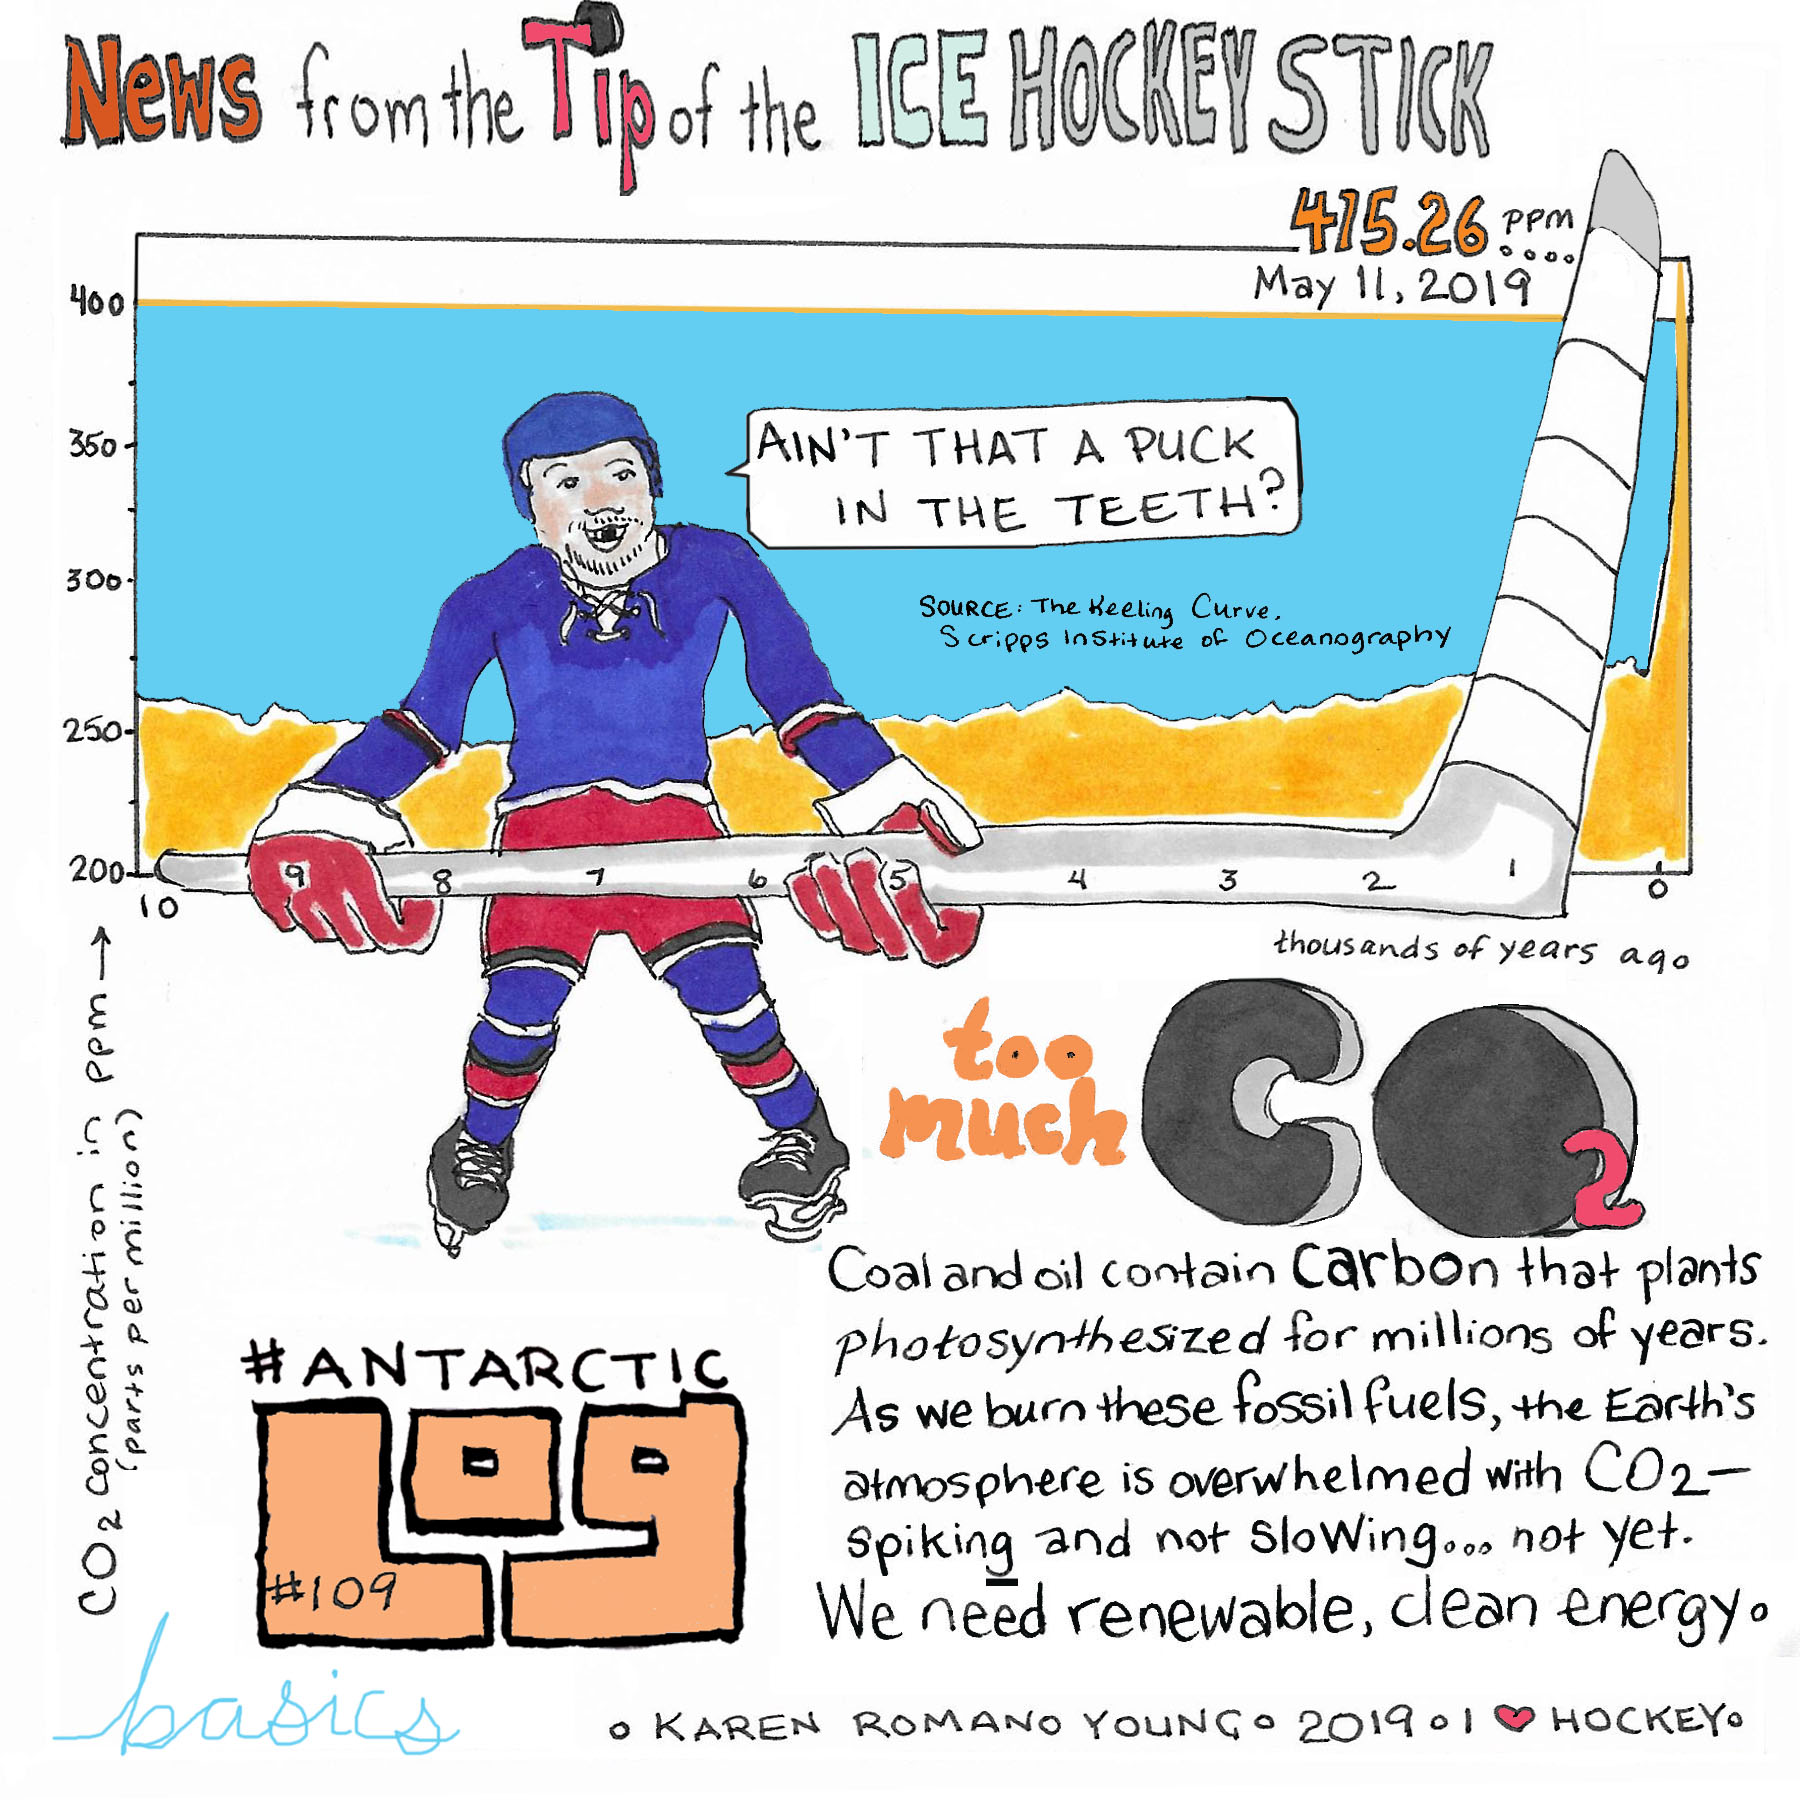
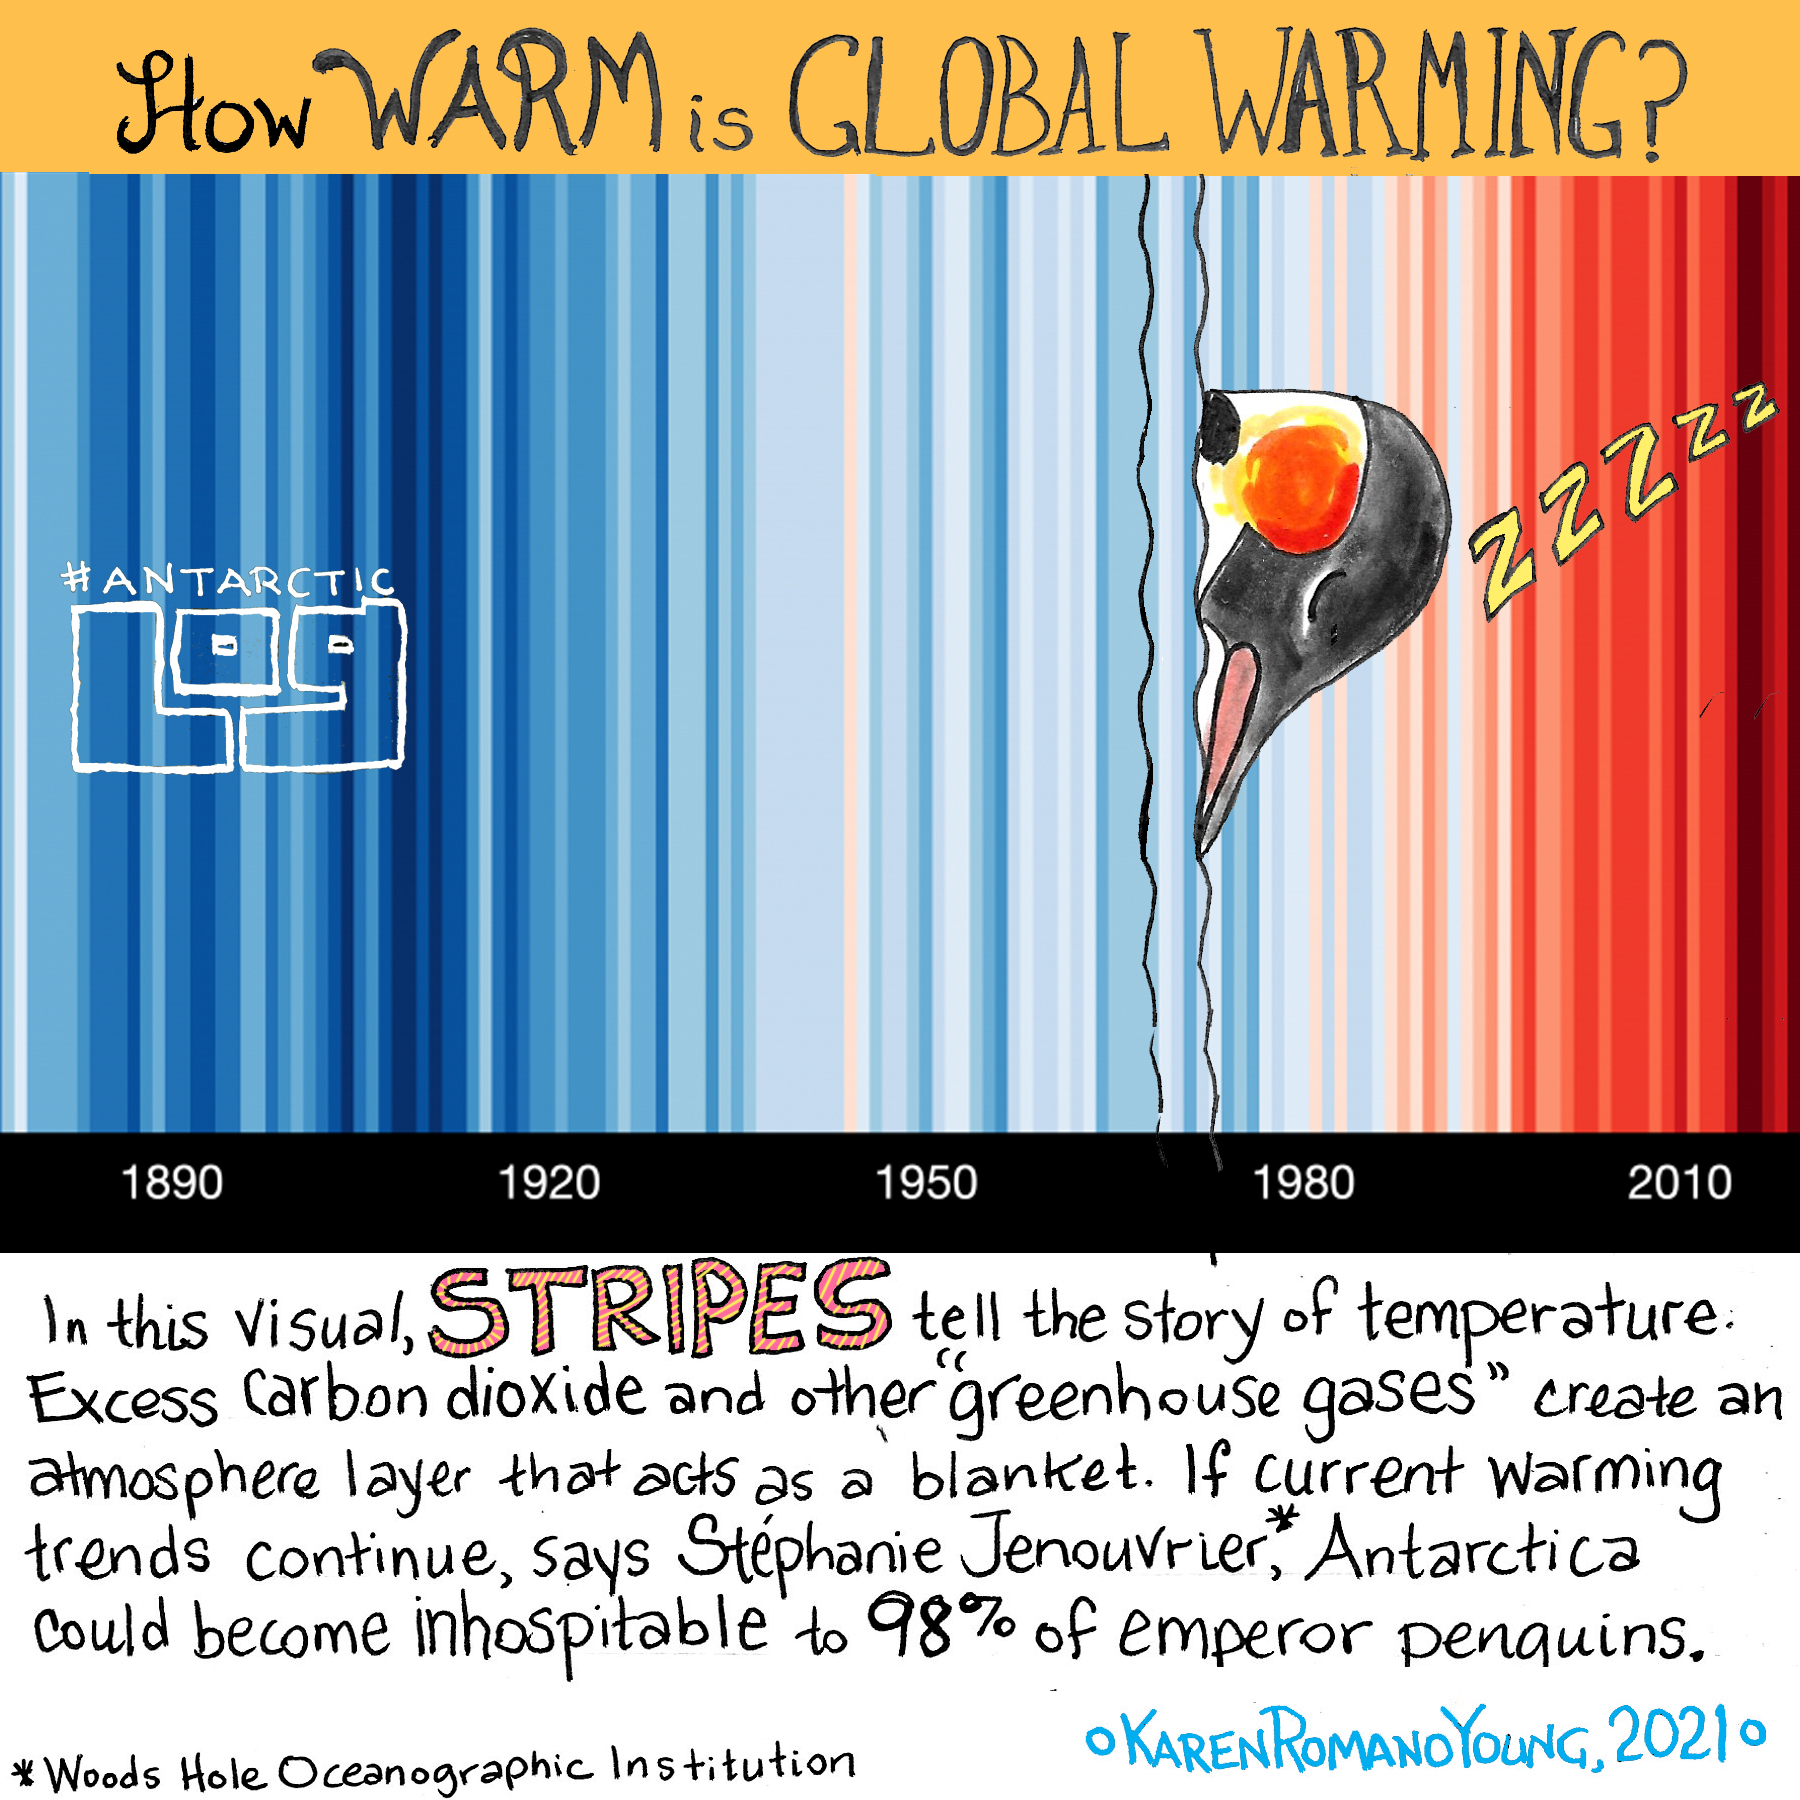
As scientists work to convey what’s going on with climate change, they seek visuals — images worth a thousand words, or a boatload of data points. The sharp angle of a hockey stick stands for the climbing carbon dioxide levels in our atmosphere.
And these stripes fill us in on the warming of our climate. This comic uses them along with another now-common visualizing technique — the comparison of the greenhouse effect to a blanket — which keeps the cold out and the warmth in, providing too much of a good thing, especially for penguins.
–Karen Romano Young is a writer, artist, deep-sea diver, and polar explorer. Follow her on Twitter & Instagram.
 The Plainspoken Scientist is the science communication blog of AGU’s Sharing Science program. With this blog, we wish to showcase creative and effective science communication via multiple mediums and modes.