
19 September 2016
Plainspoken statistics
Posted by Shane Hanlon
By Neda Afsarmanesh (This post is related to a previous post entitled, “Six stats tips for science communicators“.)
I chuckle every time I see this particular xkcd cartoon: someone is explaining to a bride that based on the fact that yesterday she was unmarried, and today she will be married, she can deduce that in a month or so she will have over 50 husbands. The title of cartoon is My Hobby: Extrapolation.
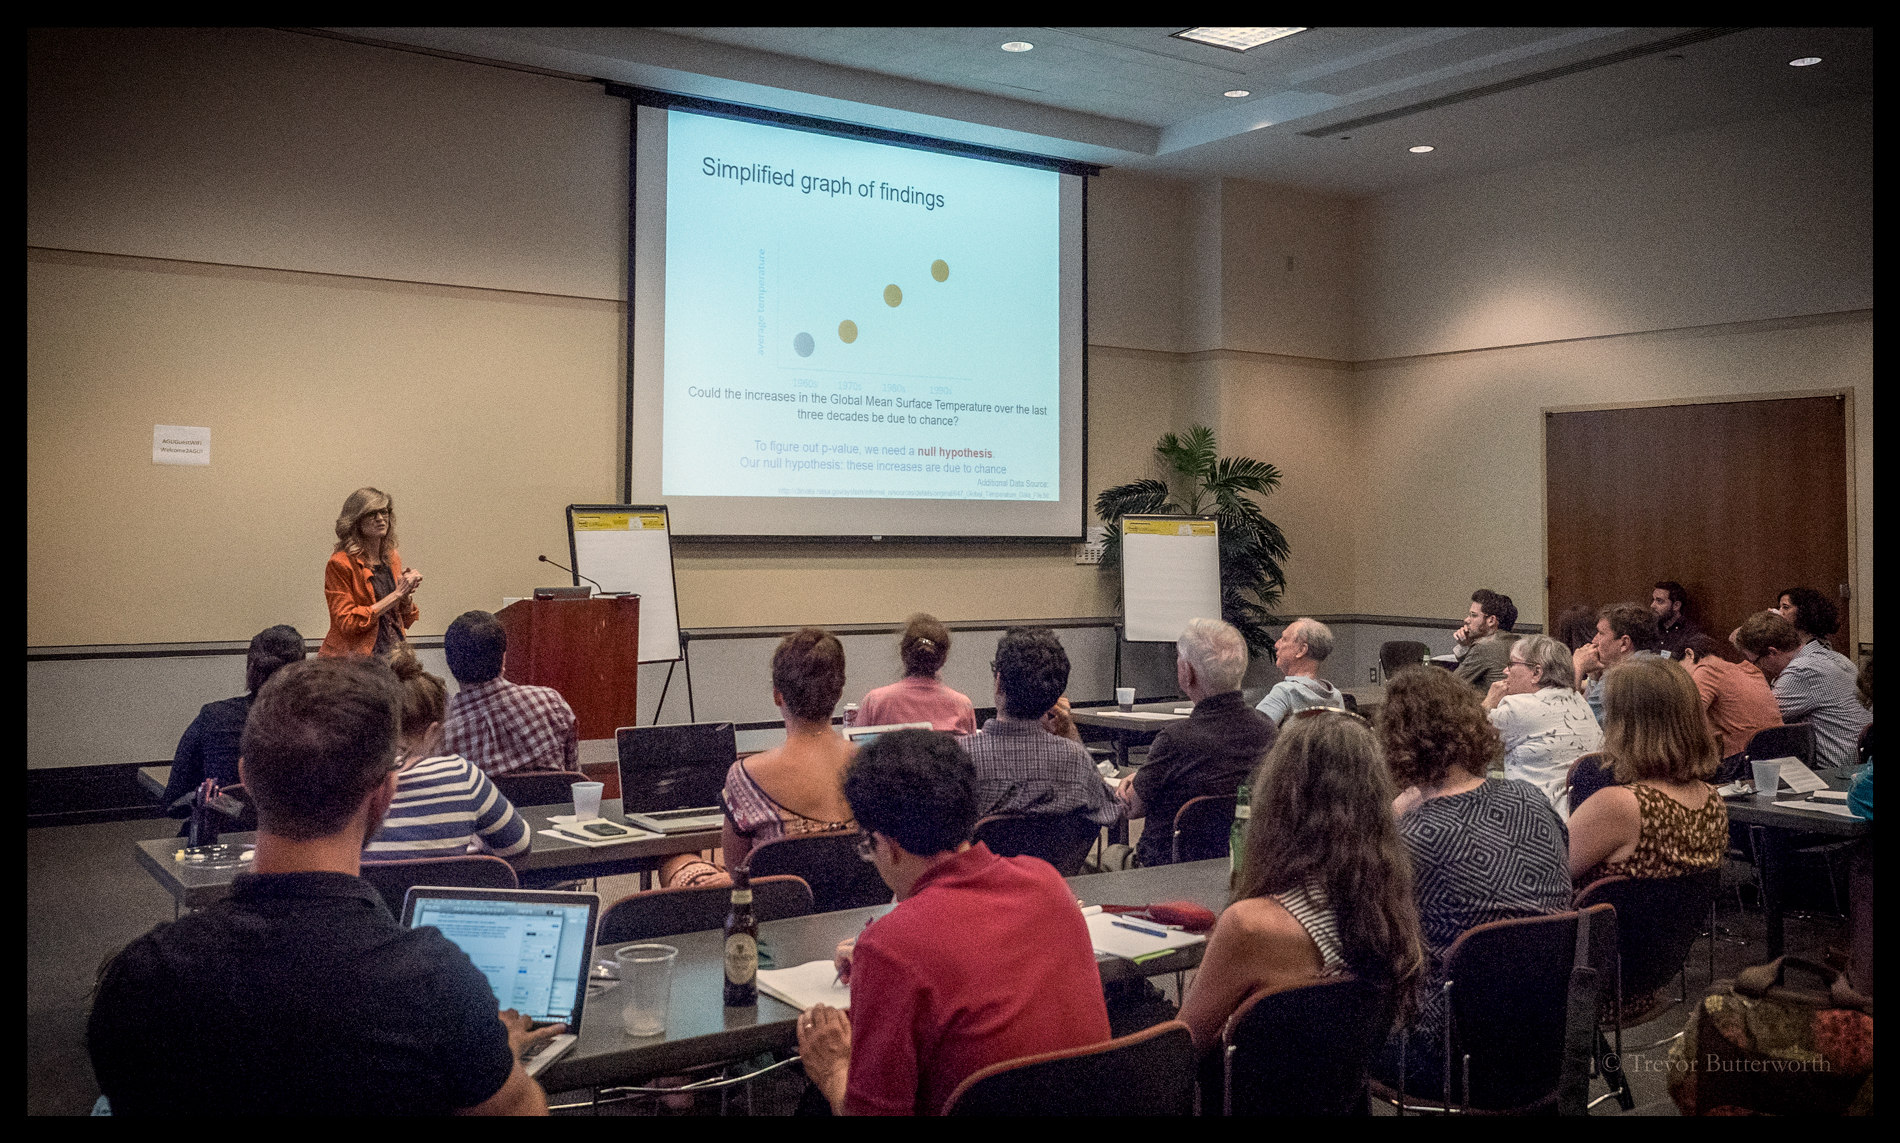
Dr. Regina Nuzzo, Professor at Gallaudet University and STATS.org statistical advisory board member, talks about p-values at our AGU statistics for science writer workshop. Photo credit – Trevor Butterworth
In this simple one-pane cartoon, Randall Munroe, the creator of the xkcd cartoons, captures how easily statistics can be misused or misunderstood by pushing the logic of extrapolation to a ridiculous outcome. But our world is not about husbands and wedding cakes – it’s about climate change, earthquake predictions, and likelihood of cancer, to name a few. And so pushing logic or misusing statistics can lead to dangerous predictions, inaccurate models, or misplaced confidence in risk and certainty.
Because of the potential gravity of misapplied statistics, at STATS.org (which is part of Sense About Science USA), we are passionate about how statistics is communicated.
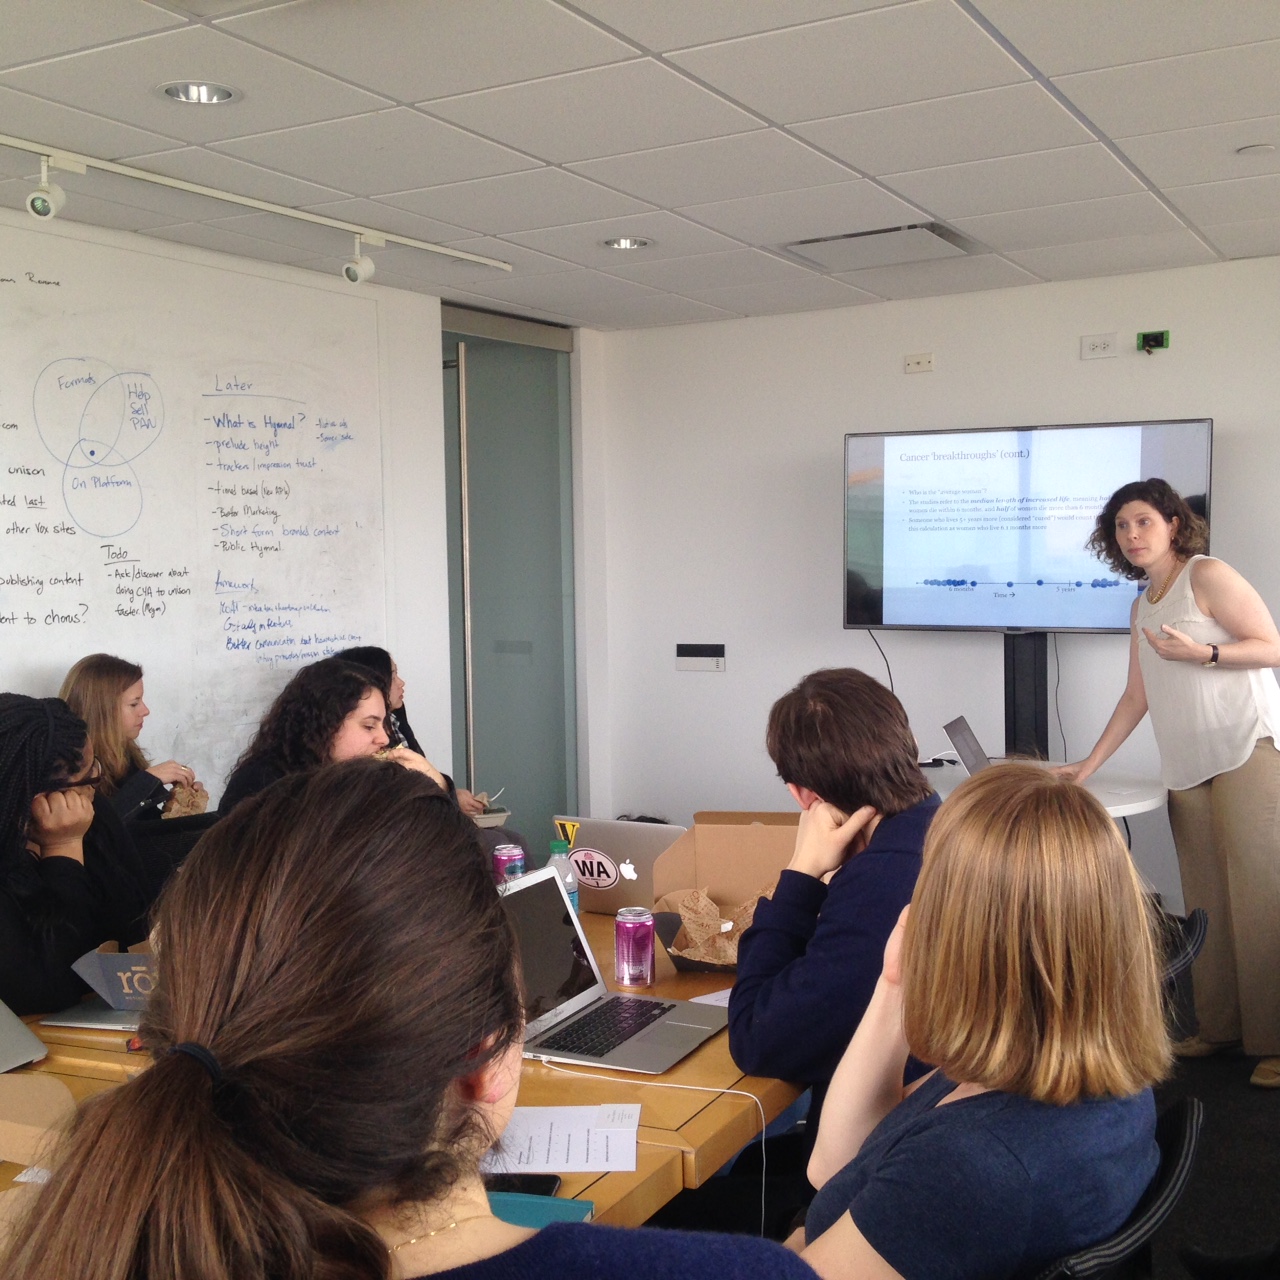
Dr. Rebecca Goldin, Professor at George Mason University and STATS.org Director, talks about misuse of statistics in cancer research studies at Vox News in Washington DC. Photo credit – Carey Reed
Scientists and statisticians spend years engrossed in their scientific studies: designing, experimenting, collecting data, and analyzing results. But how does the public make sense of years of work within minutes? This is where journalists play a crucial role in communicating research. In many cases it falls on them to wade through press releases, parse through data and results in papers, and interview relevant scientists to accurately grasp the scientific and statistical basis of studies as well as the implications and limitations. The stakes are high for journalists and their audience—if journalists, who often act as a bridge between science and society—fail to understand the study design and data analysis aspects of studies, they will not be able to best inform the public, and worse yet can create an environment of confusion and misinformation. And what we’ve found in working for many journalists is that they are quite keen to get the science correct when they translate it for a broader audience. Not surprisingly, one journalist recently said to us, “It’s increasingly important that journalists have an understanding of statistics for their work…”.
STATS.org aims to fill in this niche, to provide journalists with the resources they need to better explain the statistical basis of scientific research to a broader audience (and we aren’t doing this alone, much of our work is supported by the American Statistical Association, equally passionate about this mission). Our work takes two forms. First, our statistical advisory board provides help to any journalist who has questions about study design, data collection methodology, or statistical analysis. Second, we have been hosting statistical workshops for journalists, including a recent one at AGU. These are not meant to be stats 101 or mathematical forays, but a refresher on common concepts (e.g. p-value, absolute vs relative risk, or modeling), and how journalists should think about these statistical concepts and what questions should they be asking scientists about their study design.
Info for STATS.org for journalists in need to statistical help.
Since April 2015 we have responded to over 120 inquiries from journalists and in the past six months we’ve hosted more than 50 journalists in our workshops. It’s a modest start, but we have been encouraged by the great response we’ve received. As another journalist noted at the end of our recent AGU workshop: “…it was just the perfect [and] needed learning for the type of journalism that I do.”
-Neda Afsarmanesh is Deputy Director at Sense About Science USA, working to better the communication of science by working with scientists and journalists. You can follow SAS USA and STATS.org: @sensescienceusa and @statsorg.
 The Plainspoken Scientist is the science communication blog of AGU’s Sharing Science program. With this blog, we wish to showcase creative and effective science communication via multiple mediums and modes.