
6 September 2021
Catoca mine in Angola – using satellite imagery to understand recent events
Posted by Dave Petley
Catoca mine in Angola – using satellite imagery to understand recent events
According to Wikipedia, Catoca mine in Angola is the fourth largest diamond mine in the world. Located at -9.399, 20.301, it consists of a big open cast pit and a very large tailings storage area.
Last month, CRREBaC released information about a set of very significant pollution events in the rivers of Angola and Congo, linked to mining in Angola. Reports have included the pollution of hundreds of kilometres of the river system, deaths of fish and hippos and, in some cases, suggestions of up to twelve fatalities. Detailed information to evidence these huge losses is lacking, but there is little doubt that serious pollution occurred.
Whilst this blog is about landslides, I have very often written (and indeed campaigned) about the scandalously poor management of tailings in the mining industry, and I have highlighted several major tailings dam failures. My interest in the events in Angola and Congo results from concerns that the events might have been one or more tailings dam collapses.
One of the candidate sites for the events in Angola is the facility at Catoca, and indeed the operators have reportedly admitted that a release did occur, but only of water and sand.
This is a satellite image of the Catoca facility collected by Planet Labs on 21 July 2021:-
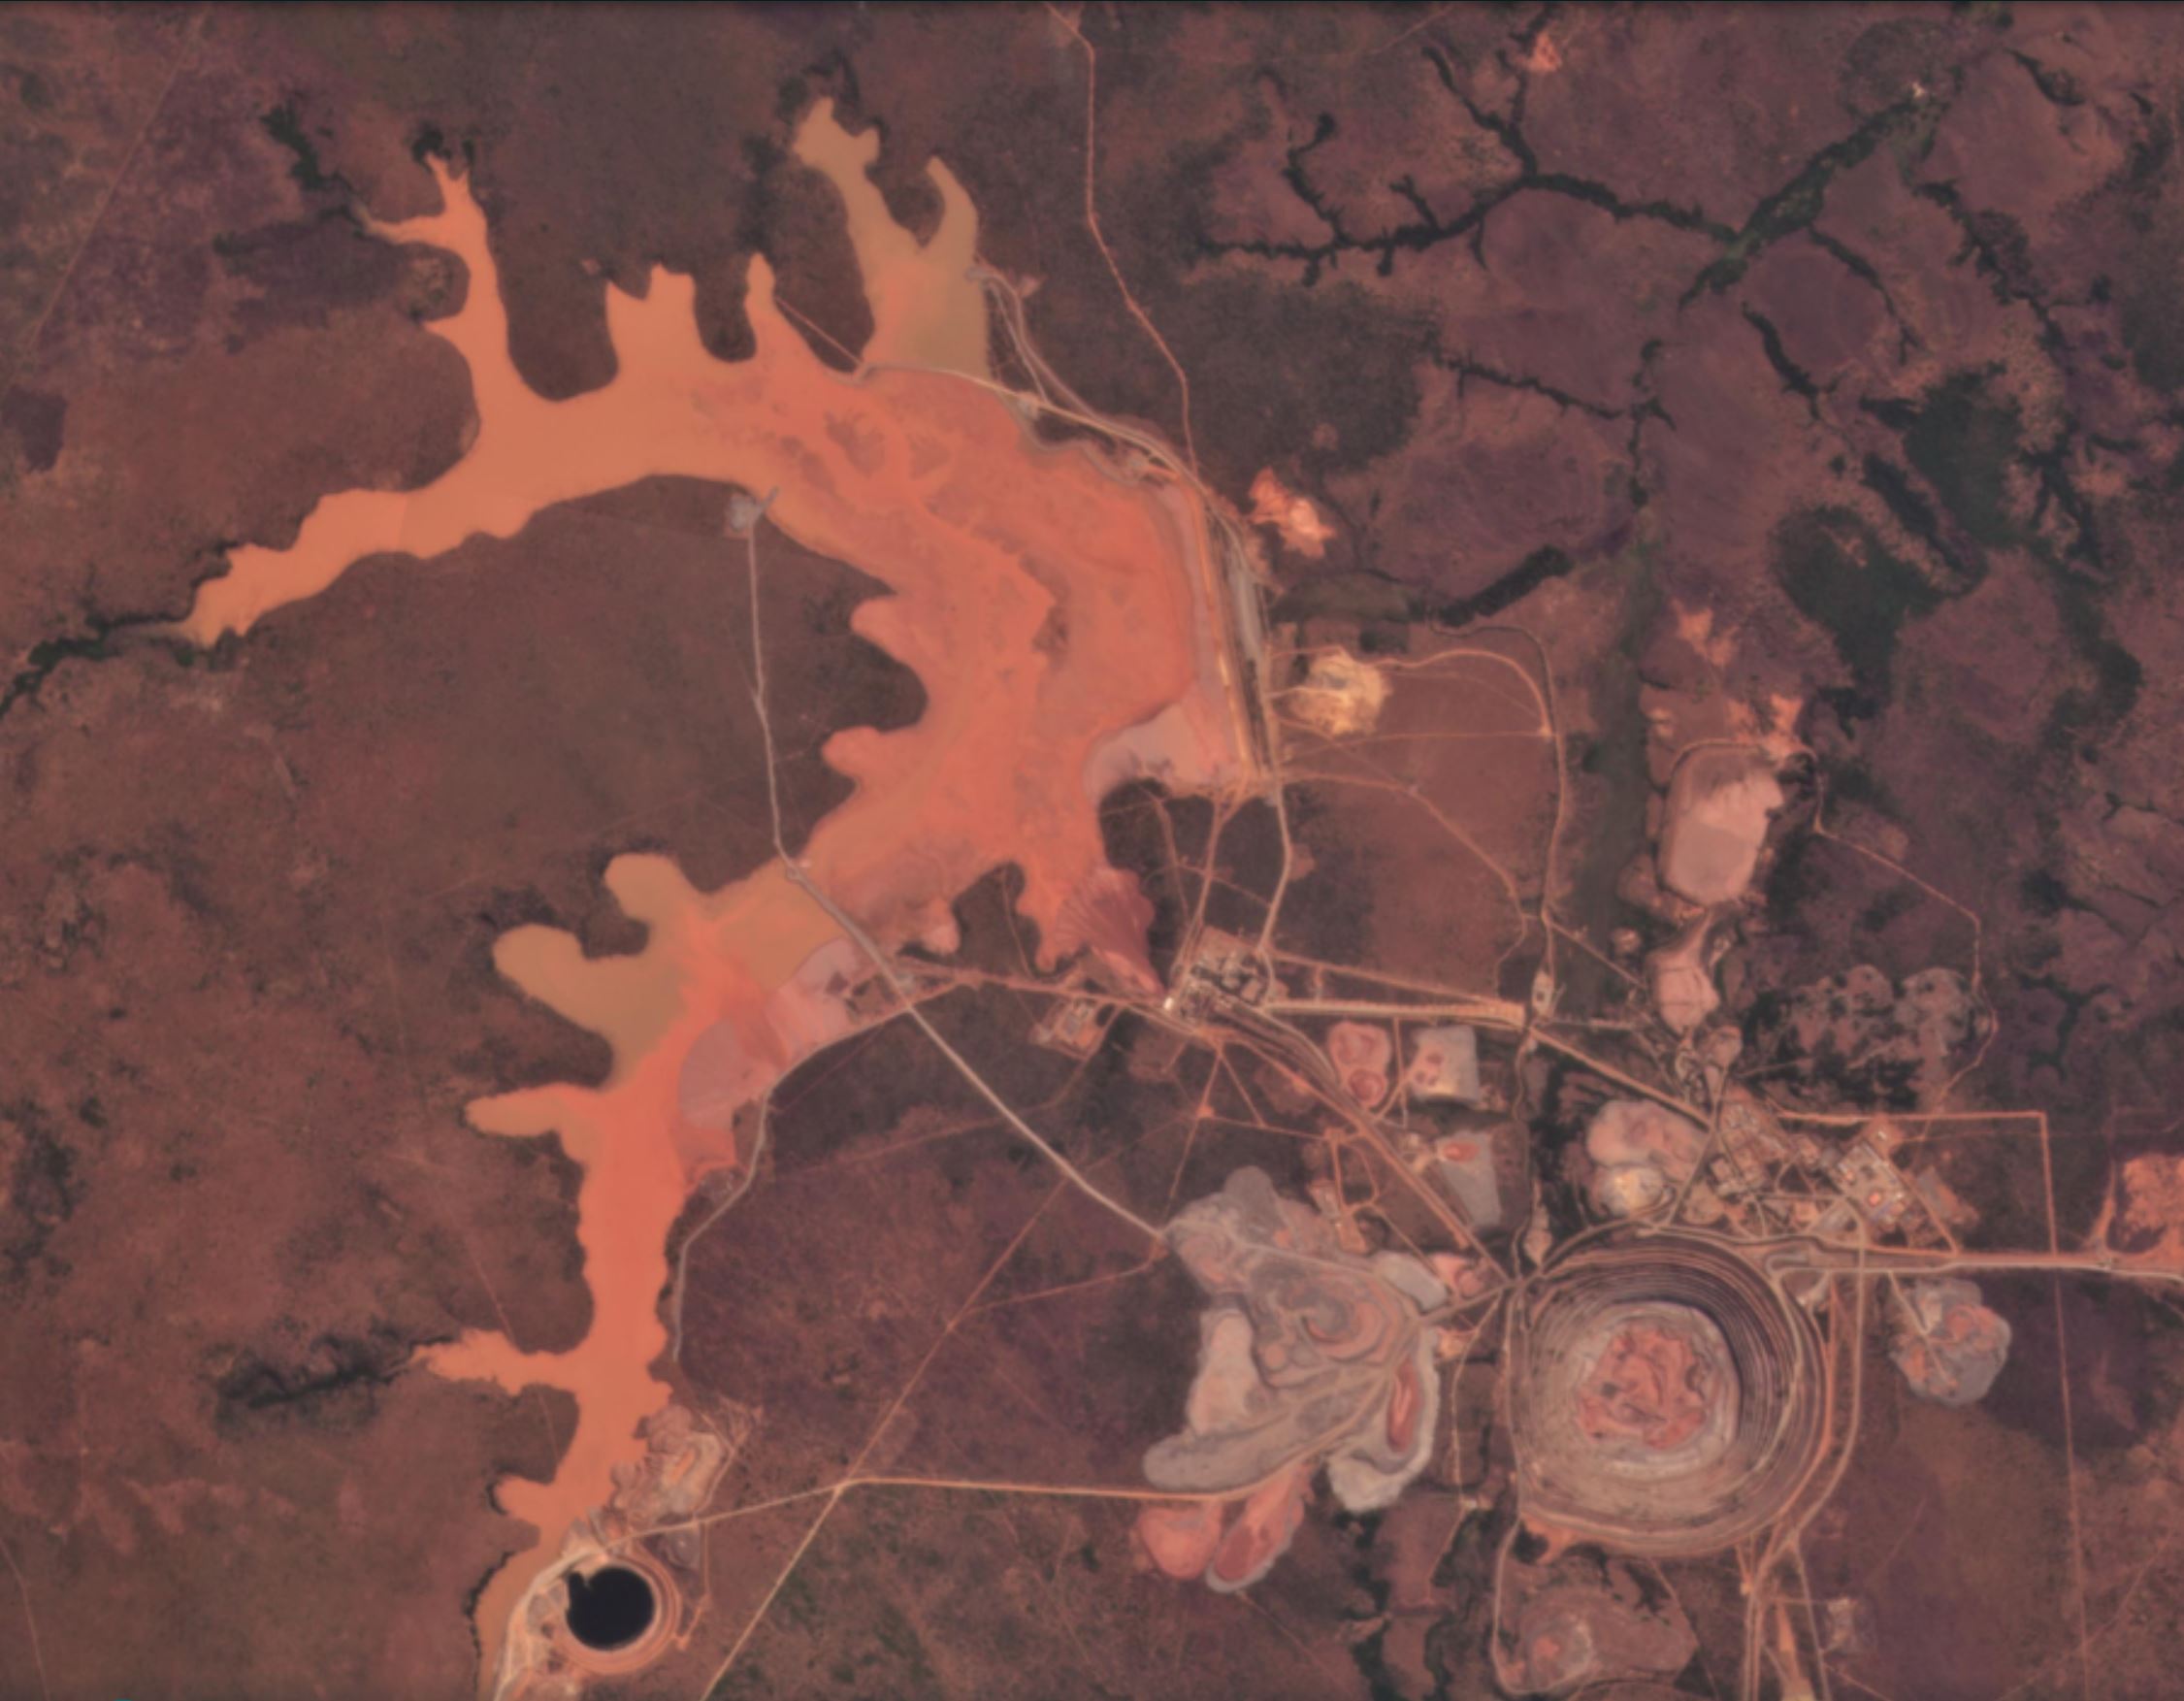
The Catoca diamond mine on 21 July 2021. Image copyright of Planet Labs, used with permission.
.
The pit is in the bottom right hand corner, the tailings facility in the huge orange area on the left side of the image. The tailings dam is located just above the centre of the image, orientated NNW-SSE. There is no evidence of any problem in this image.
The first sign of change appears in the image of 24 July 2021. The change is subtle but significant:-
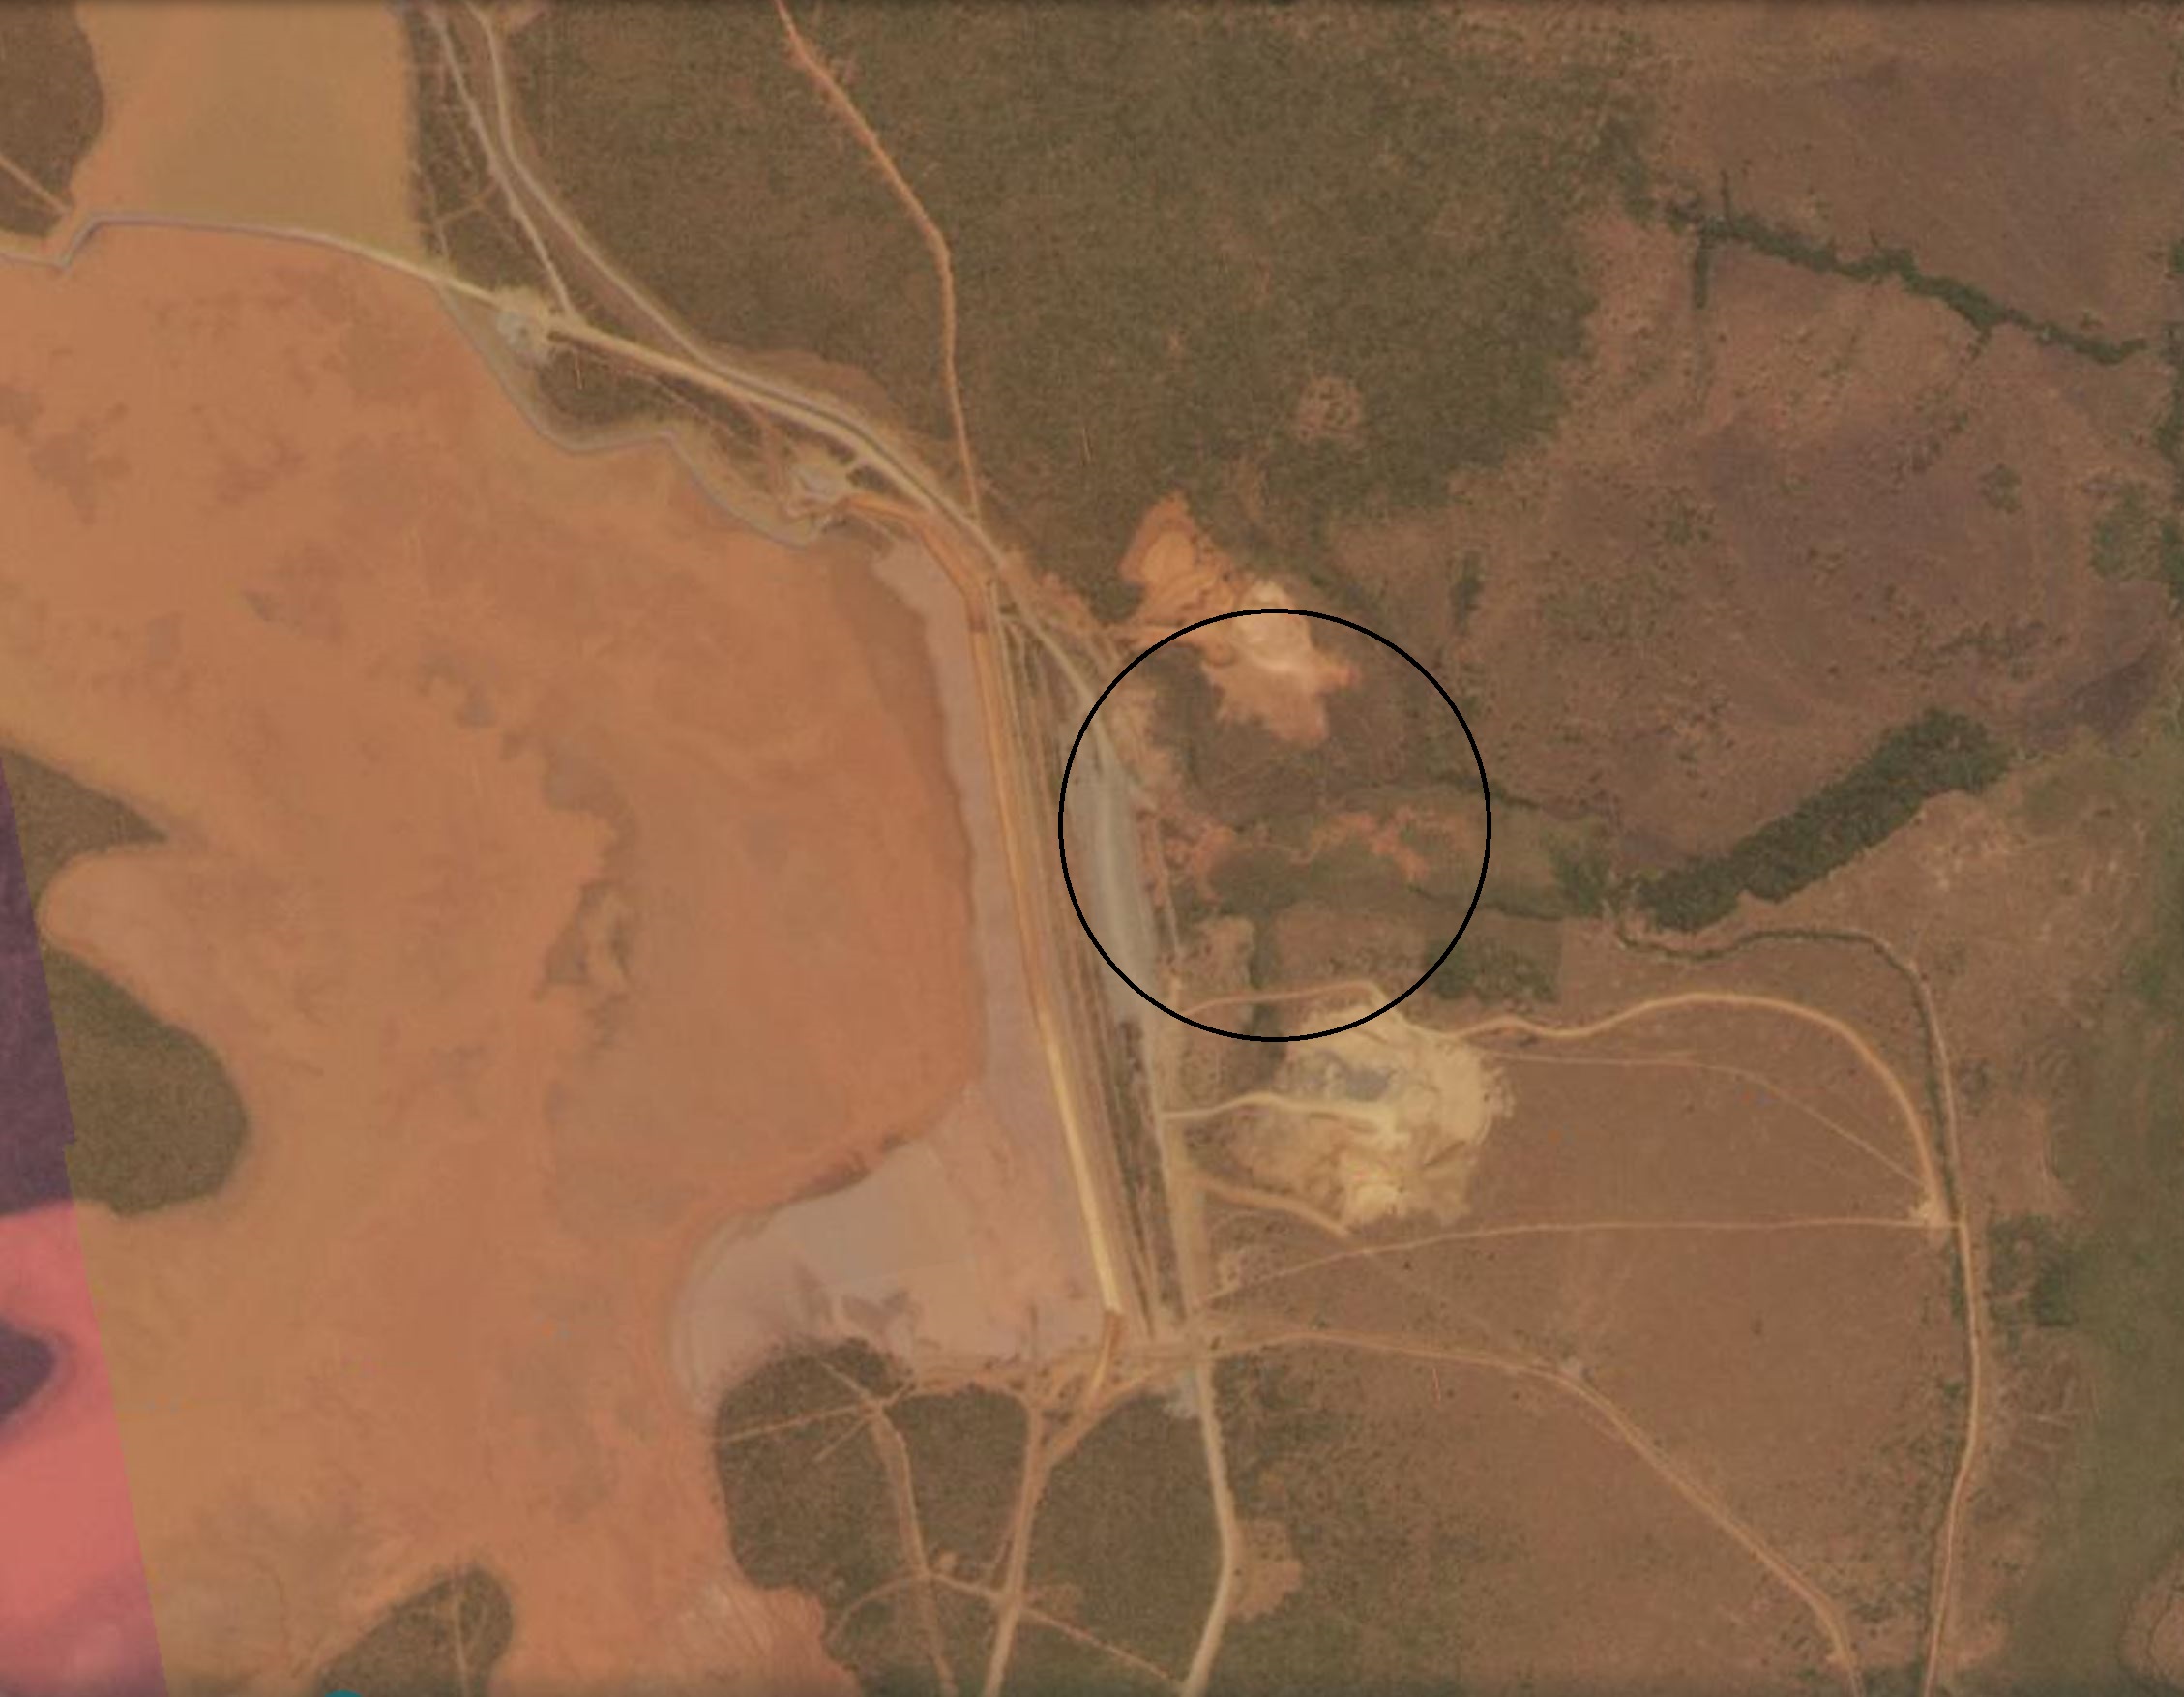
Pollution downstream of the Catoca diamond mine on 24 July 2021. Image copyright of Planet Labs, used with permission.
.
I have put a black circle around some clear pollution on the downstream side of the tailings dam. Note that the tailings dam was intact (and remains so). A day later the problems had become very much worse:-
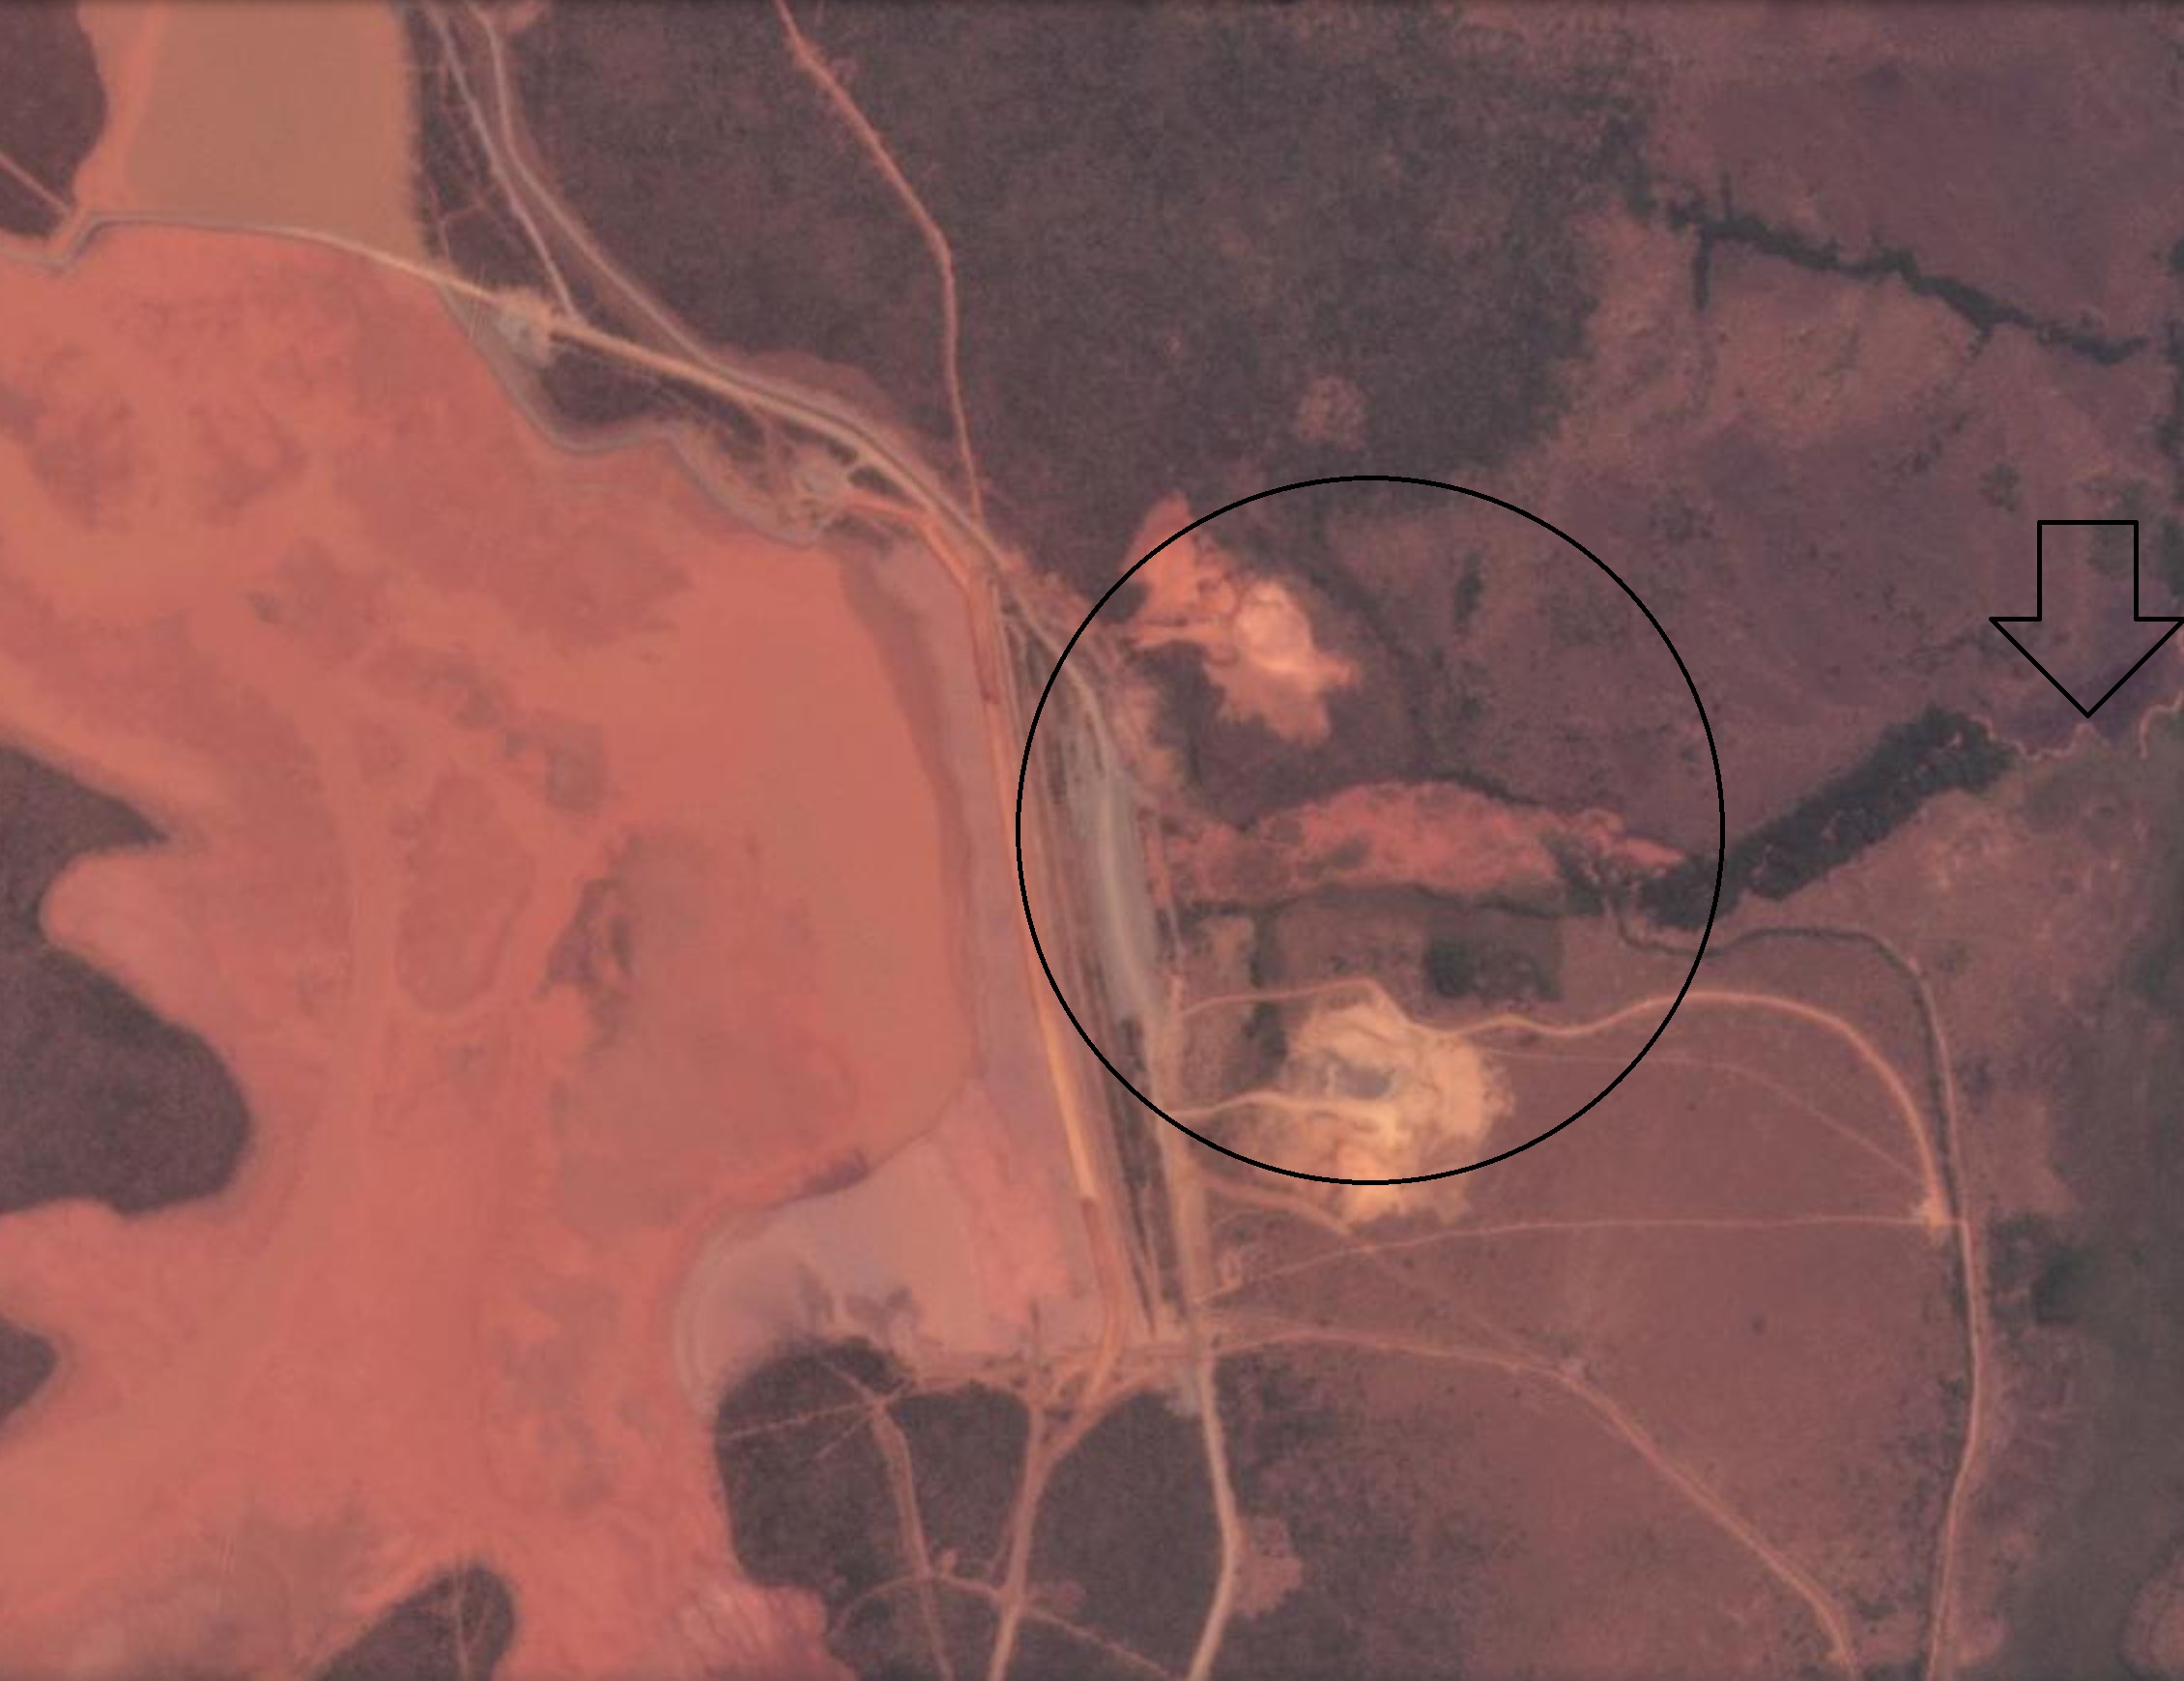
Pollution downstream of the Catoca diamond mine on 25 July 2021. Image copyright of Planet Labs, used with permission.
.
By 25 July 2021 a large plume of pollution had appeared on the downstream side of the tailings dam (highlighted with a circle again). The had entered the watercourse, which was now showing very clear signs of pollution (highlighted with an arrow).
The situation today, a few weeks later, is interesting:-
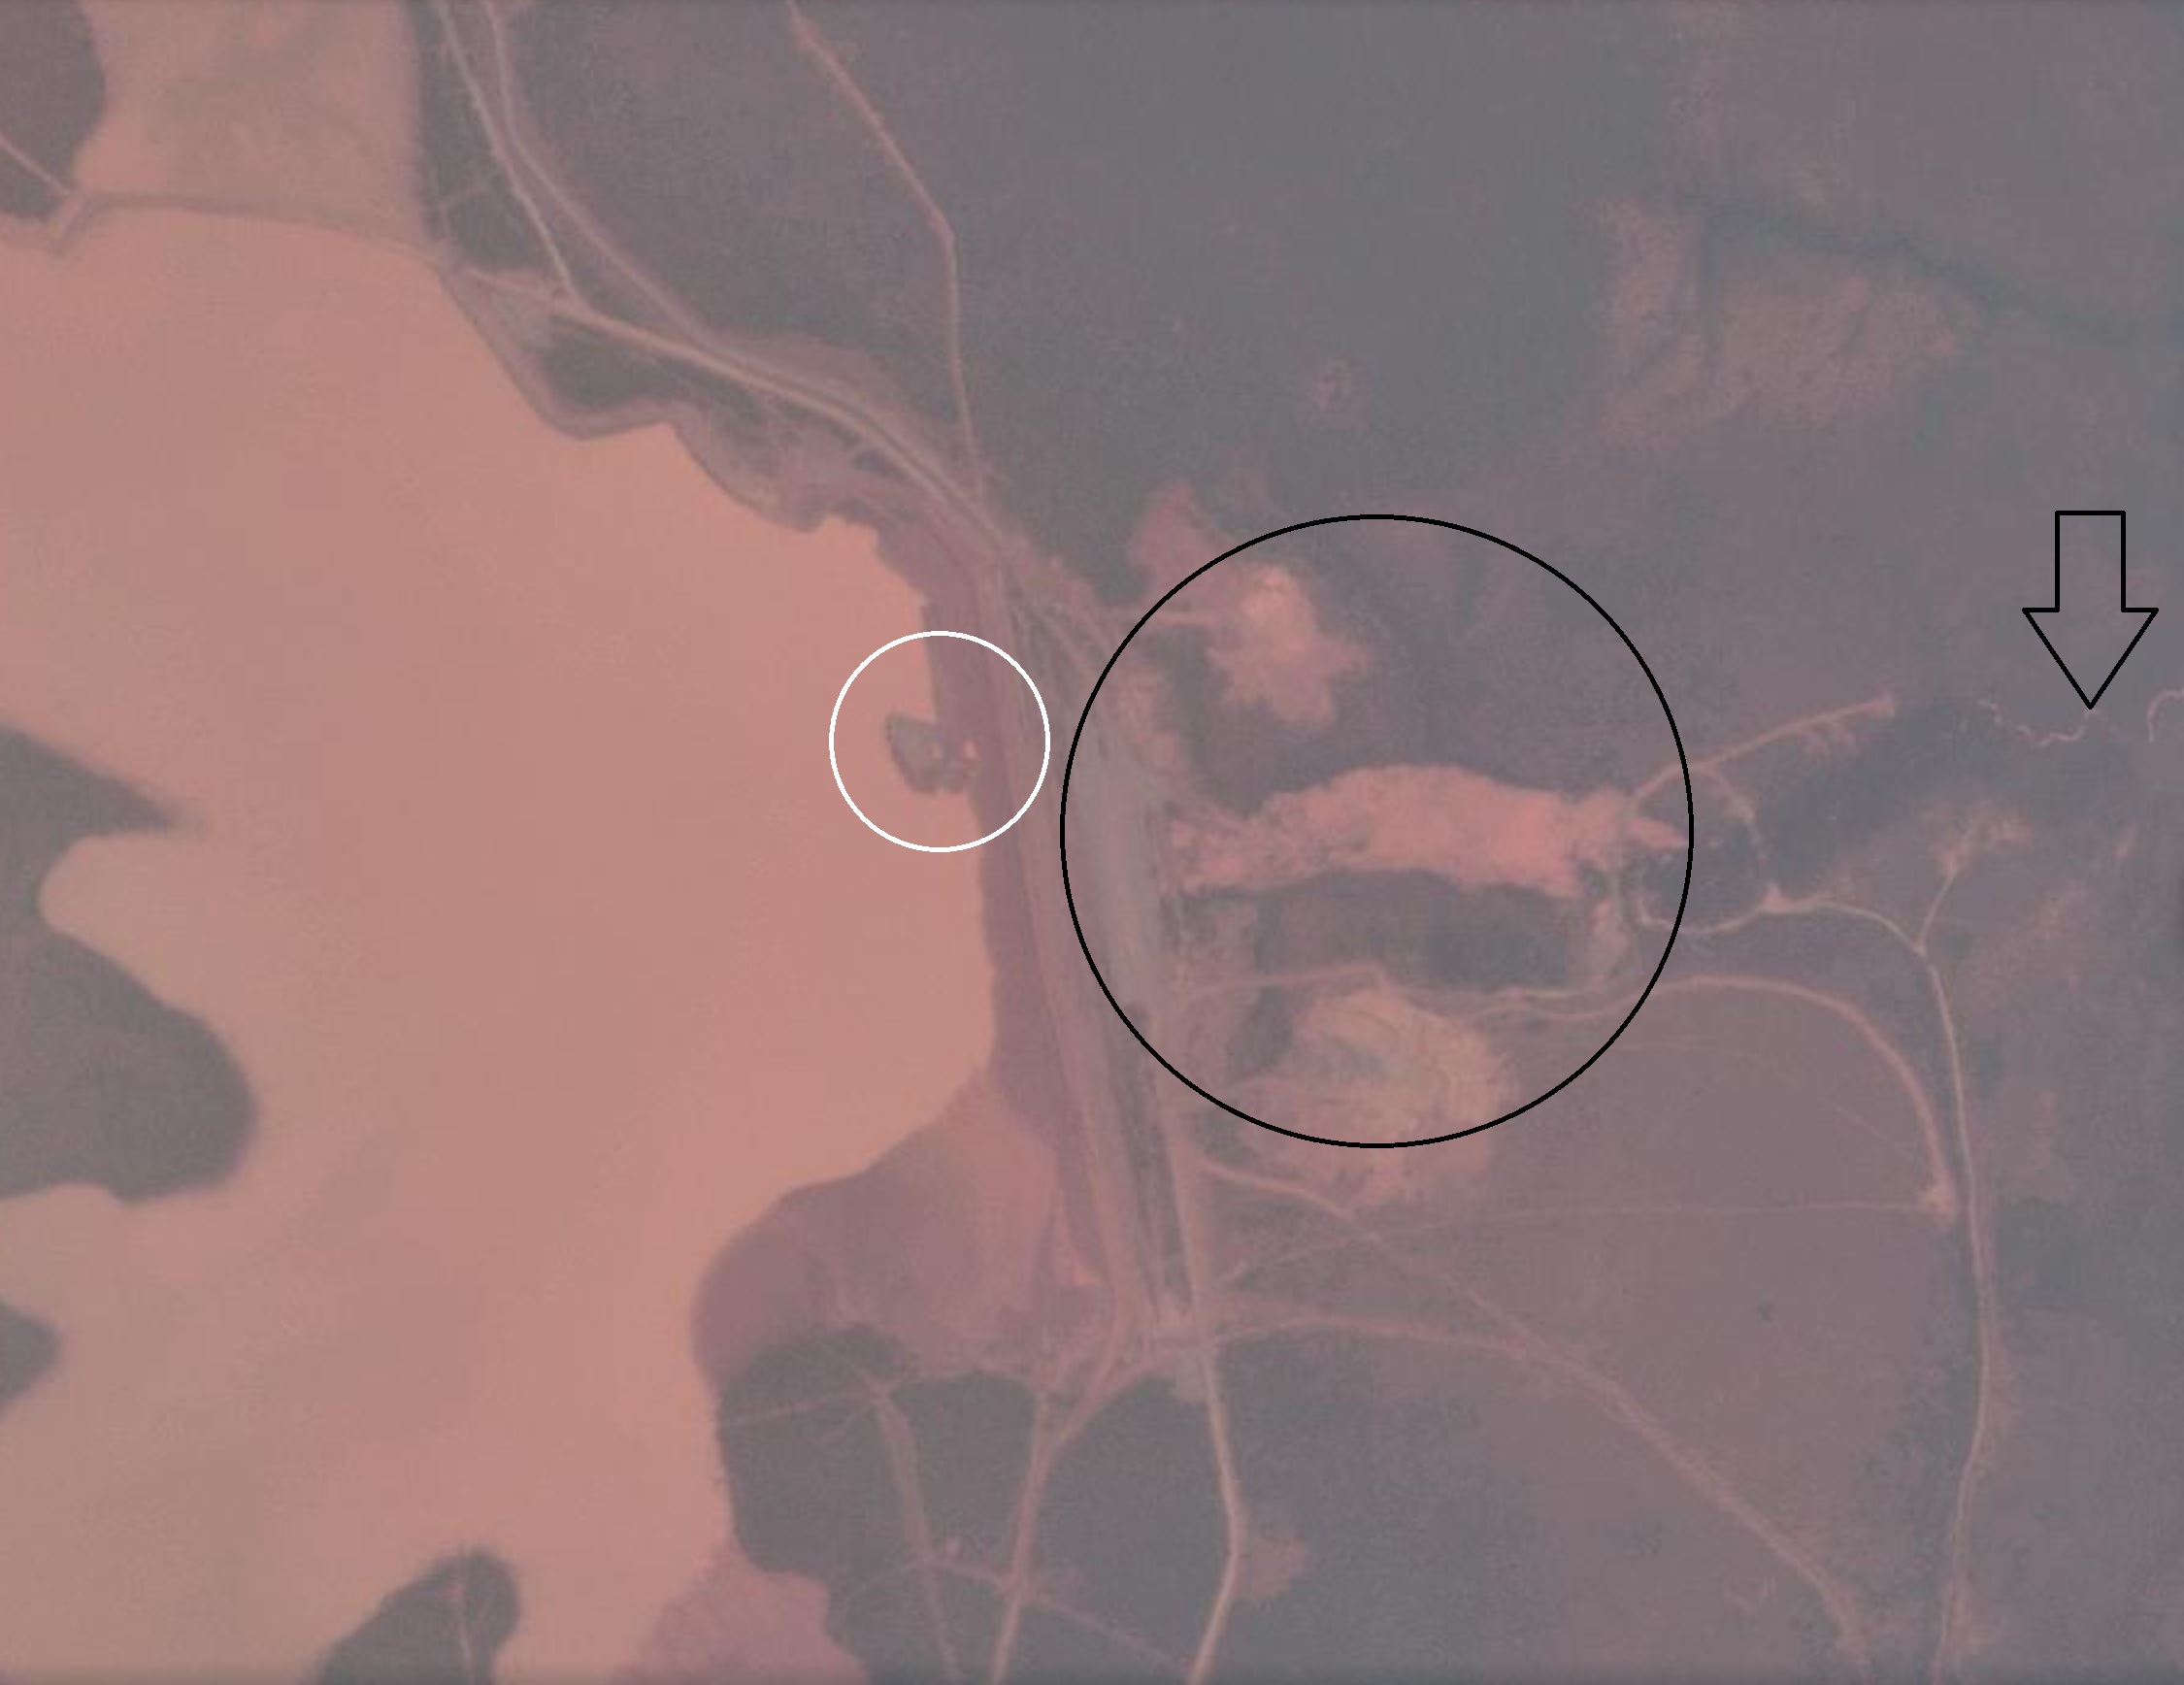
Pollution downstream of the Catoca diamond mine on 5 September 2021. Image copyright of Planet Labs, used with permission.
.
The plume has developed considerably , although it has not enlarged significantly (black circle). The polluted watercourse is very clear. There is clear evidence of works around the plume (new roads for example) and on the upstream side of the dam (white circle).
From the images above the pollution might not at first sight look serious, but satellite images downstream might tell a different story. This image was collected on 25 July 2021 at about 8:56 UT, downstream of Catoca at -9.127, 20.346:-
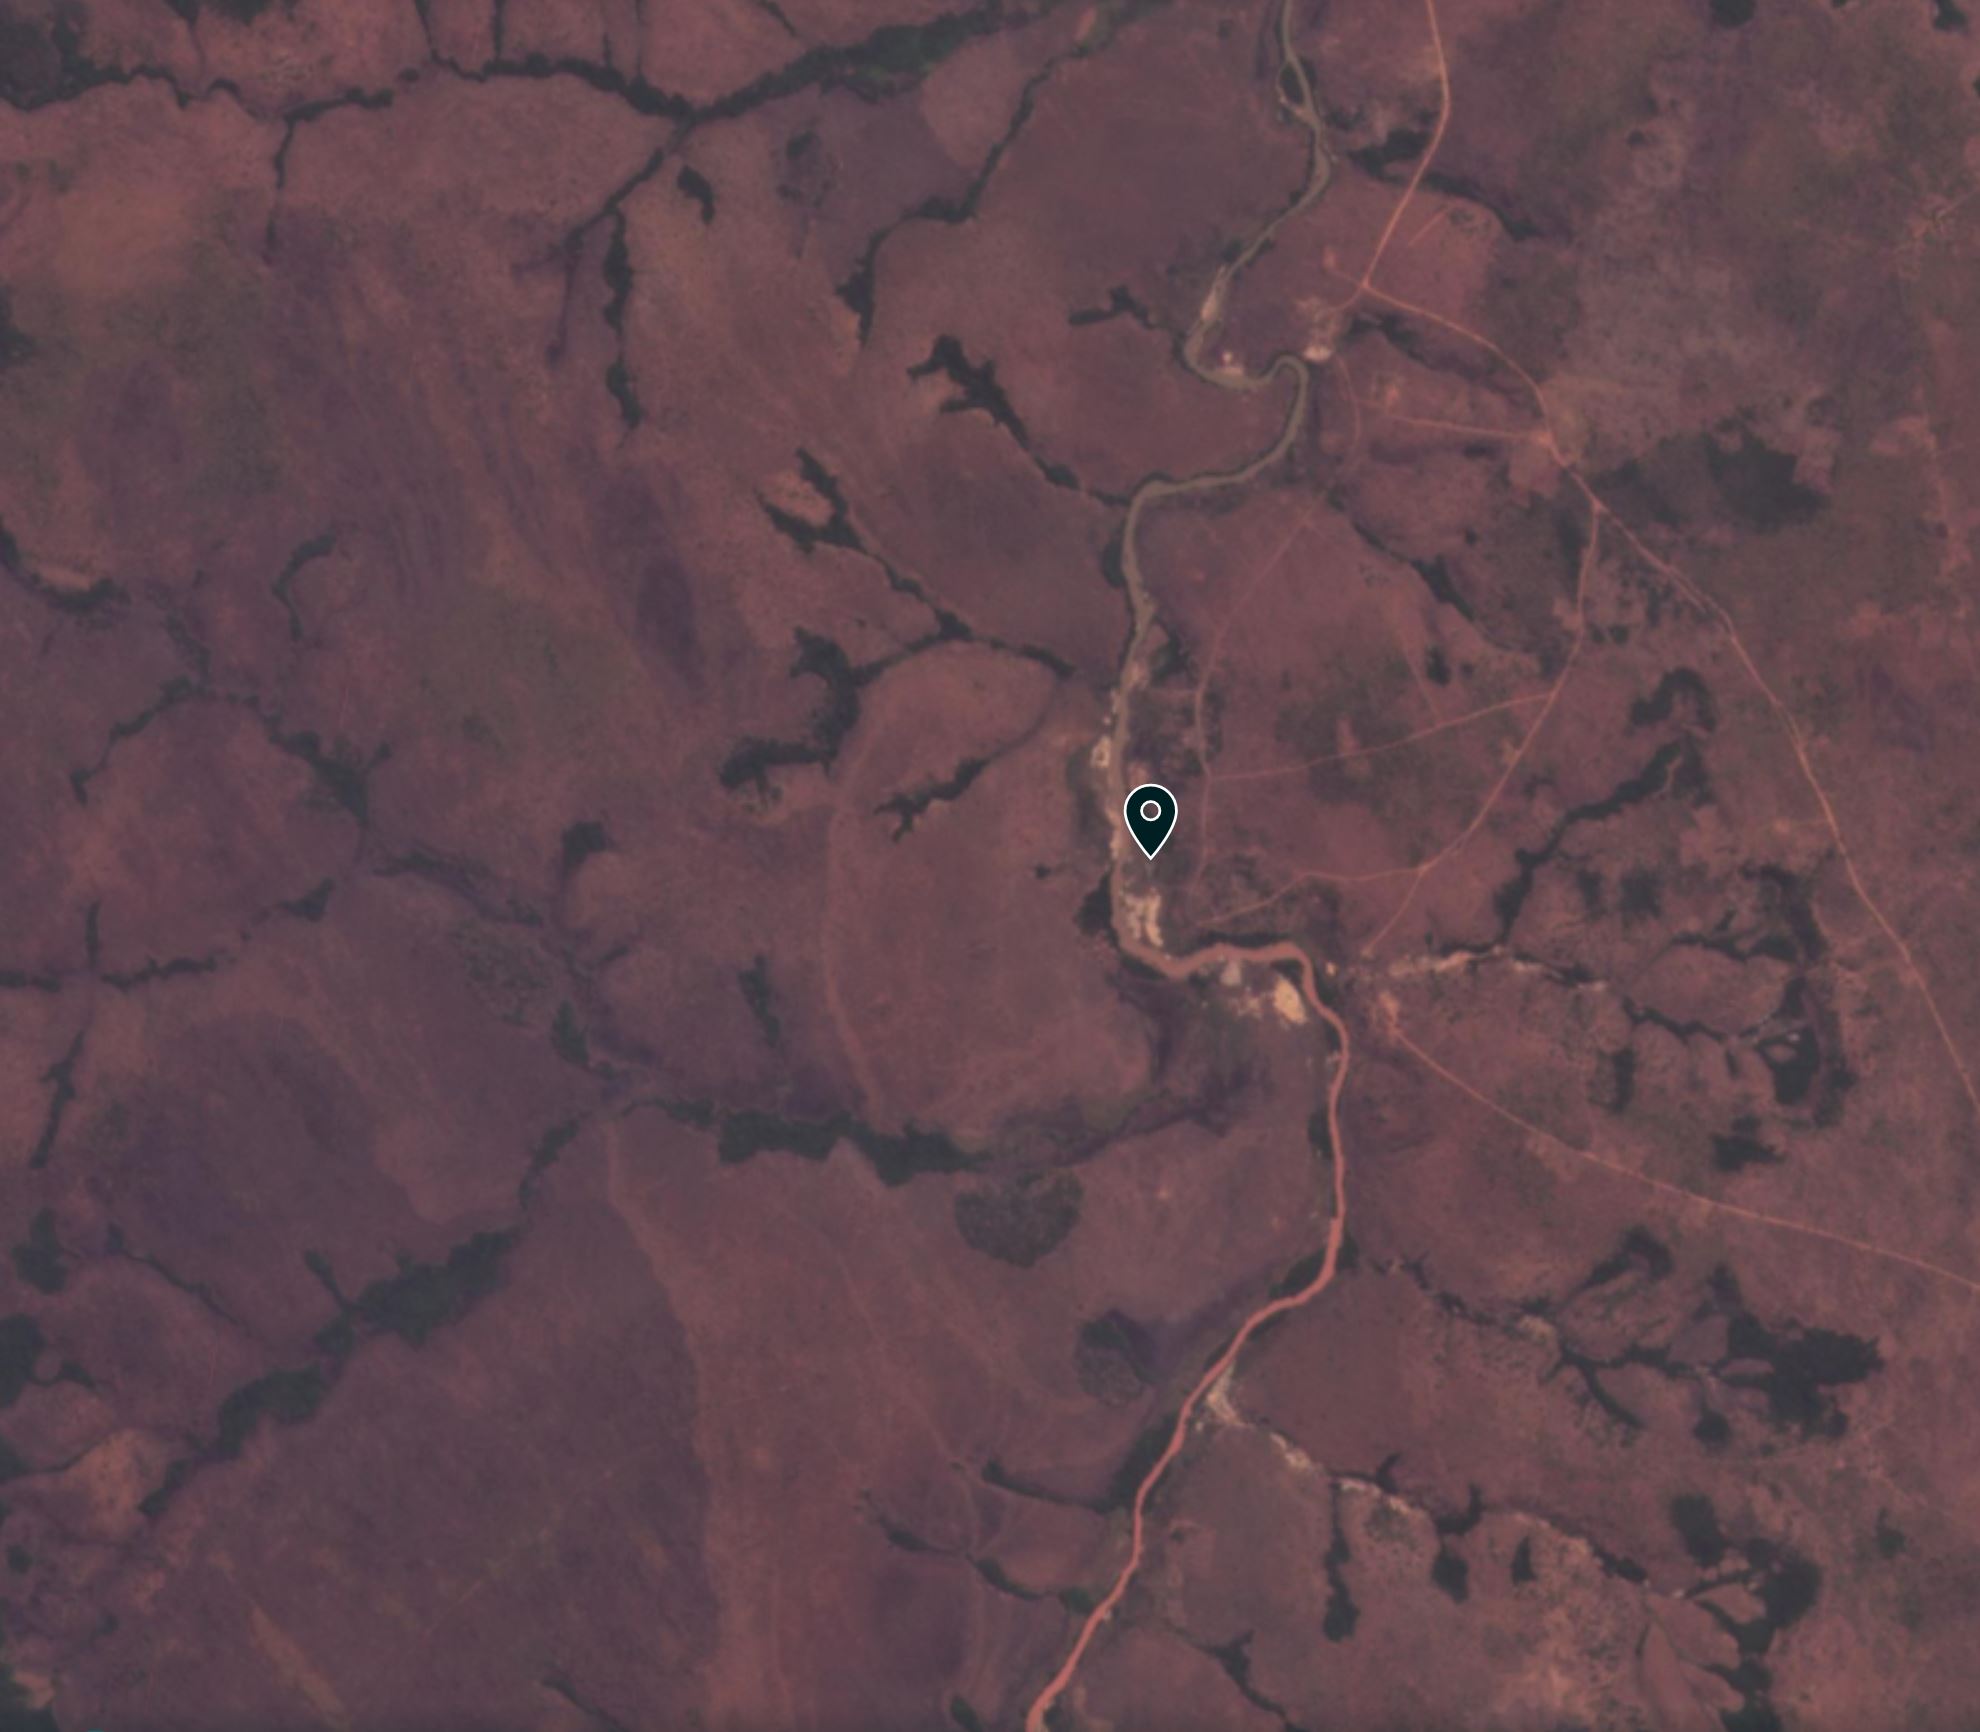
The front of the pollution downstream of the Catoca diamond mine on 25 July 2021. Image copyright of Planet Labs, used with permission.
.
The river is flowing from the south to the north. In the lower part of the image the river is bright orange with pollution. In the northern part of the image the river is unpolluted. The marker, at -9.127, 20.346 is the approximate front of the pollution moving downstream from Catoca. Note the profound change in the water as the pollution front moves through.
This is even more profoundly illustrated in the image below. The small tributary from Catoca flows in from the southwest. It meets the main channel, flowing from south to north. Note the huge change in water quality from this point onwards:-
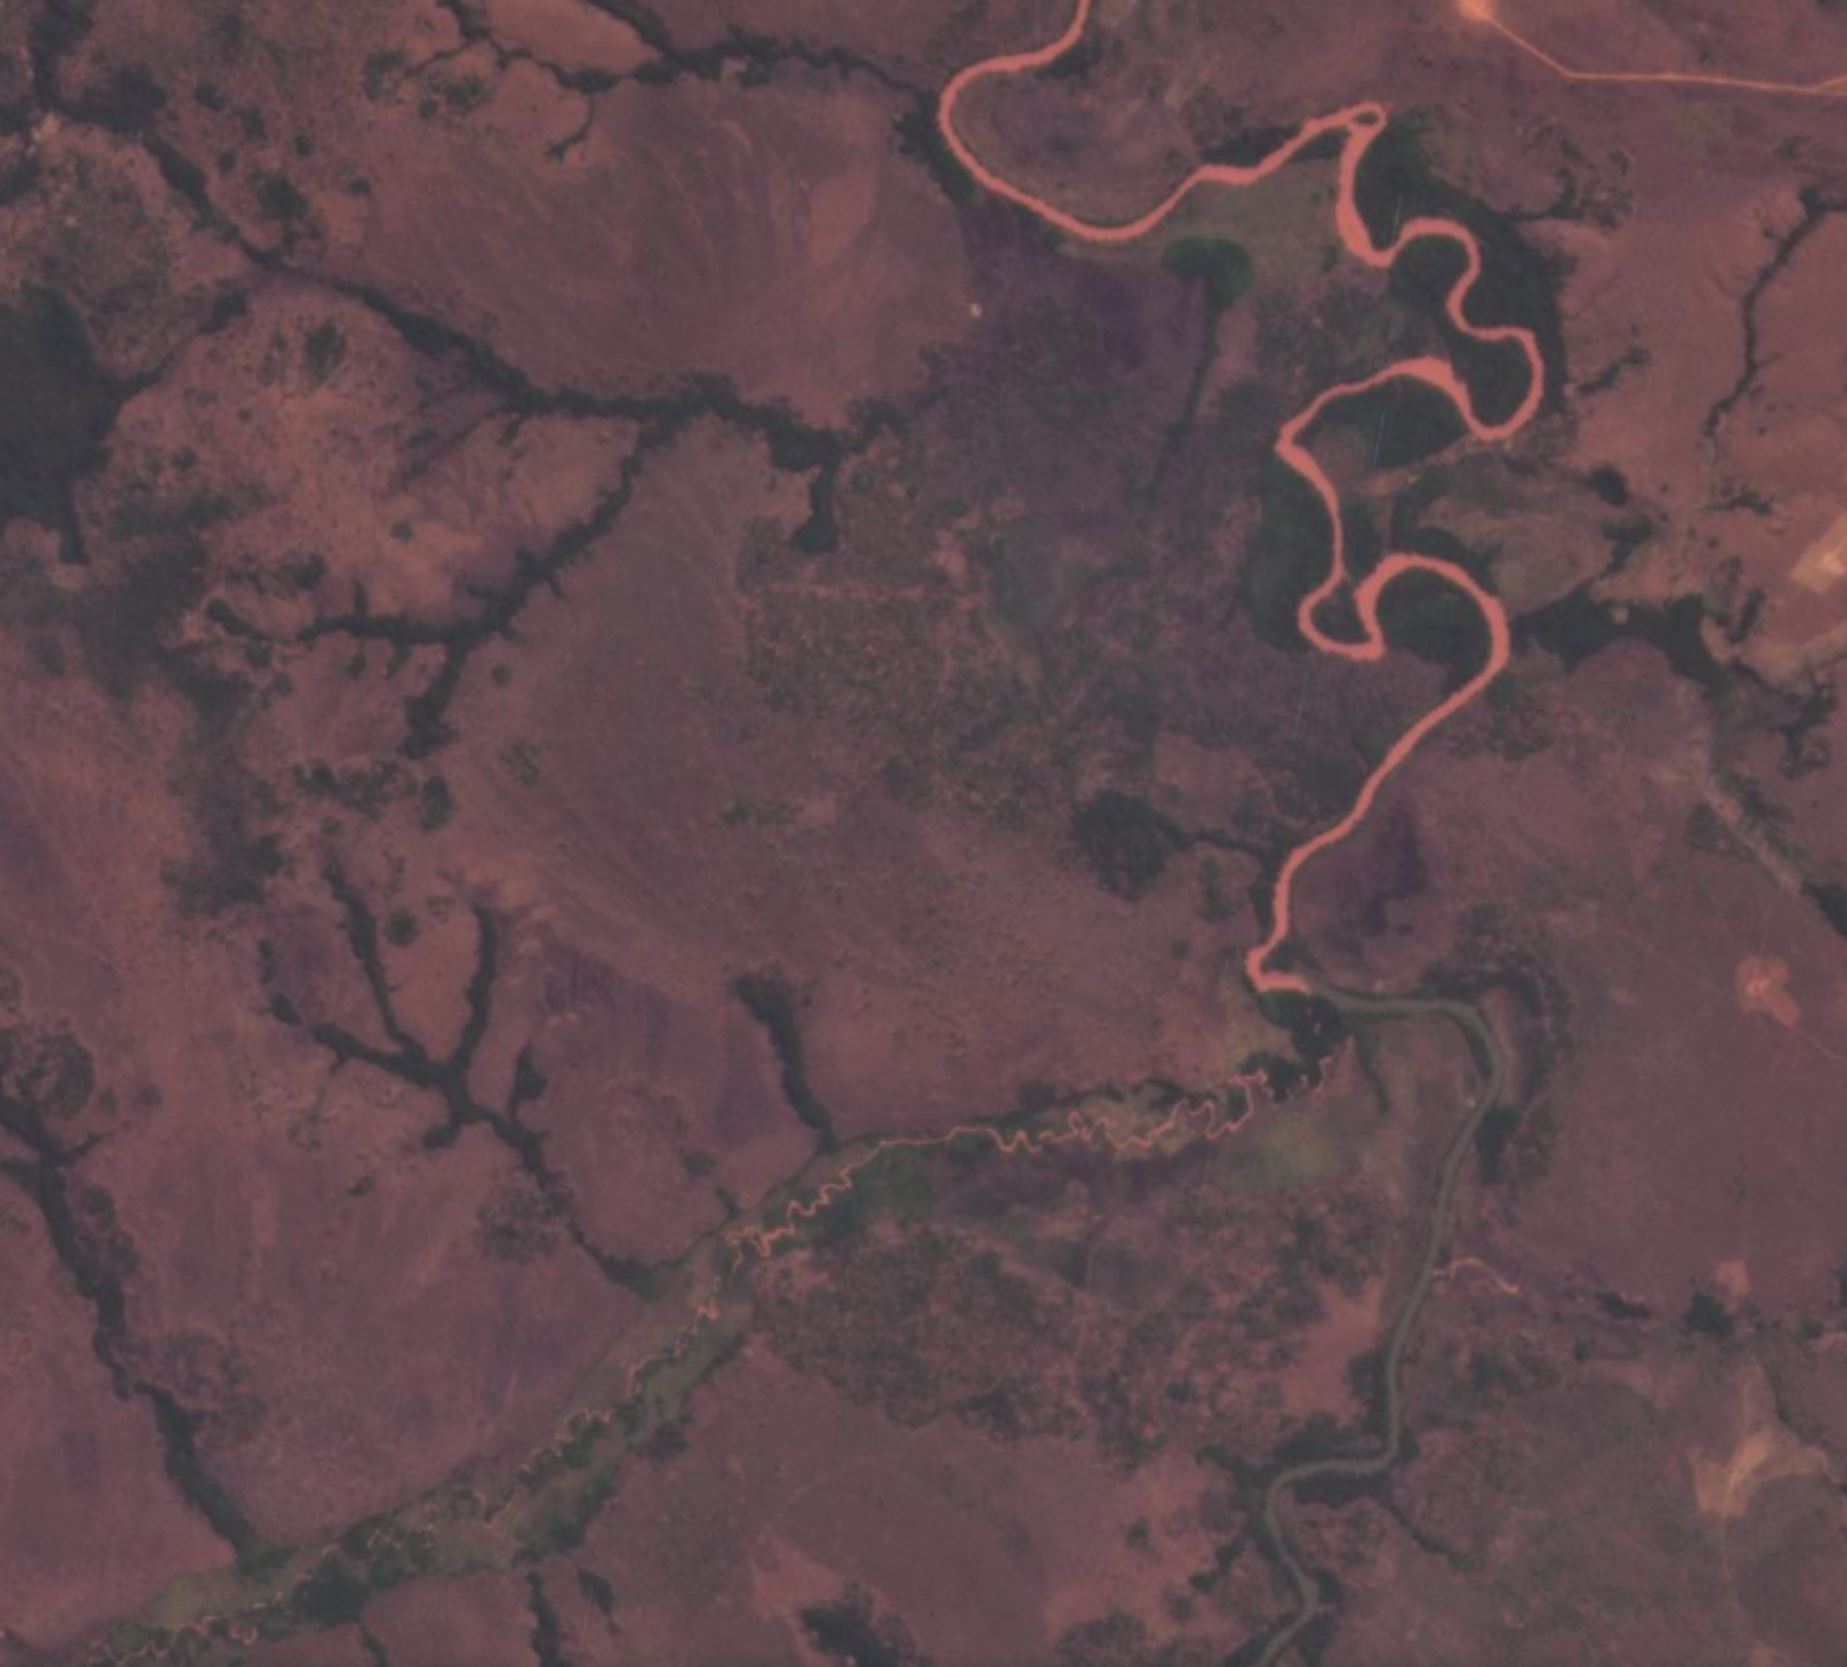
The passage of pollution downstream of the Catoca diamond mine on 25 July 2021. Image copyright of Planet Labs, used with permission.
.
This location is -9.309, 20.362.
According to the New York Times article:-
In a statement last month, the company admitted that there had been a “rupture in the pipeline that works as a spillway.”
The satellite images are consistent with this as the source of the pollution, although the ecological damage looks to be more severe than some have suggested.
However, there is an anomaly. The CRREBaC report indicates that substantial pollution was first seen in the rivers of Angola from 15 July 2021:
On the basis of the Sentinel images published by Visio Terra (Equipe Sentinel Vision, EVT919, 2021) and our preliminary investigations from riparian communities, this pollution has been observed since 15 July 2021 from the source in the Angola part of the basin and would have taken 15 days to reach the city of Tshikapa, and 21 days for the city of Ilebo in the Democratic Republic of the Congo (DRC).
The pollution observed on 15 July 2021 does not seem to have come from Catoca according to the images, which suggests a second serious event occurred in a different mine in the area.
.
Reference
Planet Team (2021). Planet Application Program Interface: In Space for Life on Earth. San Francisco, CA. https://www.planet.com/
 Dave Petley is the Vice-Chancellor of the University of Hull in the United Kingdom. His blog provides commentary and analysis of landslide events occurring worldwide, including the landslides themselves, latest research, and conferences and meetings.
You can find the Sentinel Vision report of the event by VisioTerra (which I authored) here: https://www.sentinelvision.eu/gallery/html/59f7f8cfa0ef49bab141c4eb6f55aee4
You can access navigate in the full resolution images using the hyperlinks on the right of the page.
Last month I worked with one of the engineers of the CRREBaC to produce this report and we believe the images (fig 12. and 13.) show it comes from the Catoca mine but that the major pollution started between the 20 and 25 July, not on 15 July as stated in the CRREBaC report. It is thus comforted by your own analysis with a different set of images which refines the date even further. The mine officials declared on 27 July it started spilling; we also observed it lasted several weeks.
This animation starting from 10 July shows the evolution every 5 days over this mining region of Angola: https://www.sentinelvision.eu/hyperlook/e1b2ac7b6e824e98bb0d8e7ea616a6e9
You can zoom in and see 4 other mines that have been polluting at least moderately on each of these images. Most tributaries of the Kasai river are polluted by mines to some degree, but usually not that much.
Finally, it contaminated river Congo between 10 and 15 August: https://www.sentinelvision.eu/hyperlook/dfcfadc4ed8d40de9ff0529a82cd3ebc
glad you had a chnace to look atthe images Dave Petley generated in response to our assembly of data on the Catoca leak. Looking at all images including the sentinel there is no clear track tbetween Catoca and an any crossing into Congo. Impact is decsribed as on the Lova only and 100km. learly other source created the big event on July 30th at he Kasai point of confluence with all the feeds from Angola. There are much more likely candidadtes
for that event especially the new processing pant..big messy aand involving lots of chemical. Also the te new and smaller diamond mine is clearly associated in the Sentinel images with prior and ongoing. Noone has produced a single water sample..easy peasy why no water samples and what can we do pint point now if no one took samples then..A big bungle .Up close satellite images of each likely source( and that does not include Catoca in my opnion) within the time frame July 15th to August 9th ( including Catoca) would help solve the riddle. We have called on the United Nations to appoint a special rapporteur and we have asked Reuters, NY Times and Wall St Journal to fund those essential images. Congo clearly has a chronic ongoing very serious transboundary pollution problem from Angolan enterprises. The United Nations should be addressing that!!Angola needs a more responsible mine licensing and oversight system and it should specifically address the transboundary problem and the cumulative watershed load problem. This is where wise advocacy with long term benefit should be focused ot chasing Catoca as a polluter who must pay!!! ( we do support your call for action though and that is an important part of holding
Angola to account for its careless and irresponsible mineral extraction.www.worldminetailingsfailures.org Lindsay Newland Bowker Executive Director
The July 31 2021 Google Earth imagery shows more of the workings on the dam beach at Catoca, (placing rock from the mine) and the probable source of two fluid leaks at the toe. -9.366704,20.283612 Either a toe drain or bypass line outlet (seen in historic images) or piping seems to be the culprit. Is the rock on the beach plugging some piping, there’s no sign of filter fabric or graded material.