
20 March 2010
The water level and seepage at the Attabad landslide – graphs of the current situation
Posted by Dave Petley
Latest update: 25th March 2010 08:00 GMT
I thought it would be useful to post a graph of the current state of play with the water and spillway levels, as I understand it. The water level is from the NDMA daily(ish) updates; the spillway height comes from the freeboard measurement from FOCUS. Needless to say I have no way to validate this data.
Graph as of 23rd March 2010 (the last day for which I have data):
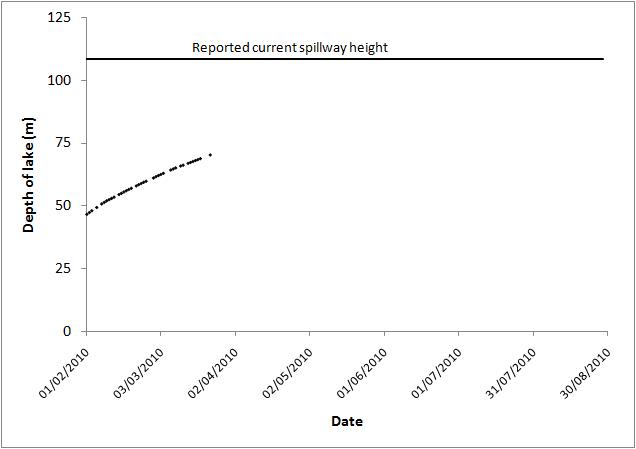
The graph starts on 1st February as this is when the NDMA data starts. Be very careful deriving a date upon which the lake will reach the spillway from this data as the spillway height is somewhat nebulous (can anyone give a definitive height?), it is of course being lowered, the rate of filling may change as snowmelt arrives, etc.
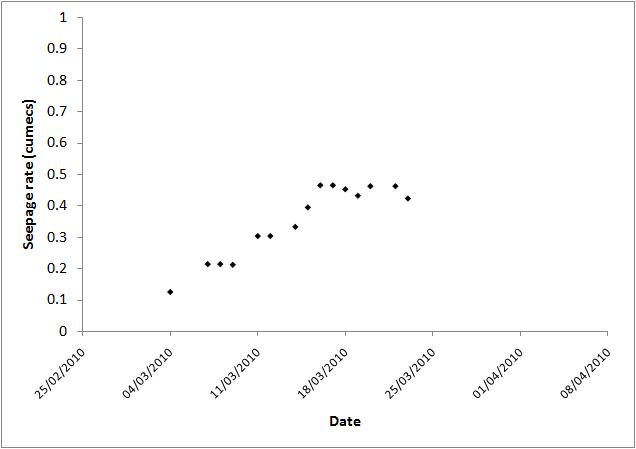
The graph of reported seepage rate is as follows:
 Dave Petley is the Vice-Chancellor of the University of Hull in the United Kingdom. His blog provides commentary and analysis of landslide events occurring worldwide, including the landslides themselves, latest research, and conferences and meetings.
It is of course being lowered, the rate of filling may change as snow melt arrives, etc.
The blog is written on a personal basis by Dave Petley, who is the Wilson Professor in the Department of Geography at Durham University in England.