
3 June 2009
Are satellite-based landslide hazard algorithms useful?
Posted by Dave Petley
In some parts of the world, such as the Seattle area of the USA, wide area landslide warning systems are operated on the basis of rainfall thresholds. These are comparatively simple in essence – basically the combination of short term and long term rainfall that is needed to trigger landslides is determined, often using historical records of landslide events. A critical threshold is determined for the combination of these two rainfall amounts – so for example, it might require 100 mm of rainfall in hours after a dry spell, but 50 mm after a wet period. These threshold rainfall levels have been determined for many areas; indeed, there is even a website dedicated to the thresholds!
In 1997 NASA and JAXA launched a satellite known as TRMM (Tropical Rainfall Monitoring Mission), which uses a suite of sensors to measure rainfall in the tropical regions. Given that it orbits the Earth 16 times per day most tropical areas get pretty good coverage. A few years ago Bob Adler, Yang Hong and their colleagues started to work on the use of TRMM for landslide warnings using a modified version of rainfall thresholds. Most recently, this work has been developed by Dalia Bach Kirschbaum – and we have all watched the development of this project with great interest. The results have now been published in a paper (Kirschbaum et al. 2009) in the EGU journal Natural Hazards and Earth Systems Science – which is great because NHESS is an open access journal, meaning that you can download it for free from here.
Of course a rainfall threshold on its own doesn’t tell you enough about the likelihood of a landslide. For example, it doesn’t matter how hard it rains, if the area affected is in a flat, lowland plain then a landslide is not going to occur. To overcome this, the team generated a simple susceptibility index based upon weighted, normalised values of slope, soil type, soil texture, elevation, land cover and drainage density. The resulting susceptibility map is shown below, with landslides that occurred in 2003 and 2007 indicated on the map:

A simple rainfall threshold was then applied as shown below:
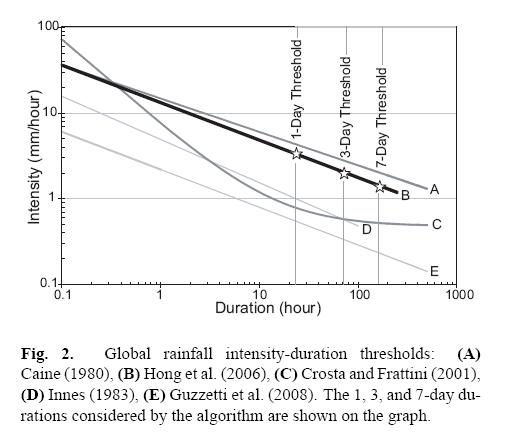 Thus, if an area is considered to have high landslide susceptibility and to lie above the threshold line shown above based upon an analysis using 3-hour data from TRMM, then a warning can be issued.
Kirschbaum et al. (2009) have analysed the results of their study using the landslide inventory datasets shown in the map above. Great care is needed in the interpretation of these datasets as they are derived primarily from media reports, which of course are heavily biased in many ways. Examination of the map above does show this – look for example at the number of landslide reports for the UK compared with New Zealand. The apparent number is much higher than in NZ, even though the latter is far more landslide prone. However, in New Zealand the population is small, the news media is lower profile, and landslides are an accepted part of life. However, so long as one is aware of these limitations then this is a reasonable starting point for analysing the effectiveness of the technique.
So, how did the technique do? Well, at a first look not so well:
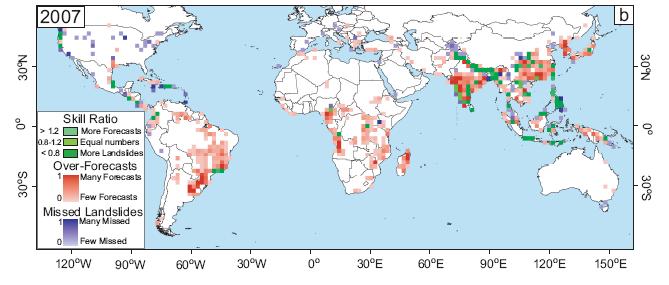
In many cases the technique failed to forecast many of the landslides that actually occurred, whilst it also over-forecasted (i.e. forecasted landslides in areas in which there were none recorded) dramatically. However, one must bear in mind the limitations of the dataset. It is very possible that landslides occurred but were not recorded, so at least to a degree the real results are probably better than the paper indicates. Otherwise, the authors admit that the susceptibility tool is probably far too crude and the rainfall data to imprecise to get the level of precision that is required. However, against this one should note that the algorithm does very well (as indicated by the green pixels on the map above) in some of the key landslide-prone areas – e.g. along the Himalayan Arc, in Java, in SW India, the Philippines, the Rio de Janeiro area, parts of the Caribbean, and the mountains around the Chengdu basin. In places there is marked under-estimation – e.g. in Pakistan, Parts of Europe and N. America. In other places there was dramatic over-estimation, especially in the Amazon Basin, most of India, Central Africa and China.
All of this suggests that the algorithm is not ready for use as an operational landslide warning system. Against that though the approach does show some real promise. I suspect that an improved algorithm for susceptibility would help a great deal (maybe using the World bank Hotspots approach), perhaps together with a threshold that varies according to area (i.e. it is clear that the threshold rainfall for Taiwan is very different to that of the UK). Kirschbaum et al. (2009) have have produced a really interesting piece of work that represents a substantial step along the way. One can only hope that this is developed further and that, in due course, an improved version of TRMM is launched (preferably using a constellation of satellites to give better temporal and spatial coverage). That would of course be a far better use of resource than spending $4,500 million on the James Webb Space Telescope.
Reference
Kirschbaum, D. B., Adler, R., Hong, Y., and Lerner-Lam, A. 2009. Evaluation of a preliminary satellite-based landslide hazard algorithm using global landslide inventories. Natural Hazards and Earth System Science, 9, 673-686.
 Dave Petley is the Vice-Chancellor of the University of Hull in the United Kingdom. His blog provides commentary and analysis of landslide events occurring worldwide, including the landslides themselves, latest research, and conferences and meetings.