
30 December 2008
Losses in catastrophes in 2008 – initial statistics from Swiss Re
Posted by Dave Petley
 Tropical Cyclone Nargis montage from the Brisbane Times
Swiss Re Sigma has just released its initial statistics on losses in catastrophes in 2008. Of course it is important to understand that reinsurance look at catastrophes in a particular way, meaning that the statistics are weighted in particular to low frequency – high magnitude events, rather than iterative processes, and to losses causing a high level of financial loss. There is no problem with this of course, but it is important to keep it in mind.
So what do the statistics show? Unfortunately the picture is pretty grim. Swiss Re estimate that these large loss events cost over 238,000 lives, most notably as a result of tropical cyclone Nargis in Burma (Myanmar), which led to 138,400 fatalities, and the Wenchuan (Sichuan) earthquake, which killed 87,400 people. In terms of economic losses, Swiss Re estimate that catastrophes cost about US$225 billion in 2008, of which about $50 billion was insured. The greatest costs were from the Wenchuan earthquake ($85 billion) and Hurricane Ike (USA) ($40 billion).
All in all 2008 has been the second worse year for insured losses on record (2005 was the worse because of Hurricane Katrina). I guess that this is unwelcome given the global financial malaise.
I have to say though that for me perhaps the interesting aspect is the following graph within the report (download a hard copy of the report here):
 So let’s take a quick look at the recent trends. First, the palest blue line is the total insured losses. There is a huge amount of scatter from year to year, but the general trend is clearly upwards. However, the other two losses show that this increase arises primarily from the weather related perils (the darker blue line). Over the last decade there is no obvious trend in losses from man-made disasters, with a single obvious peak in 2001 – no prizes for guessing the cause of that. Note also that very large-scale earthquake losses to the insurance industry are comparatively rare – most earthquakes occur in areas that have very low levels of insurance cover. Thus the 2005 Kashmir earthquake and the 2008 Wenchuan earthquake hardly appear on the above graph.
The trends in losses interests me greatly. I wanted to check that there is a net increasing trend in losses from weather-related perils. A quick, back of the envelope graph shows that there is indeed a clear upward trend:
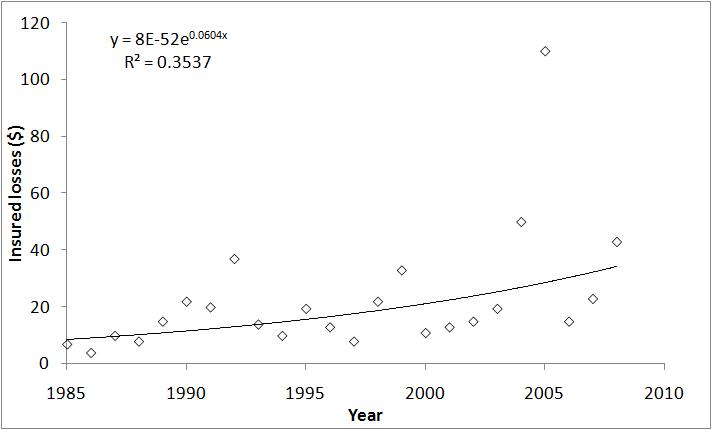
I fitted a fairly simple exponential function above, although it may not necessarily be the best choice. There is a very clear upward trend in insured losses from natural perils. This rise in economic losses from natural perils is generally ascribed to increasing vulnerability – i.e. we have more economic assets in the “firing line”. However, note that insured losses from man-made perils are not following the same trend. Presumably, this is also the case for man-made perils, but in this case the improvement in management and control is keeping track.
I will return to these data in the future.
 Dave Petley is the Vice-Chancellor of the University of Hull in the United Kingdom. His blog provides commentary and analysis of landslide events occurring worldwide, including the landslides themselves, latest research, and conferences and meetings.
Dear Prof, I think what you meant with the para 3 is Katrina and not Hurricane Mitch. Best, Jonatan LassaBonn
Thanks Jonatan, you are quite right. Now corrected.Dave
Thanks for this news, Its really bad.