
27 June 2008
TRMM and landslide monitoring
Posted by Dave Petley
One of the most admirable science projects at NASA at the current time is an attempt to create a global landslide and flood warning system using the Tropical Rainfall Monitoring Mission satellite data. TRMM using a precipitation radar system to provide near real time data on the intensity of rainfall in the tropical and subtropical regions. NASA then make these data available on the TRMM website.
The usefulness of these data can be illustrated using the last seven days of rainfall in Asia. During this time the monsoon has strengthened – we are just moving into the real wet season in south and SE. Asia. Furthermore, the first really destructive tropical cyclone of the year has just tracked across the Philippines and then made a more-or-less direct hit on Hong Kong, before dissipating in southern China. As well as causing the sinking of a passenger ferry, this typhoon also deposited large volumes of rain that have been responsible for extensive landslides and floods. Using TRMM it is possible to obtain an estimate of the volume of rainfall that has fallen in Asia over the last week (Fig. 1). This does come with a caveat, which is that the spatial distribution of rainfall is very variable at the local scale, which this instrument does not resolve. Nonetheless it does provide a really interesting indication of the rainfall distribution.

 Figure 1: TRMM image of the rainfall distribution for the seven days to 27th June 2008 at 06:00 UTC. Note the high rainfall totals for the Philippines and S. China, generated by the passage of Typhoon Fengshan (click on the image for a better view).
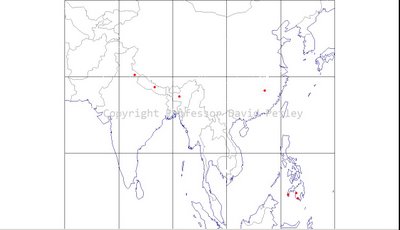
The locations of high rainfall appear to correlate with areas of flooding – for example, in this time floods were reported in the Central Philippines, South China around the Pearl River delta and in parts of N. India. Unfortunately, the correlation with fatal landslides at least is far poorer. Figure 2 shows the locations of fatal landslides that I have recorded in the same time period. A caveat is that perhaps not all the landslides in China have yet been reported, so the map in Figure 2 might change a little. However, it is clear that a simple rainfall total algorithm is not enough to provide a really good indication of the distribution of fatal landslides at least.
The team at NASA are working hard on their landslide algorithm and are doing a terrific job. This is one of the most interesting landslide projects underway at the moment. I am hoping that they will present some interesting progress in this work at the International Symposium on Landslides and Engineered Slopes in China next week.
 Dave Petley is the Vice-Chancellor of the University of Hull in the United Kingdom. His blog provides commentary and analysis of landslide events occurring worldwide, including the landslides themselves, latest research, and conferences and meetings.