
4 May 2008
The Taihape Landslide monitoring project
Posted by Dave Petley
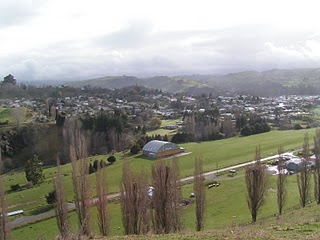
 Last summer I was lucky enough to spend a couple of days with my friends from GNS Science who are undertaking a monitoring project on the Taihape landslide in New Zealand (see Google Earth image right). Taihape, which is located as -39.68°, 175.80°, is described on Wikipedia as “a small, picturesque town near the middle of the North Island . It services a large rural community and lies on the main north-south route through the centre of the North Island.” It has a population of about 2000 people and is in general a very nice little place. Unfortunately, the area around the town is somewhat landslide prone (actually, mapping landslides here would probably involve trying to find those few areas that have not been affected by mass movements!).
 Perhaps not surprisingly, part of the town is built on a landslide, which moves (slowly) during periods of wet weather. The landslide is certainly not new – dating suggests that it first moved over 1,800 years ago. Nonetheless, the level of recent movement, although slow and gentle, can cause some damage to buildings and roads in the affected area of the town. The landslide is a translational block slide with a shear surface at about 25 – 35 m depth. It’s pretty big – over 200 houses and a school are sited on it. Movement appears to be associated primarily with rainfall. Details of the landslide are available here.
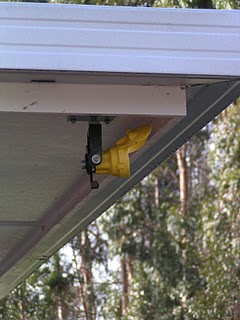 Hence for the last year or so the hugely impressive chaps from Geonet have been working with GNS Science to monitor the movement of the landslide. In my view this is about the most impressive monitoring project I have seen to date. The data are collected by an automated laser monitoring system that sights onto prisms located on the landslide. This is supplemented by two rain gauges and four borehole piezometers. Excitingly, the data are available in graph form online in real time, so that anyone can see how the landslide is behaving. The data are available here, which uses a Java graphing tool. It takes a few minutes to load, but stick with it as it is fantastic. The results are great fun. You can plot side by side the movement recorded by different prisms and relate this to the groundwater level and the amount of rainfall. Although there hasn’t been much rainfall since the monitoring started, it is already possible to see the link between rainfall, groundwater and movement. It is really worth playing with the graphing function.
The strength of this project is in its thoroughness and its transparency. The monitoring system being used is about as good as is possible using current technology, and the team are taking great care to quantify and deal with the potential errors. The fact that the results are online is hugely impressive. I can only wish that more landslide movement data was available in this way.
 Dave Petley is the Vice-Chancellor of the University of Hull in the United Kingdom. His blog provides commentary and analysis of landslide events occurring worldwide, including the landslides themselves, latest research, and conferences and meetings.