19 September 2016
Ms. Callaghan’s Classroom: Sampling from the Sea
Posted by larryohanlon
This is the latest in a series of dispatches from scientists and education officers aboard the National Science Foundation’s R/V Sikuliaq. Jil Callaghan is a 6th grade science teacher at Houck Middle School in Salem, Oregon. She is posting blogs for her students while aboard the Sikuliaq as part of a teacher at sea program through Oregon State University. Read more posts here. Track the Sikuliaq’s progress here.
By Jil Callaghan
Dated: 17 September 2016
We’re Doing CTDs all the time! What are they??
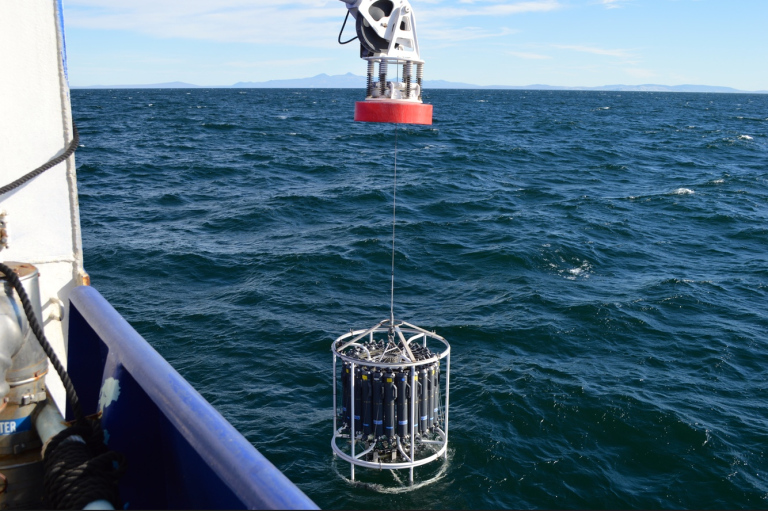
Out here in the Arctic Ocean, the scientists on board are collecting water samples using a piece of equipment we call the CTD. CTD stands for Conductivity (which tells you the salinity or how much salt there is in the water), Temperature, and Depth.
Sensors tell us the conditions in the part of the ocean where the sample was taken from. As the CTD goes down to the bottom and comes back up again, the sensors are taking readings 24 times a second of conditions such as temperature, oxygen, density, and salinity (how salty it is).
Over the years, scientists sample from the same locations in the ocean, allowing them to see how the ocean is changing over time.
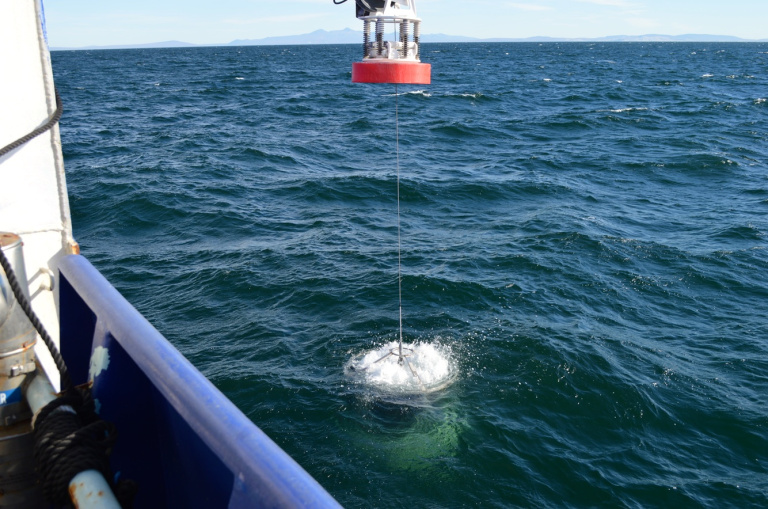
As the CTD gets lowered down to the bottom of the ocean, the constant data collected by the sensors helps us to understand the layering that goes on in the ocean.
Typically we take water samples from just above the bottom of the ocean, at the level where the graph tells us that there’s the most chlorophyll (based on real time data from the sensors), and just below the surface. So far we have taken samples from 62 locations!
Laurie Juranek from OSU is mainly sampling water from the surface of the ocean for her studies, but she is using some of the water collected during CTDs to compare how conditions are different from what she’s seeing at the surface.
Miguel Goñi from OSU is mapping the abundance of particles and where they came from. Using chemistry, he can tell if those particles came from the land or from the ocean. He’s collecting evidence about the productivity of the ocean. There are tiny, microscopic organisms in the ocean called phytoplankton that, just like plants, use sunlight and carbon dioxide to make their own food (sugar). By looking at the nutrients and the carbon in the water samples, the scientists can figure out what’s going on in the ocean – how much the phytoplankton are growing and dying.
The scientists from VIMS (the Virginia Institute of Marine Science) are looking for organisms that are nitrogen-fixers. That means that the organism takes nitrogen (N2 gas) out of the water and can use it for food. Not many organisms can do this because N2 has a triple bond between the nitrogen atoms, which makes them hard to break apart. By breaking apart N2, nitrogen fixers allow nitrogen to be available to other marine organisms; it’s a way to get new nitrogen into the ocean. The VIMS team is also looking at how much algae, phytoplankton (microscopic marine plants), and nutrients there are in different parts of the ocean at different depths.
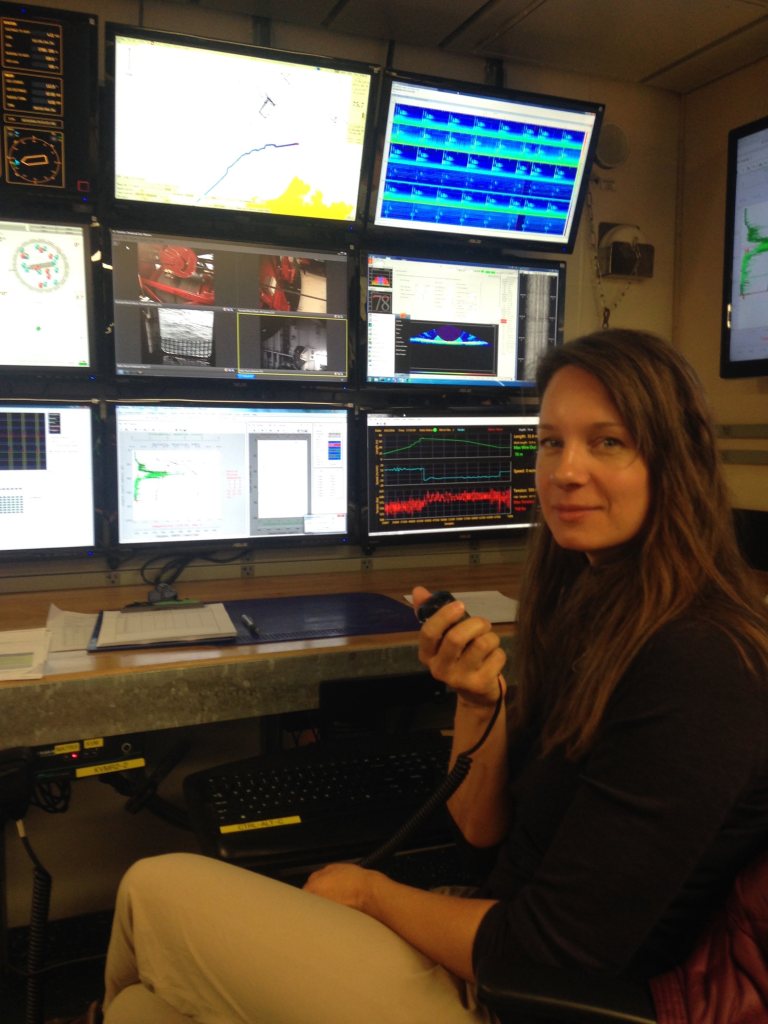
It’s fun to talk on the radio to the winch operator!
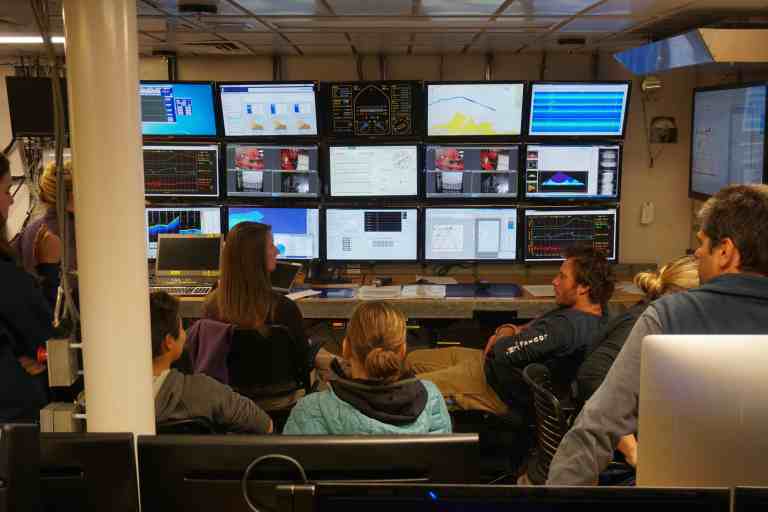
There’s a lot of data that scientists use! This is during a CTD cast (when we send it over the side of the ship) where I’m driving. Once the graph shows us where the sensors are detecting the most chlorophyll, the scientists determine what depth they want us to sample from.
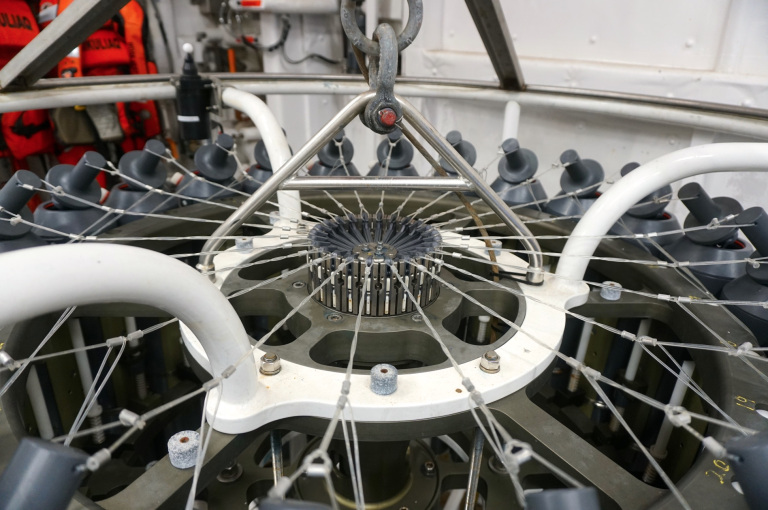
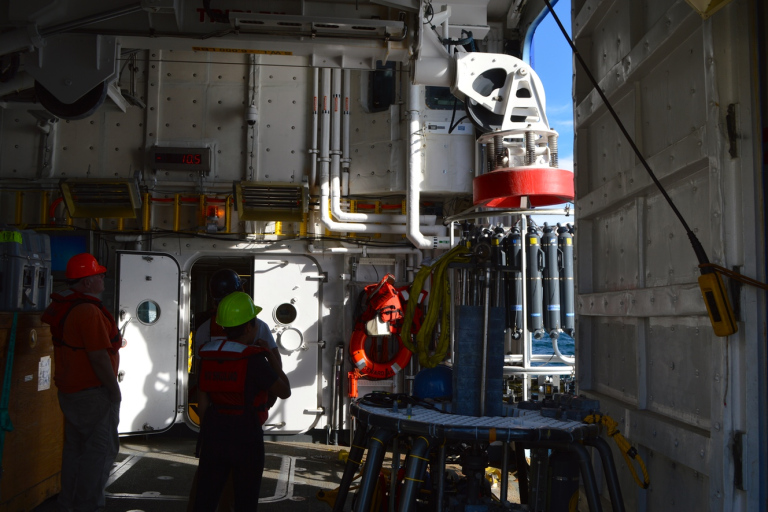
When we “fire” a bottle by clicking on a button on the computer in the control room, it releases the wire and allows the bottle to close, trapping ocean water inside.
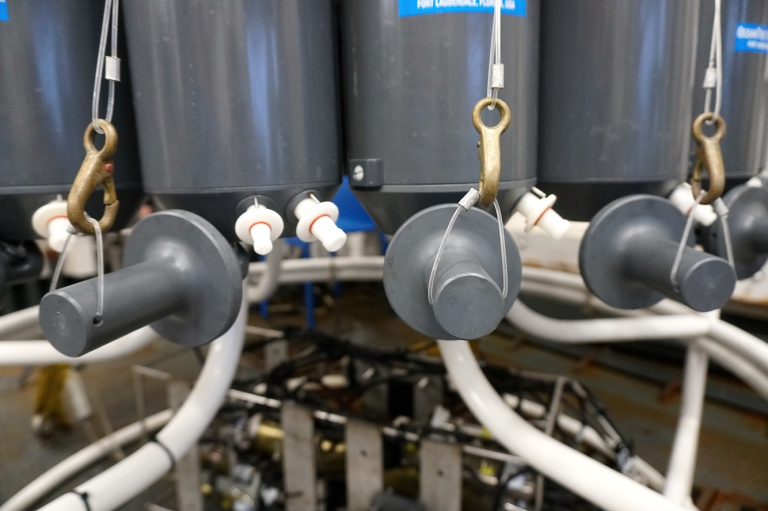
The gray part seals the bottom of the bottle when we fire that particular bottle, and the white nozzles are where we get the water out of the bottles once it comes back up onto the ship.
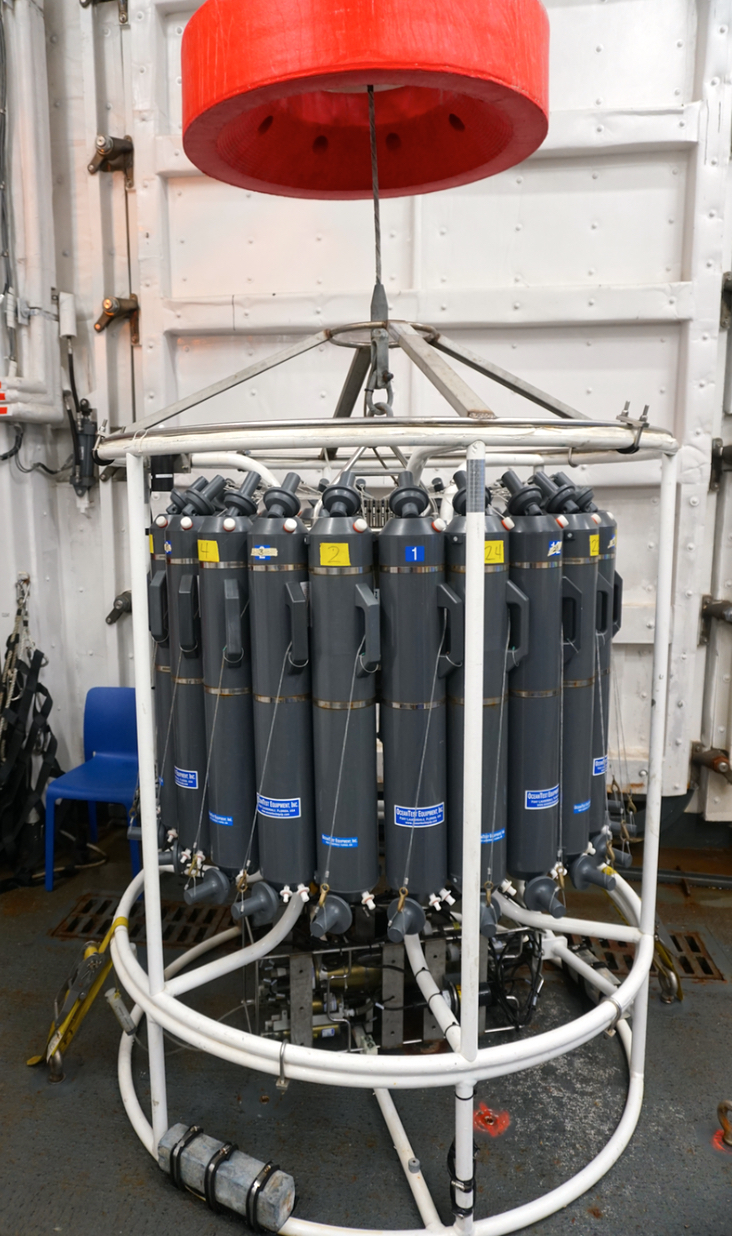
The sensors are in the box on the bottom in the center. The box is called the “seabird” and when we give directions to the winch operator, we’ll say “pay out to ____ m on the seabird” and when we want them to raise it up, we ask them to “haul in to ____m on the seabird.”
CTD casts are a big part of what we are doing on this research cruise, along with getting sediment samples from the ocean floor using our multi-core and dragging an instrument we call the “super sucker” that sucks in seawater from various depths as the ship is moving. In order to do a CTD or multi-core, the ship has to come to a stop. When we use the super sucker, we tow it behind the ship and so the ship has to be moving. Although we’re using different instruments to collect data, the CTD has been the most common method. We’ve done about 40 CTDs so far!
This post was originally published on thedynamicarctic.wordpress.com