
20 May 2016
Data science for collaboration and community-building
Posted by Nanci Bompey
By Tom Narock
This is part of a new series of posts that highlight the importance of Earth and space science data and its contributions to society. Posts in this series showcase data facilities and data scientists; explain how Earth and space science data is collected, managed and used; explore what this data tells us about the planet; and delve into the challenges and issues involved in managing and using data. This series is intended to demystify Earth and space science data, and share how this data shapes our understanding of the world.
Many of us are interested in social networking sites like Facebook. In addition to cat videos and food pictures, it’s a great way to keep up to date and engage with friends. Recently, it’s even become a way to share and engage in science. Yet, there’s another, sometimes overlooked, aspect of social networks that can contribute to better science—analysis of the underlying network itself. In regards to Facebook, I’m often asking, How many of my friends know each other? How many connections separate two friends who don’t know each other?
In the world of data science this is called network analysis or, when specifically applied to people, social network analysis; and it got me thinking. What does the AGU’s network look like? Tens of thousands of people attend the Fall AGU meeting each year. How are they connected? Who has worked (co-authored) with whom? Who are the most central people to the AGU? How can we use this information to better what we do?
Fortunately, AGU meeting data is open (and in a form convenient for machine processing) so we can use data science to explore these questions. For this post, we’ll limit ourselves to looking at one group within AGU over last five years of Fall Meetings (2010-2015). Since our topic is data science, let’s look at the data-oriented folks within the Earth and Space Science Informatics Focus Group (ESSI).
PageRank is an algorithm developed by Google to rank websites in their search engine results. The algorithm is a way of measuring the importance of web pages by counting the number and quality of links to a page and using this to determine a rough estimate of how important the website is. An underlying assumption of PageRank is that more important websites are likely to receive more links from other websites. Here we’re dealing with people and not websites, but the same idea applies. If we consider co-authoring an AGU presentation as a mutual link (a link from me to each of my co-authors as well as links from them back to me) then we can construct a directed graph and explore the connections amongst people. Unlike Google, we’re not using PageRank to determine importance. We’re more interested in using the algorithm to identify the most central people within ESSI. Since PageRank values the rank of incoming links, a high PageRank is indicative of someone who collaborates often as well as someone whose co-authors are themselves influential. There are many ways to analyze a network. This example highlights collaboration and gives us a sense of how much of it is happening and with whom.
How do we determine the PageRank? Well, many of the tools and techniques we’ll need for this type of analysis are readily and freely available. Numerous data science libraries exist in several different implementations. The results in this post were obtained using the Python programming language and several open source libraries such as networkx.
So, who are the most central people in ESSI over the last five years? To name a few, there’s Chris Mattmann, Kerstin Lehnert, Steve Miller, and Peter Fox. Visualizing the full ESSI network is challenging given the number of people and connections involved. If we limit our visualization to just 2015, then we can see the ESSI network in Figure 1. Each red dot in the figure represents an individual whose name appeared on an AGU presentation in an ESSI session in 2015. For illustration purposes, names have been removed from the nodes. If two dots are connected, then those people appeared as co-authors on a presentation.
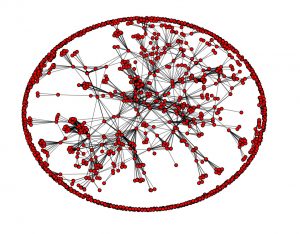
Figure 1. The AGU ESSI co-authorship network in 2015.
Figure 2 shows a zoomed in view of this network, which highlights one of the dense clusters of interconnected researchers.
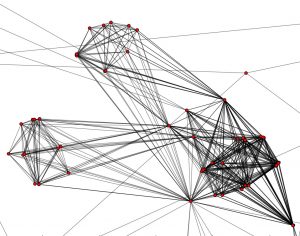
Figure 2. A closer look (lower left) of the many connection in the ESSI 2015 network.
From this analysis we can determine that the aforementioned individuals are central to AGU’s informatics and data science efforts. This information is beneficial for an organization as it seeks to understand and develop outreach, engagement, and leadership opportunities. There’s nothing wrong with having a few key collaborators you work with regularly. Yet, when combined with other data this may reveal opportunities for collaborative event planning and new initiatives.
For example, some of the people on the outskirts of Figure 1 have few connections because
they are new to the field. Future software tools can leverage network analysis such that students and early career scientists can easily identify key projects and people in their field. But if we’re going to use data to drive our decision making then we need to do so properly. There’s a whole host of data management issues that need to be considered—many of which have been very well described by others in previous posts in this series. Data scientists spend 60% of their time cleaning and preparing data. The AGU data is no different. I appear in the historical AGU records as T. Narock, T. W. Narock, and Thomas Narock. A fair amount of disambiguation had to be applied to consolidate data and obtain the above results. Serious use of data driven decision making requires a long-term data management policy.
Facebook, LinkedIn, and many other companies are using these techniques to enhance their business. The AGU and similar organizations can do the same, but with the goal of enhancing communication, collaboration, and inclusion. The simple analysis in this post only considers one AGU Focus Group. The potential exists for data driven discoveries across the whole of AGU. Topic analysis, keyword trends, and collaboration across disciplines are a few examples of the types of analysis that can be done and ultimately integrated into the AGU strategy and structure. Many for-profit companies are using data science to enhance their bottom line. Let’s do the same for the enhancement of science.
—Tom Narock is an Assistant Professor of Information Technology at Marymount University.