
22 December 2015
Hydrothermal Hunt: Mapping Earth’s Ocean Seafloor
Posted by lhwang
This is the latest in a series of dispatches from scientists and education officers aboard the Schmidt Ocean Institute’s R/V Falkor. On this voyage, scientists aboard the research vessel Falkor hoped to shed light on the Mariana Back-arc, which was expected to be teeming with activity and life. Over the course of their 27 day mission at sea they explored the back-arc spreading center to find new sites of hydrothermal activity and to better understand the physical, chemical, and geological forces that shape biodiversity in these unique ecosystems. Read more posts here.
Note: This post has been corrected. The original version had an image that was not relevant as well as incorrect radar altimetry information.
by Susan G. Merle
Opening Google Earth and looking at the seafloor graphics, it is easy to get the impression that we know what the entire ocean bottom looks like. You can see underwater mountains (seamounts), deep valleys (trenches) and the general lay of the “land.” The majority of the data on the ocean floor is actually derived from radar altimetry acquired by satellites (1,850 meters resolution).
Resolution
Data resolution is a measure of the accuracy or detail that one can resolve. The sea surface measured by satellites actually rises above seamounts and falls above trenches due to Earth’s gravity. It is this small difference in height (a few centimeters) that is used to estimate depth values for the 90 percent of the world’s oceans that have not been mapped by ships.

The research ship Tangaroa using sonar for higher-resolution seafloor mapping.
Credit: NIWA
Only about 10 percent of the seafloor has been mapped with ship’s sonar, and those surveys vary in resolution from ~10 meters nearshore (33 feet) to ~100 meters (330 feet) in the deepest regions of the ocean. High-resolution (1 meter or less) ocean floor data can be collected with remotely operated vehicles (ROVs) and autonomous underwater vehicles (AUVs) “flying” close to the seafloor, but those vehicles can only map small areas, and are not practical for mapping wide swaths of the ocean floor. Areas where ship sonar data have been gathered are incorporated with the satellite data, providing a better picture of the seafloor – but this is still in orders of magnitude less detail than what is available on land.
A Lack of Data
The lack of high-resolution seafloor data became tragically clear when the Malaysian airline jet MH370 went down in the Indian Ocean in 2014. There were no high-resolution ocean bottom maps available in the search area, which made locating the lost airliner effectively impossible. Much of the effort since then has been directed to surveying that part of the ocean floor. We know more about what the surface of the moon looks like than the bottom of the ocean, which is 70 percent of our planet. Perhaps it is time to search for new worlds right here on our planet, beneath the waves, on the ocean floor.
Susan G. Merle is a senior research assistant at Oregon State University’s Cooperative Institute for Marine Resources Studies as part of the NOAA EOI (Earth-Ocean Interactions) Program.
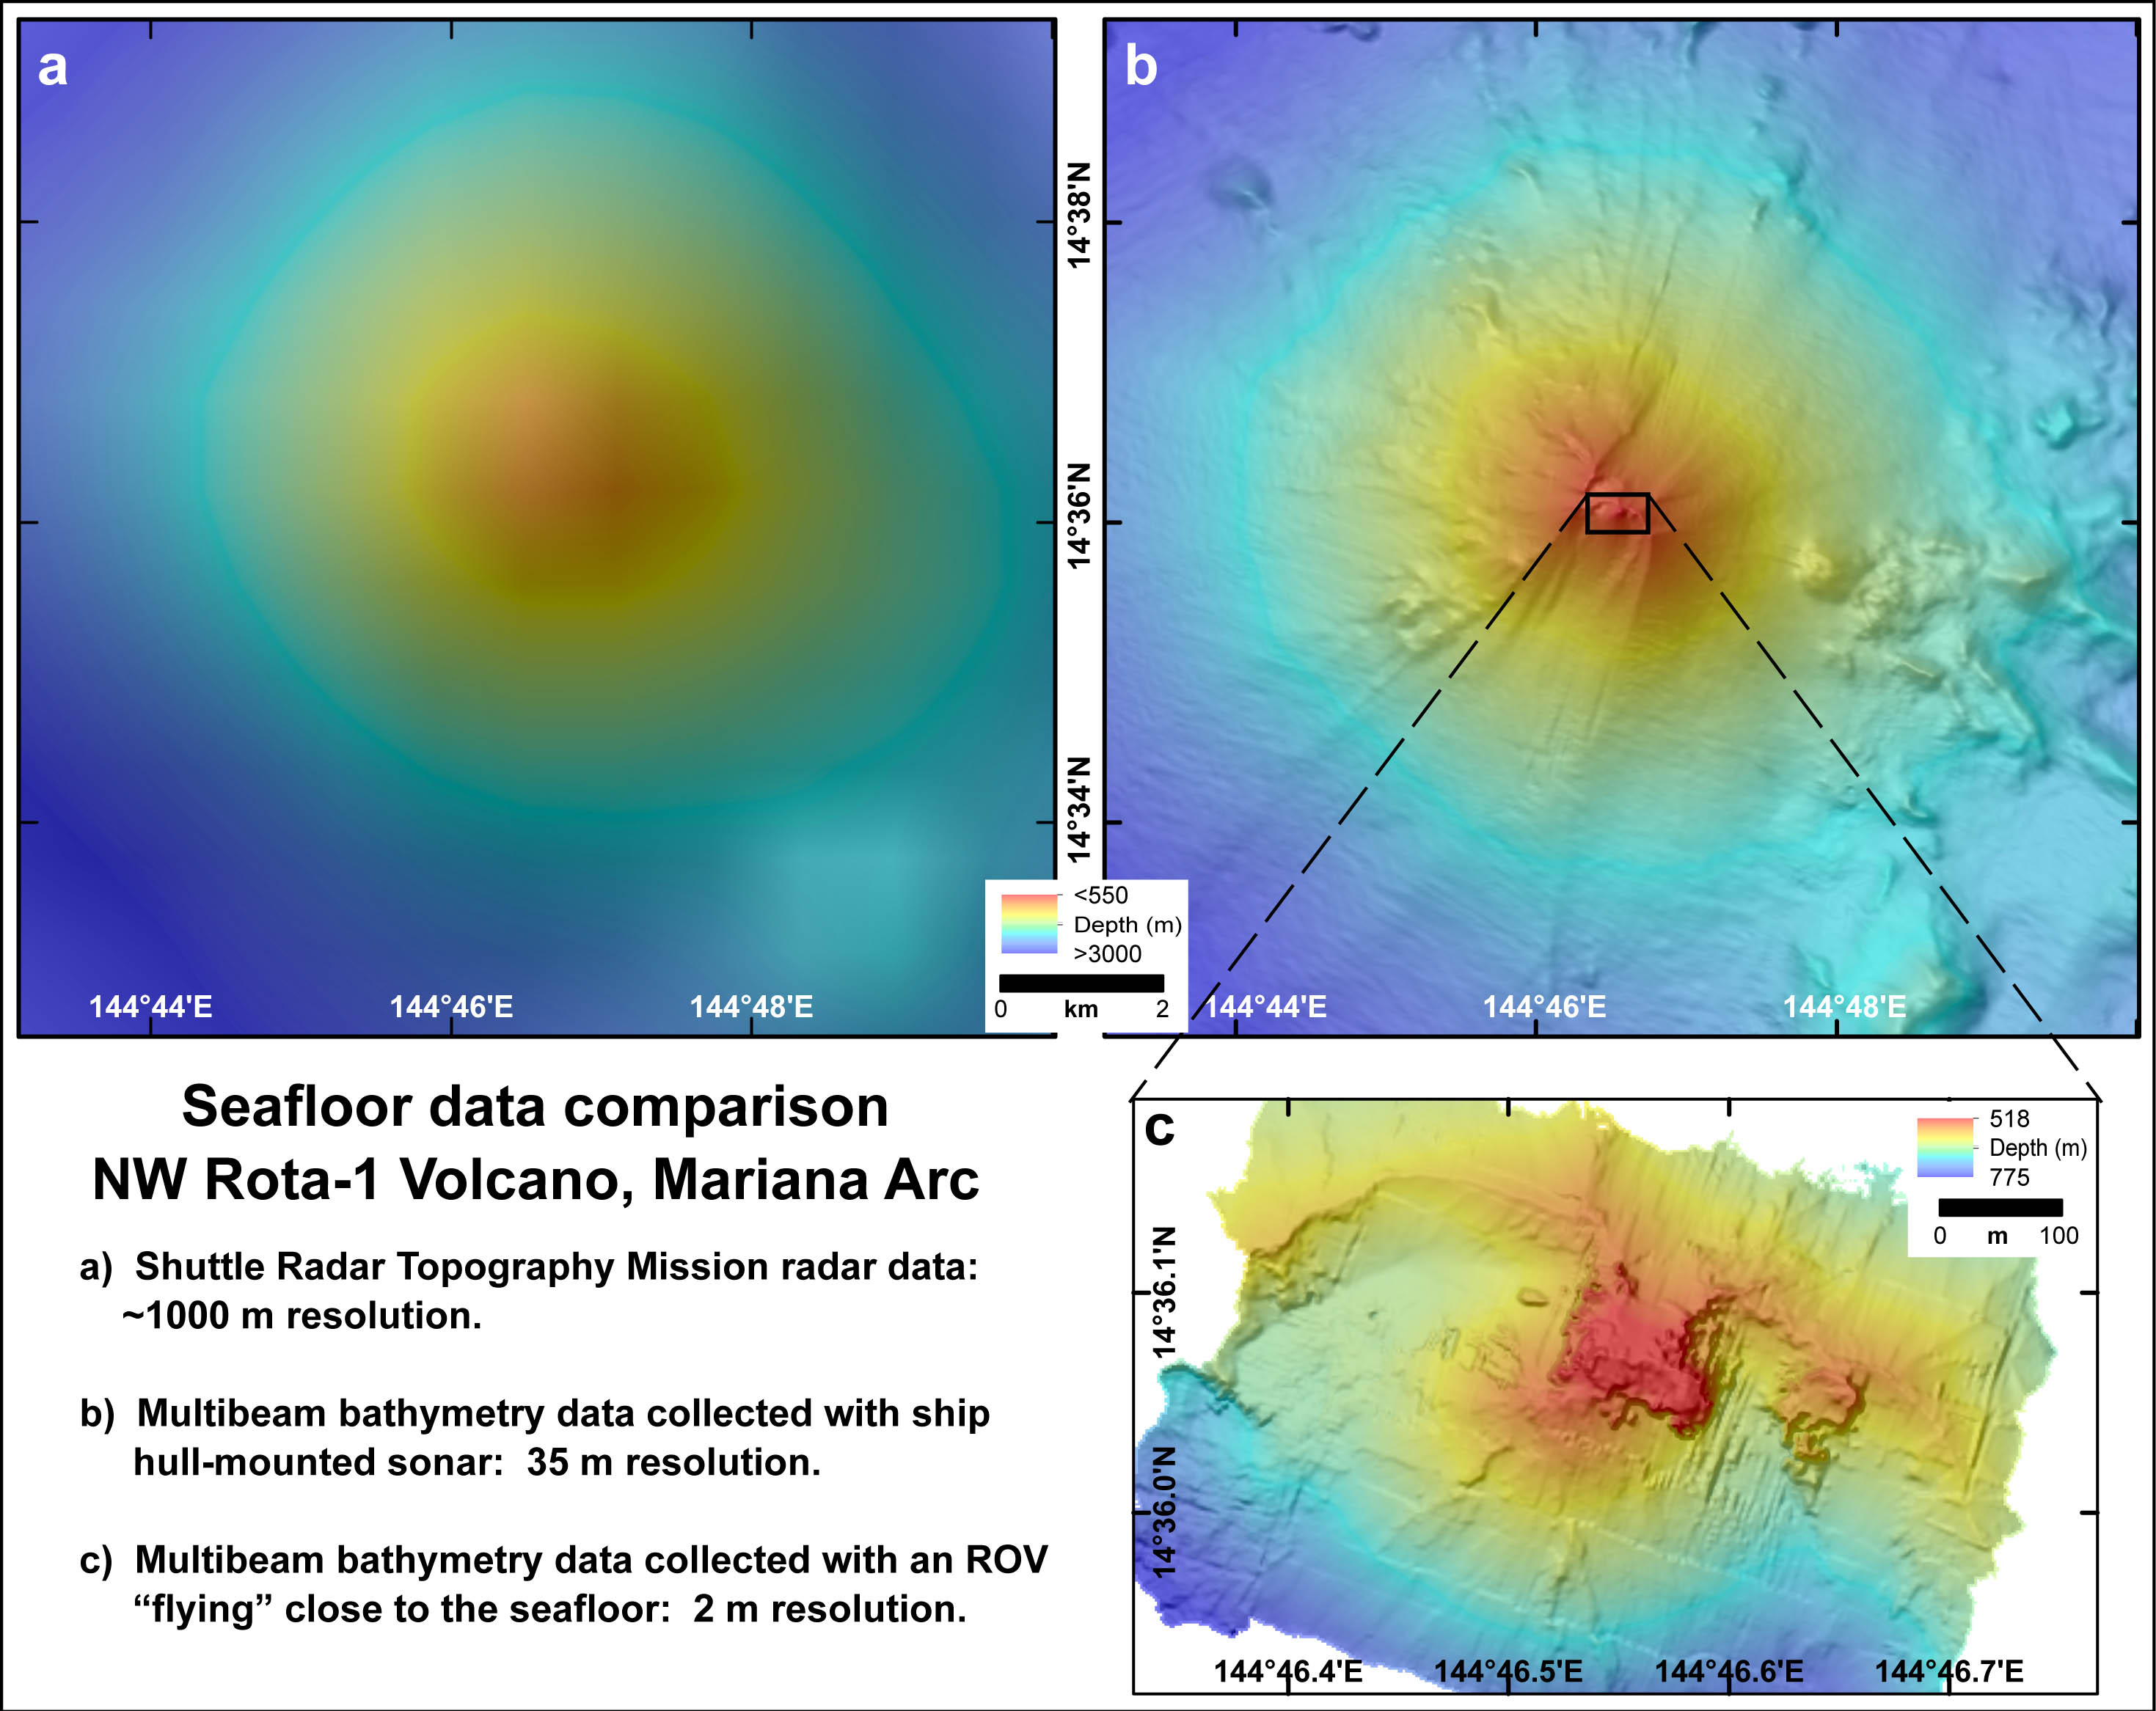
Comparison of seafloor maps collected using 3 different systems at NW Rota-1 volcano in the Mariana Arc. Panels a and b are the same area but at different resolutions. Panel c represents only the summit of the volcano (extent of the map is indicated by the black box in panel b).
Credit: Susan G. Merle
The Shuttle Radar Topography Mission (SRTM) that flew on the NASA Shuttle Endeavour in February 2000 did not have a radar altimeter. It was designed to measure topography of the Earth’s land surface at roughly 30 m resolution using interferometric synthetic aperture radar. It did acquire a small amount of data over the oceans near the coasts, which was used to better constrain the absolute elevations of the land surface. For more information on SRTM, see http://www2.jpl.nasa.gov/srtm/.