
6 October 2014
Scientists turn Hurricane Sandy destruction into future readiness
Posted by kwheeling
By Kate Wheeling
As Hurricane Sandy barreled toward the East Coast in late October 2012, a laser-equipped airplane took to the skies above New Jersey to measure ground elevation along the state’s coast. The United States Geological Survey (USGS), which deployed the plane, has used lasers to make detailed maps of ground height for more than a decade, and Sandy was a unique opportunity to see how a storm could influence coastal landscapes.
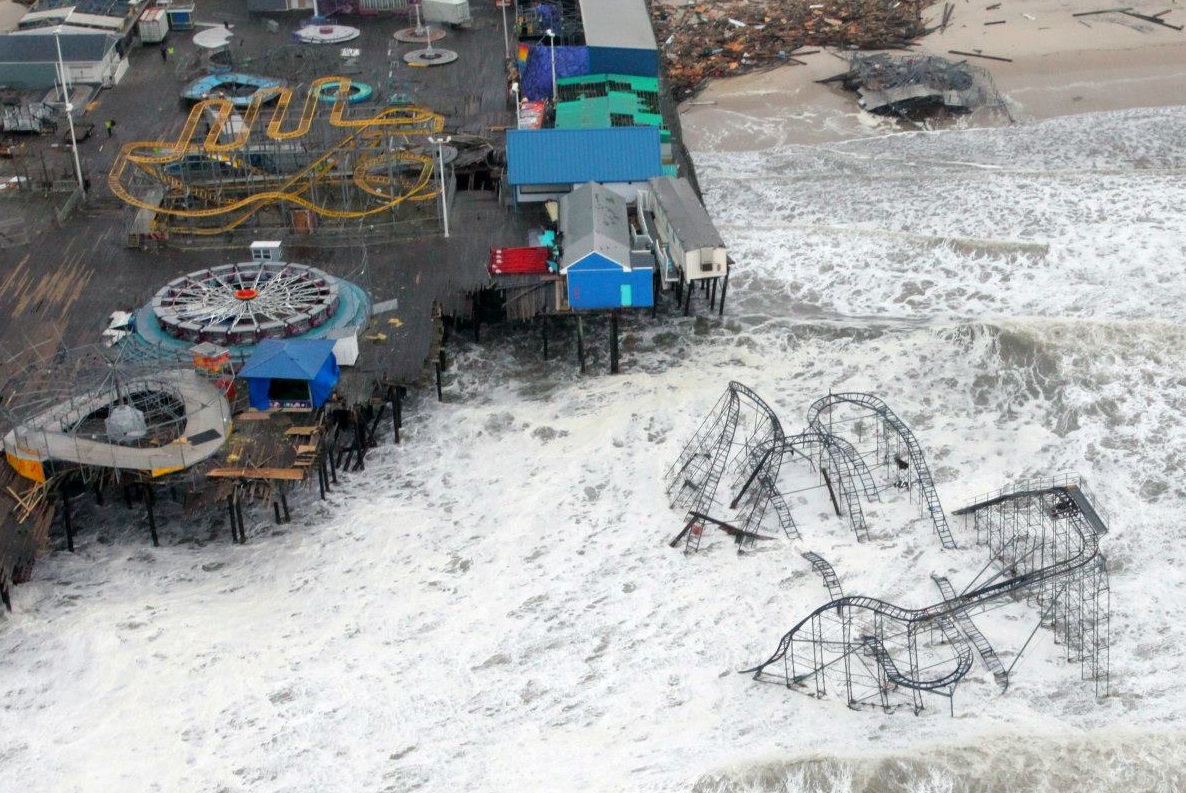
The end of the Casino Pier at Seaside Heights, New Jersey, was swallowed by Hurricane Sandy in October 2012.
Credit: New Jersey Army National Guard
As the hurricane waned, the same plane took off again, covering the same flight path from before the storm. But its lasers showed that the ground below had changed. Nearly every beach surveyed had lost sand, but all of them had changed substantially. The starkest change observed took place at Seaside Heights, New Jersey, where a large portion of a pier disappeared into the storm swell, turning the town’s roller coaster into an off-shore attraction – and an icon of the storm’s might.
This December, USGS will release a beta version of interactive computer models created from data collected by that laser-equipped plane—known as the second generation Experimental Advanced Airborne Research Lidar (EAARL-B)—and other equipment that mapped and monitored the New Jersey coast. The online portal will allow anyone to look at storm intensities and directions, evaluate wave attack scenarios and coastal vulnerabilities, and anticipate the impacts to landscapes ahead of time, said Neil Ganju, a USGS research oceanographer, at a 19 September congressional briefing on the Department of the Interior’s response to Hurricane Sandy.
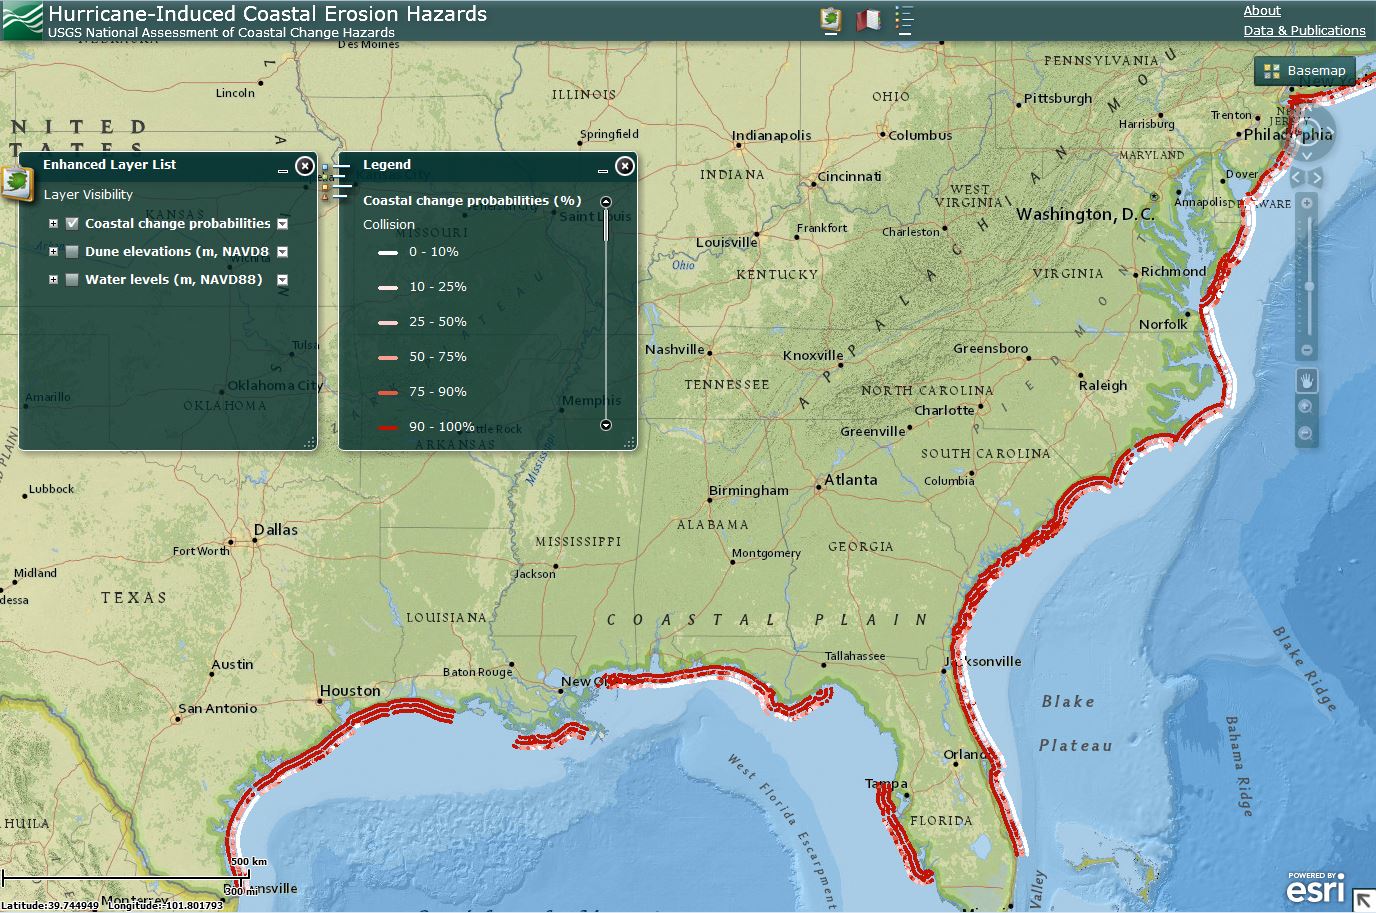
This December, USGS will release a beta version of interactive computer models created from data collected by laser-equipped planes and other equipment that mapped and monitored the New Jersey coast to help land managers identify the areas most at risk during severe storms.
Credit: USGS
“What we do with those maps and measurements is synthesize them together to build models,” Ganju told the briefing audience, which included several members of the Congressional Research Service, conservation societies such as the American Littoral Society, and the press. “Landscape changes have a fundamental impact on human infrastructure and natural habitat,” he noted, and such models could “help land managers make decisions about which land areas are most vulnerable.”
Along with Ganju, Mary Foley, Chief Scientist for the National Park Service, and Eric Schrading, the New Jersey Field Office Supervisor for the U.S. Fish and Wildlife service, spoke about their agencies’ use of science to help coastal communities be more resilient.
Ganju presented maps created by USGS researchers from data gathered along the New Jersey coast before and after Sandy, where red areas indicate a loss of elevation, and blue areas represent gains. Every beach surveyed was orange on the resulting maps. The chewed off pier at Seaside Heights was a smear of red.
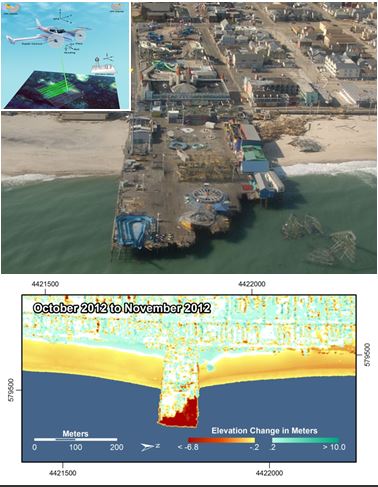
In the maps created by USGS researchers from data gathered along the New Jersey coast before and after Sandy, red areas indicate a loss of elevation, and blue areas represent gains. The chewed off pier at Seaside Heights was a smear of red.
Credit: USGS
But, a map “doesn’t tell you about the processes that led up to that landscape change,” said Ganju. To observe those processes, researchers need continuous measurements of storm surges, waves, sediment movements and other factors, he noted.
USGS researchers are deploying novel combinations of instruments that measure those processes, according to Ganju. An instrument network, called SWaTH, combines temporary, storm-deployed gauges to measure wave heights and barometric-pressure with long-term stations that collect baseline data on coastal regions. (SWaTH stands for Surge, Wave, and Tide Hydrodynamic.)
The network will feature an unprecedented spatial coverage of extreme water levels and waves along the coast during the next storm,” said Ganju. “The instruments aren’t novel but the application and the real-time aspect certainly are.”
Claude Gascon, emcee of the briefing, noted that Congress called on USGS, the U.S. Fish and Wildlife Service and the National Park Service after Hurricane Sandy to direct emergency funds towards helping with the rebuilding of the coasts and their communities.
“There is firm belief,” said Gascon, Executive Vice-President and Chief Science Officer at the National Fish and Wildlife Foundation, which hosted the event, “that science and its application to real life needs, can and will make a difference, build more resiliency in these systems and [help them] withstand future extreme storms.”
– Kate Wheeling is a science writing intern in the AGU’s Public Information department.