
April 18, 2022
A 50-year Project on Columbia Glacier Annual Monitoring 1984-2022, 39 Years In
Posted by Mauri Pelto
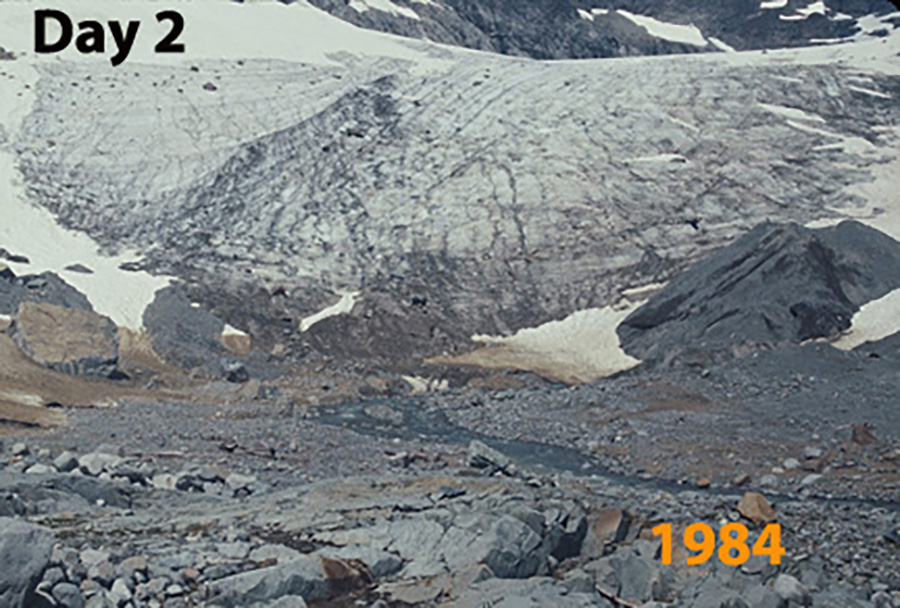
1984-Landsat 5 is launched. The North Cascade Glacier Climate Project was initiated on Earth Day in 1984 with a goal of observing the impact of climate change on glaciers across this mountain range for 50 years. This was in response to a call to action by the National Academy of Sciences to have a project that monitored glaciers across an entire mountain range in the United States, and from climate scientist Stephen Schneider who challenged glaciologists at an IGS meeting in 1983 to begin the monitoring now, in order to identify the full scope of change. 50-Year Project of Glacier-article in National Geopraphic work
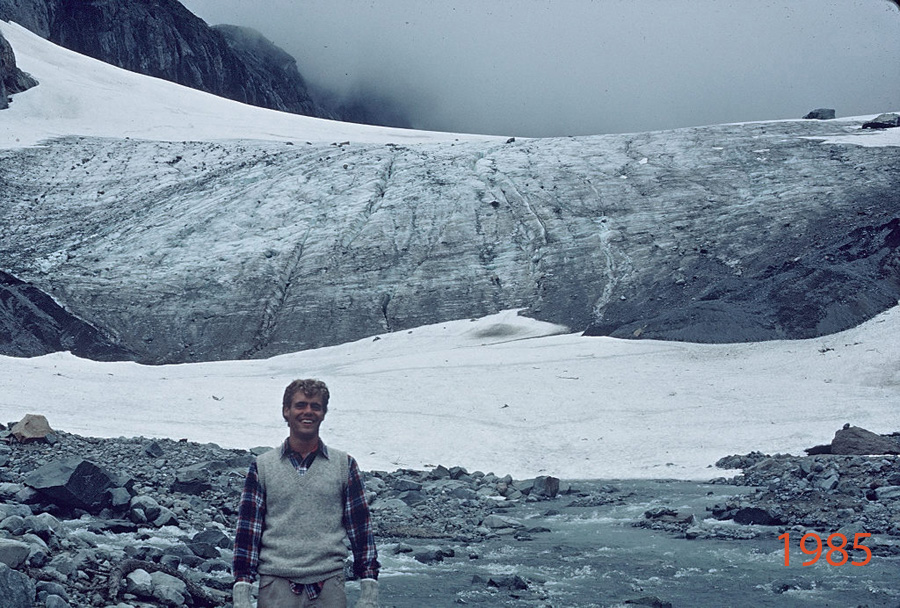
1985- 150,000 year climate record from Antarctic Ice Core . Snow covers the terminus of the glacier at the start of August note lateral moraines it is pressed up against.
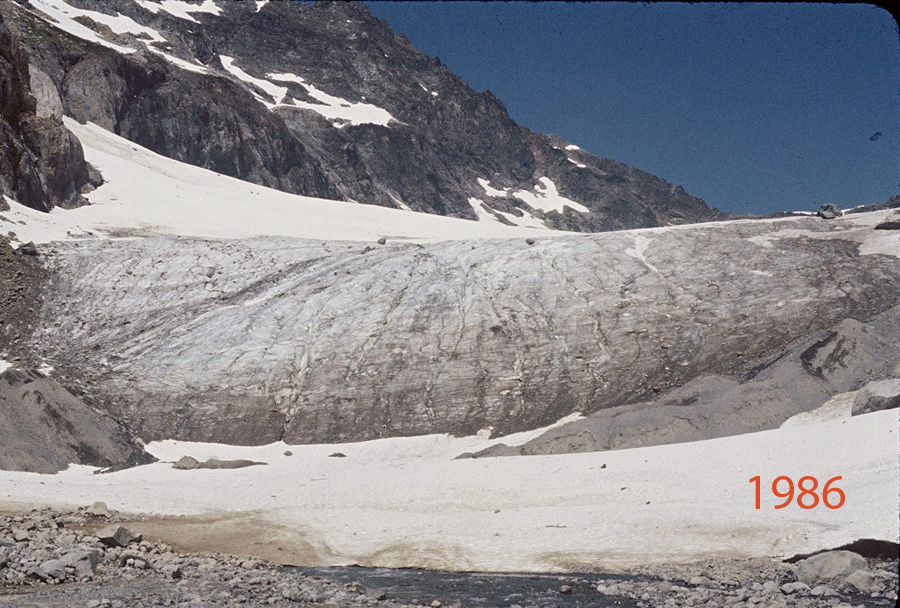
1986-Glaciers and Ice Sheets and Sea Level: Effect of CO2 induced Climate Change-Conference Proceedings published. Thinning in 1985 and 1986 is exposing the lateral moraines, which are still ice cored.
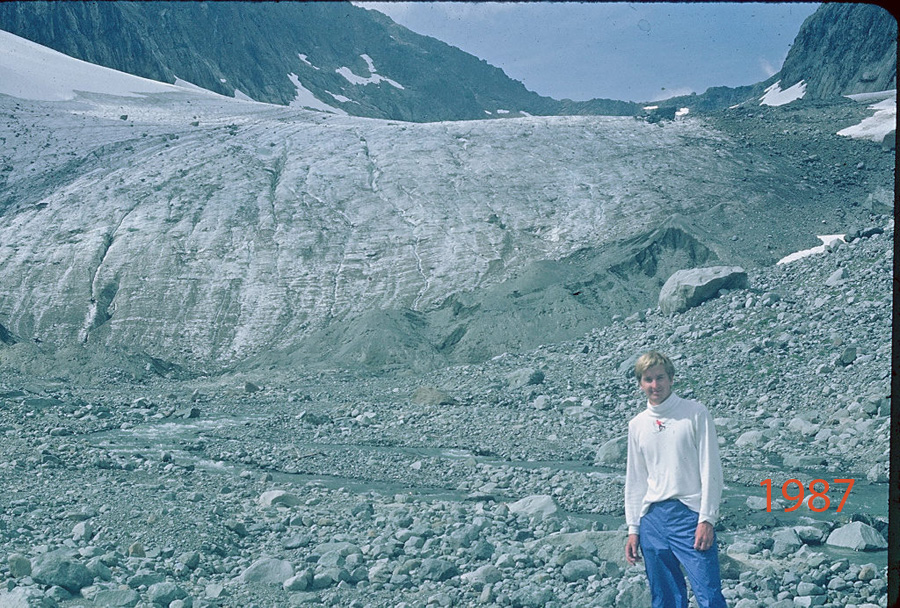
1987-Montreal Protocol signed. Last year of positive global glacier mass balance. Columbia Glacier terminus fully exposed in early August revealing new large rocks at terminus

1988-IPCC formed. The terminus remains strongly convex, with much better snowcover. The slope is impressive note the skier for scale.

1989-Mean Global CO2 levels exceed 350 ppm. Note the annual layers both paralell to the terminus and in upper right avalanche fan annual layers that are diagonal to the terminus.
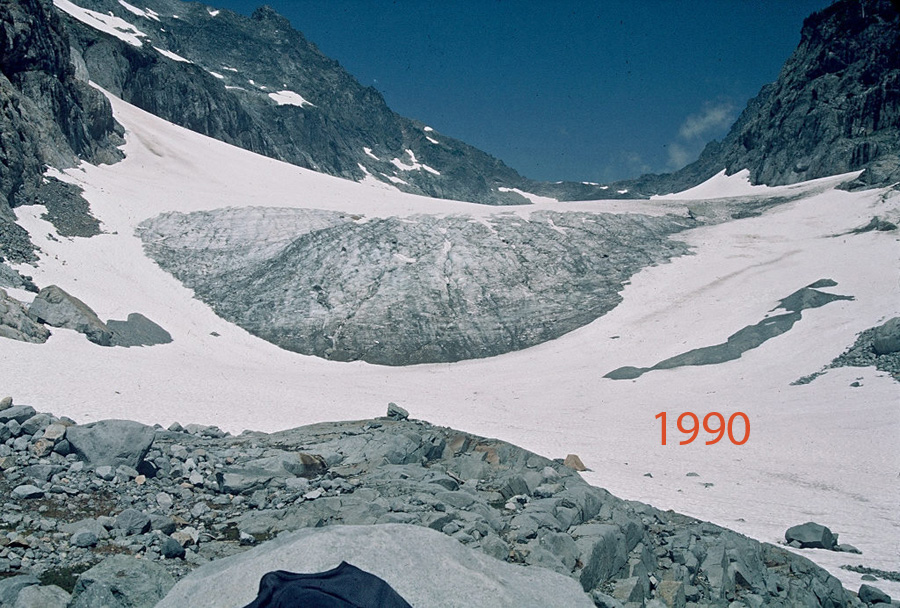
1990-First IPCC Assessmenent report , Clean Air Act amended to address Ozone Depletion and Acid Rain. Heavier accumulation nearly barely the lateral moraines at the terminus, indicative of a strong avalanche season.

1991-Mount Pinatubo erupts ejecting 15 million tons of SO2 into stratosphere impacting climate. No bare ice exposed in early August for the first time since we began monitoring the glacier. A strong positive mass balane. Widespread snow in the forest below the glacier.

1992- UN Framework on Climate Change signed by 154 nations. ~50% of the glacier bare ice in early August with 90% exposed by the end of summer, resulting in large mass loss.

1993-Melt ponds observations in Landsat images on Wilkins Ice Shelf leading to breakup event published. Lower half of Columbia Glacier exposed by early August.

1994-Velocity data acquired/published for Pine Island and Thwaites Glacier. Third consecutive year of large mass balance losses, lateral moraine increasingly prominent beyond retreating terminus.
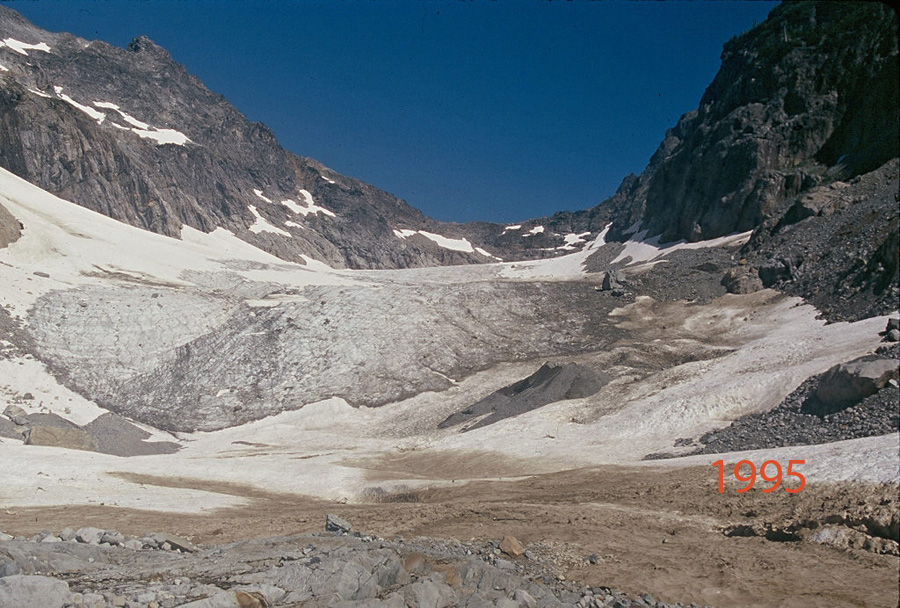
1995- Second IPCC report- Another year of negative mass balance on Columbia Glacier leading to thinning from the top to the terminus of the glacier.
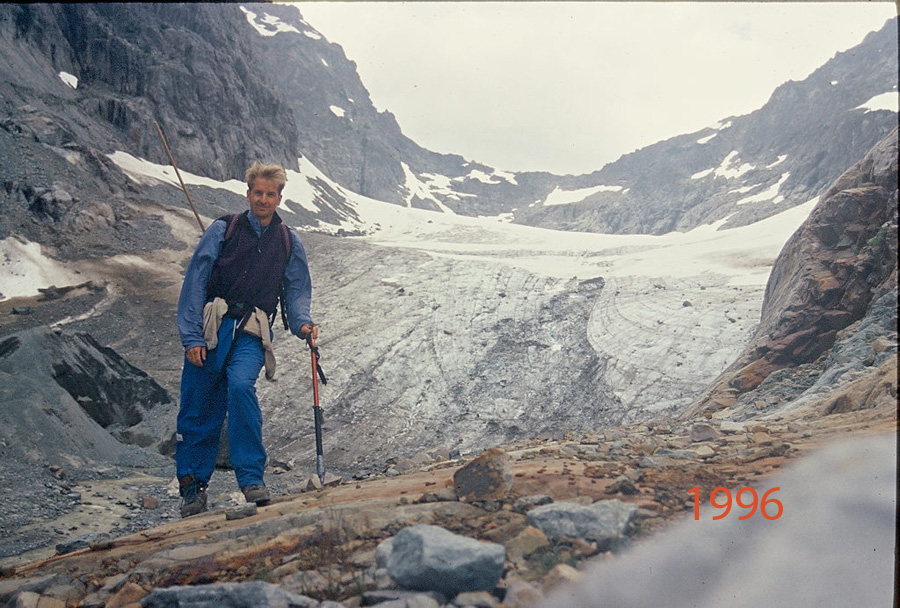
1996-CO2 levels exceed 360 ppm. Columbia Glacier has better avalanching than in the last four years, but still loses mass.
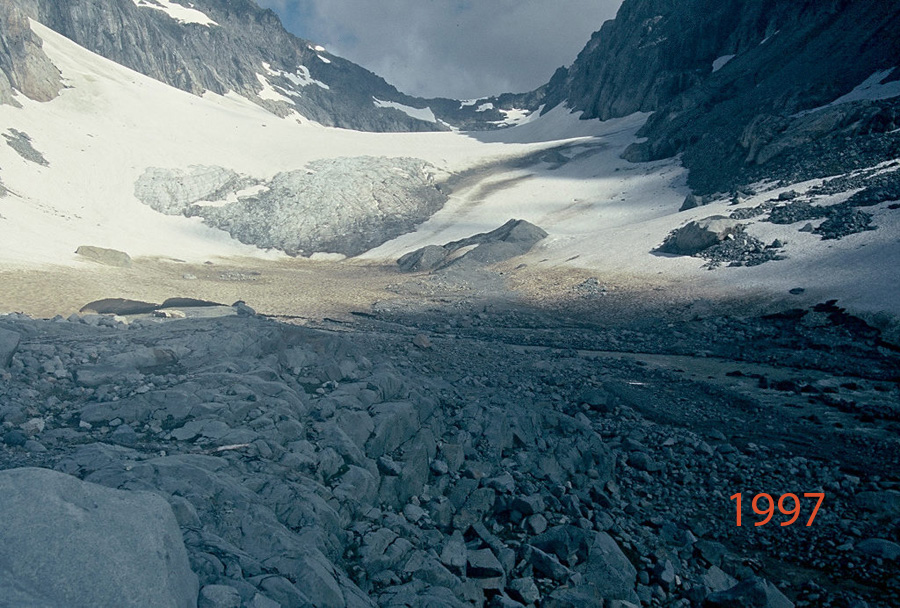
1997-First Prius Produced-Kyoto Protocol adopted. Good accumulaiton is back leaving most of the glacier covered in snowpack right through August.
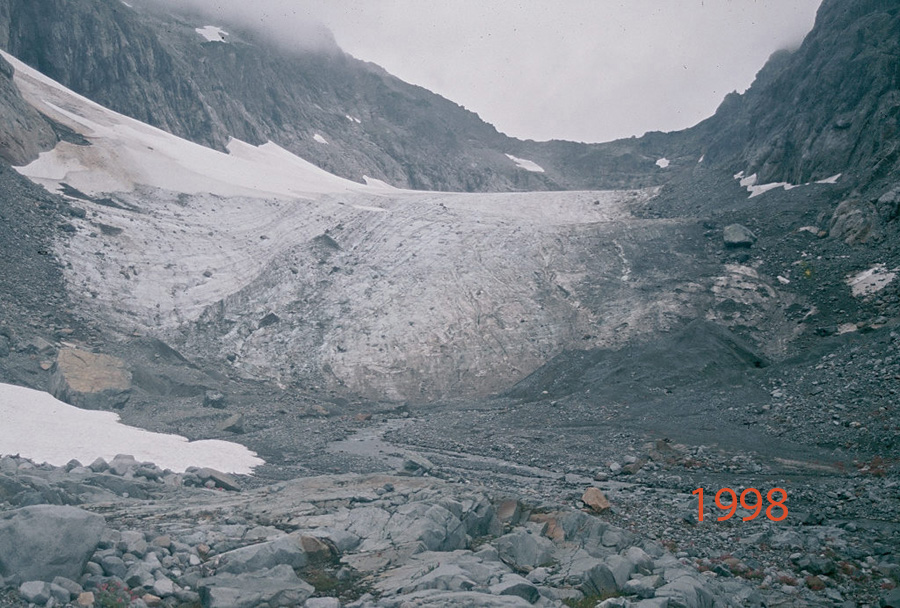
1998-Super El Nino-First year with a +0.50 or greater Global Land-Ocean Temperature anomaly. A warm summer strips the glacier of 90% of its snowcover and much of the retained 1997 firn is lost too.
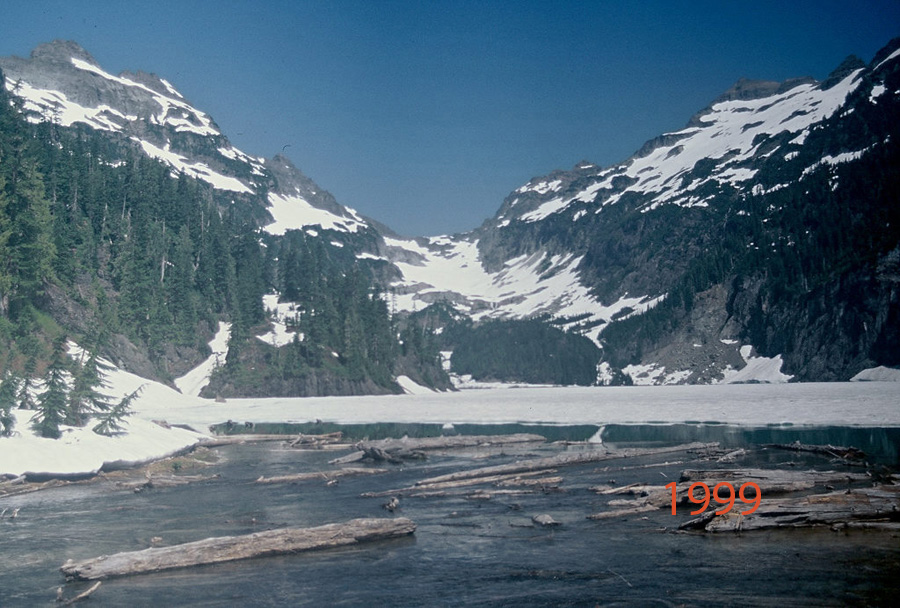
1999-World Record Snowfall at Mount Baker (28.96 m-1140 inches)- where we measure glacier mass balance. First Year Arctic Sea Ice minimum is below 6 million km2. We crossed part of Blanca Lake on the ice enroute to the glacier buried in deep snow with avalanches reaching the lake shore.
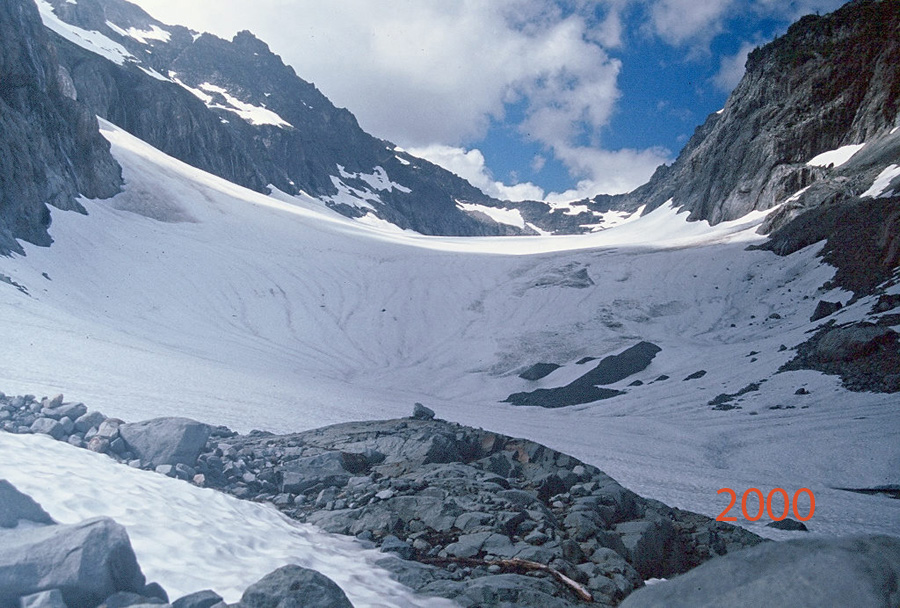
2000-Jakobshavn Isbrae, Greenland speeds up. Another year of good snowcover, though not as deep as in 1999.
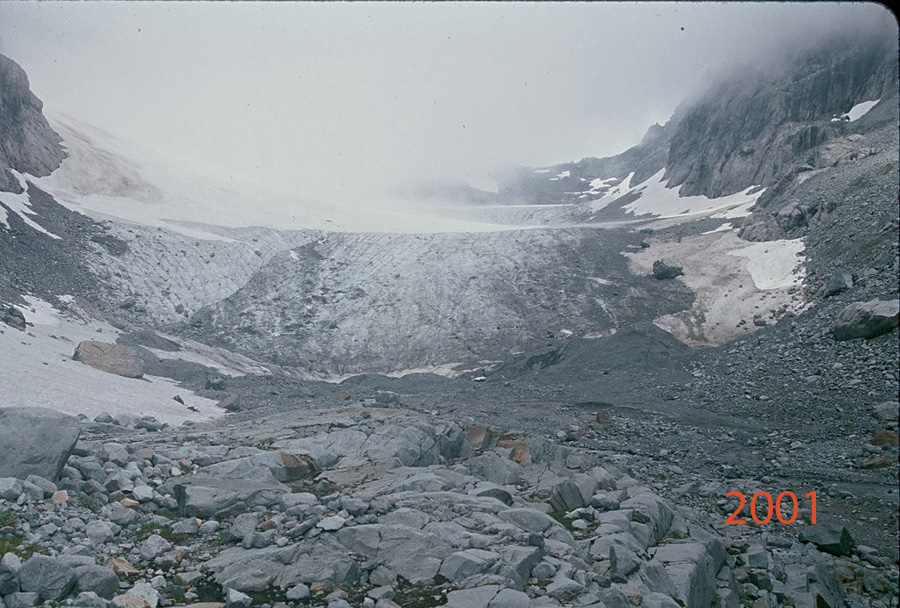
2001-Third IPCC Assessment Report.
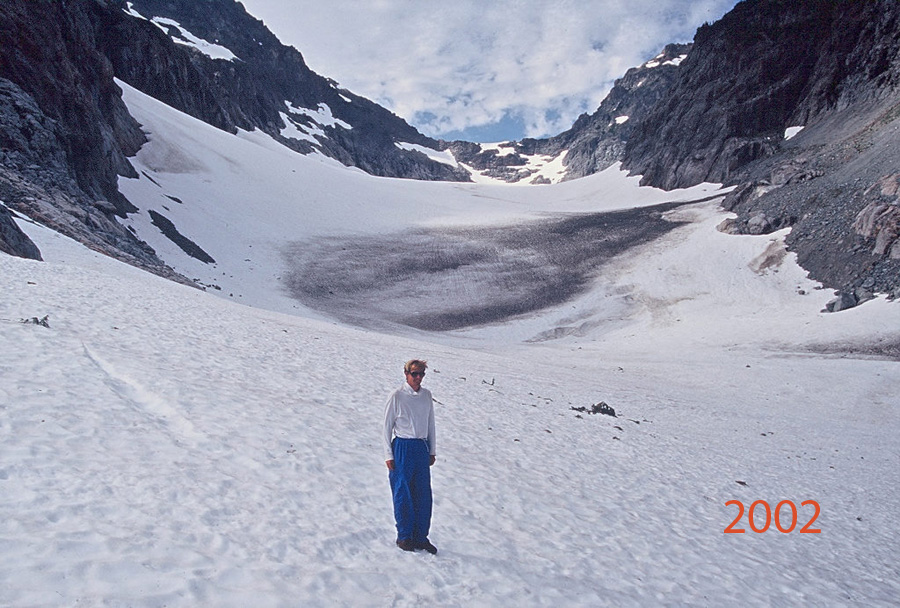
2002-LarsenB Ice Shelf Breakup. Good snowpack with some very strong avalanches including from the east wall that spread out onto the terminus.
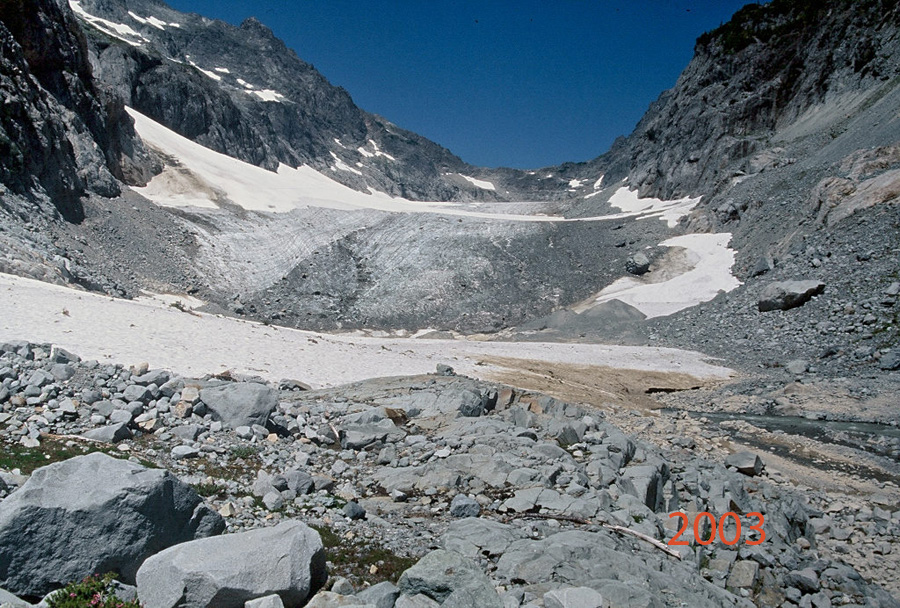
2003-Deadly European Heat Wave. This was the first of several very negative mass balance years.
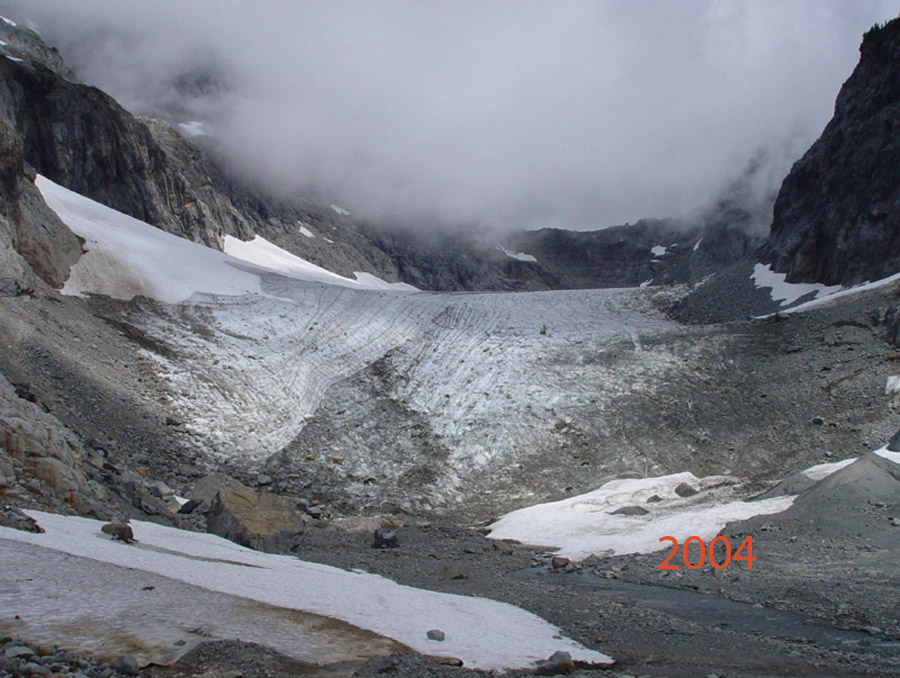
2004-Sea Level Rise 1993-2004 averages 3.5 mm/year. In Northern Atlantic there are 28 tropical storms. Only snow retained is in the large avalanche fans.

2005-Hurricane Katrina strikes New Orleans a $240 billion disaster. Globally hottest year yet. Most negative balance of our monitoring program, with the glacier losing 98% of its snowcover.

2006-First year exceeding nine million acres burned in US by wildfires. Impact of continued mass losses is a thinner glacier, with a reduced slope at the terminus.
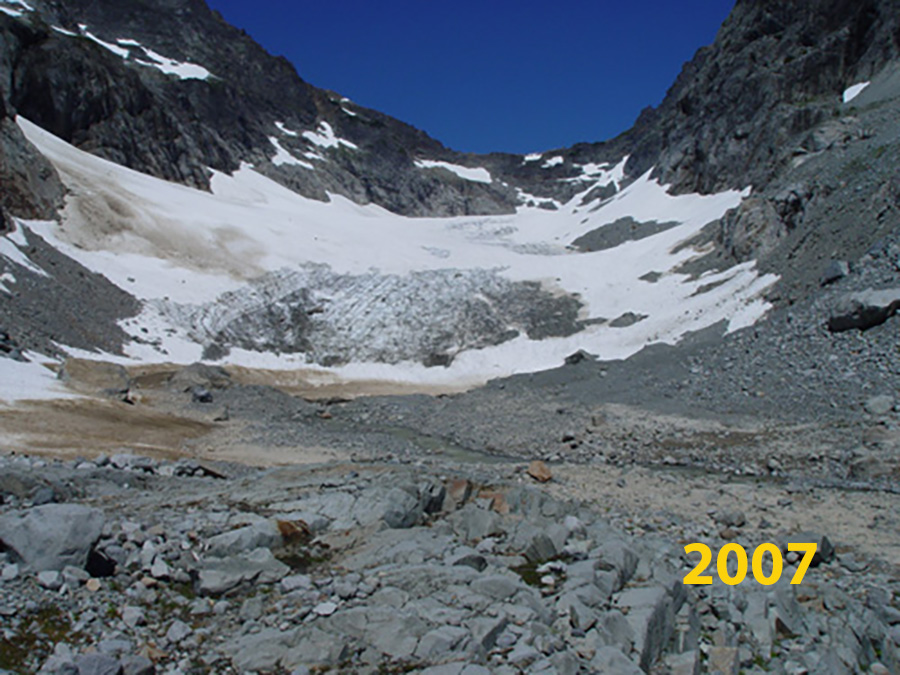
2007-Fourth IPCC report-Arctic Sea Ice falls below 4 million km2 for first time. The west side avalanche fans, on left now only areas of persistent accumulation, hence their slope expanding across glacier.
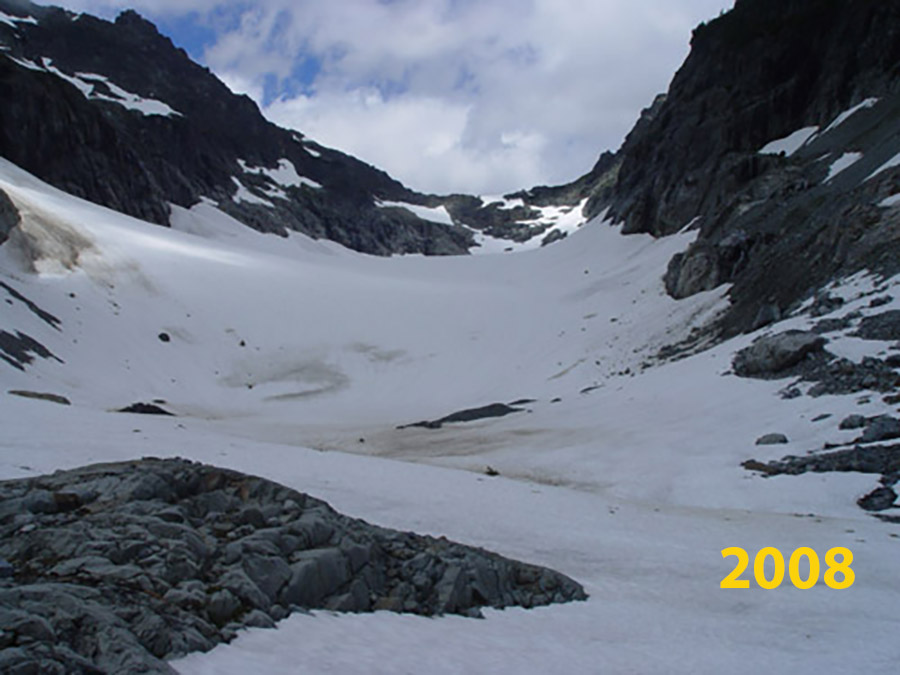
2008-Wilkins Ice Shelf Collapse. Good snowpack with heavy avalanching onto glacier.
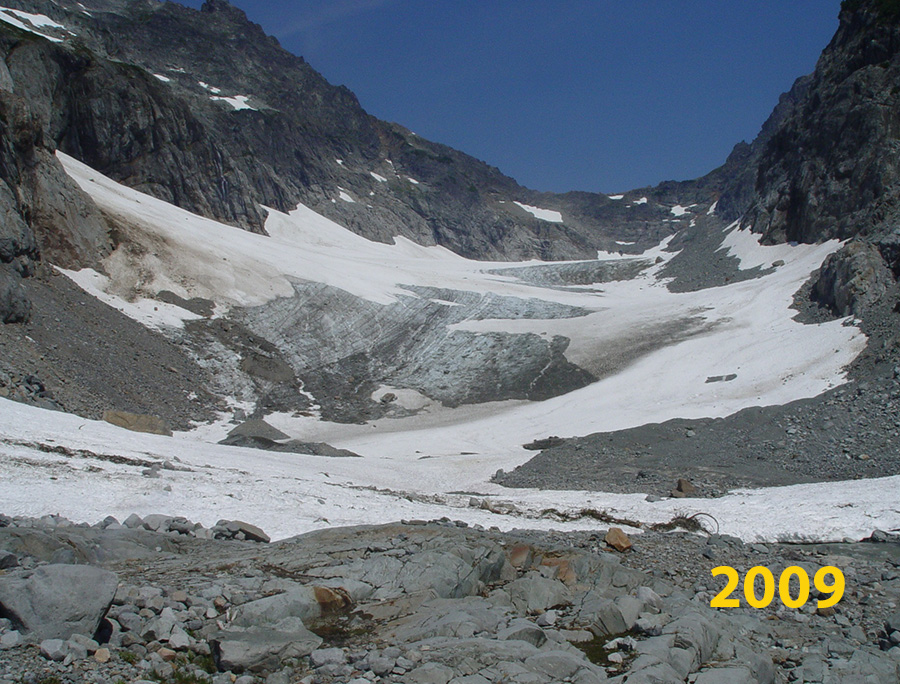
2009-37% Increase in US Wind Power Capacity. Glacier retreat since 1984 exceeds 100 m. Field work occurred during a record heat wave. This leads to an increased focus on heat wave impacts on the glaciers.
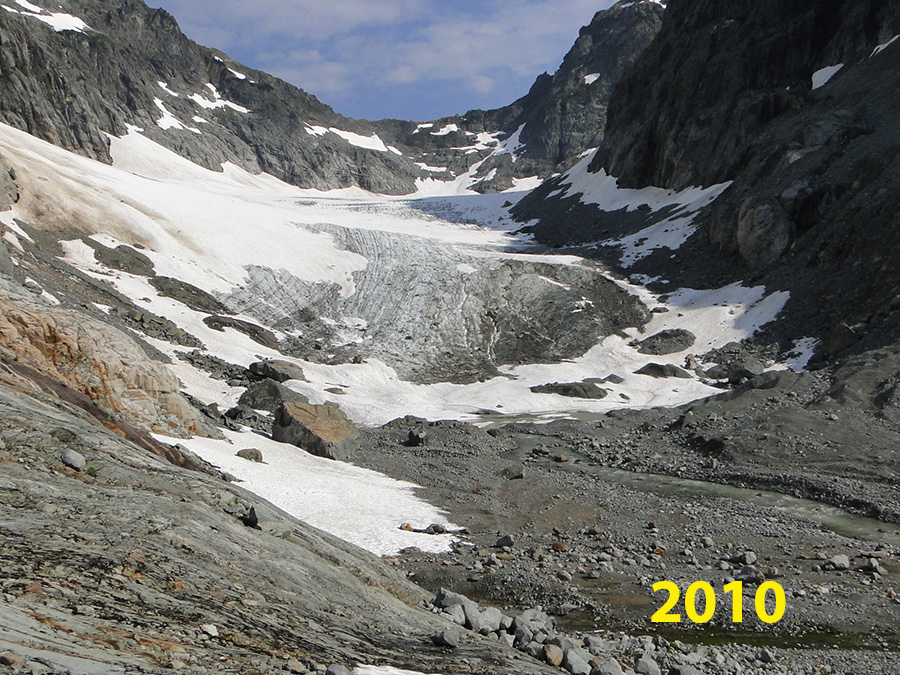
2010-Hottest year of record globally. The terminus slope continues to deflate during another year of negative balance.

2011-Global Wind Power capacity exceeds 200 GW. Deep snowpack remained through the summer leading to a signficant mass gain.

2012-Arctic Sea Minimum record at 3.39 million km2. Record loss from Greenland Ice Sheet. Snowpack again persisted through early August, leading to a small positive balance.

2013-Globally 45 Billion dollar weather disasters including 18 flooding events. Extensive summer melt led to snowpack loss and firn exposure from 2011 and 2012.
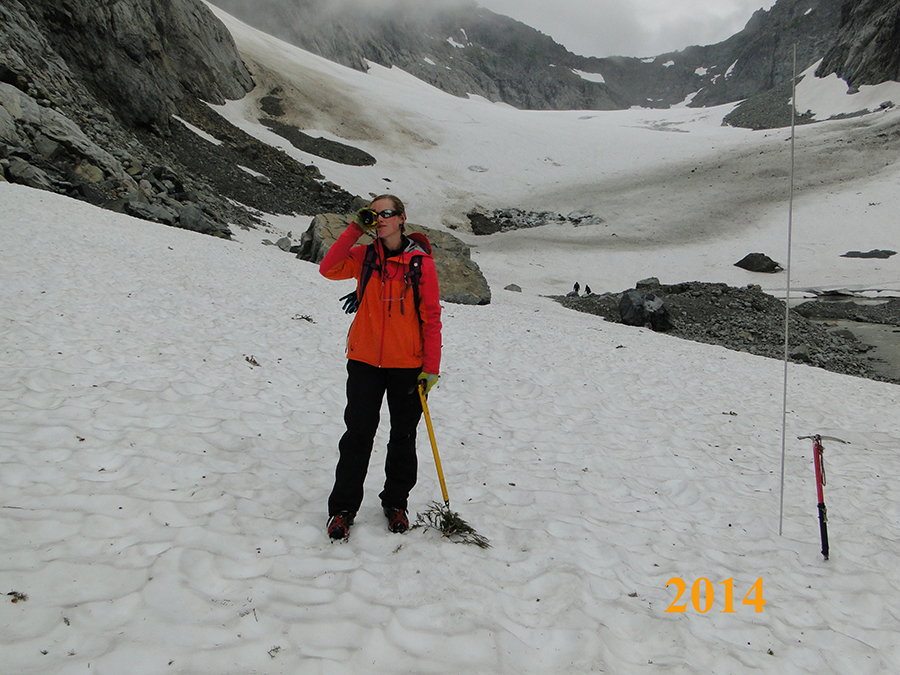
2014- Global Solar and Wind Power Capacity exceeds 500 GW. Marine Heatwave the Blob in Pacific Ocean. The summer of 2014 was the warmest we had experienced, which led to rapid snowpack removal in late summer.
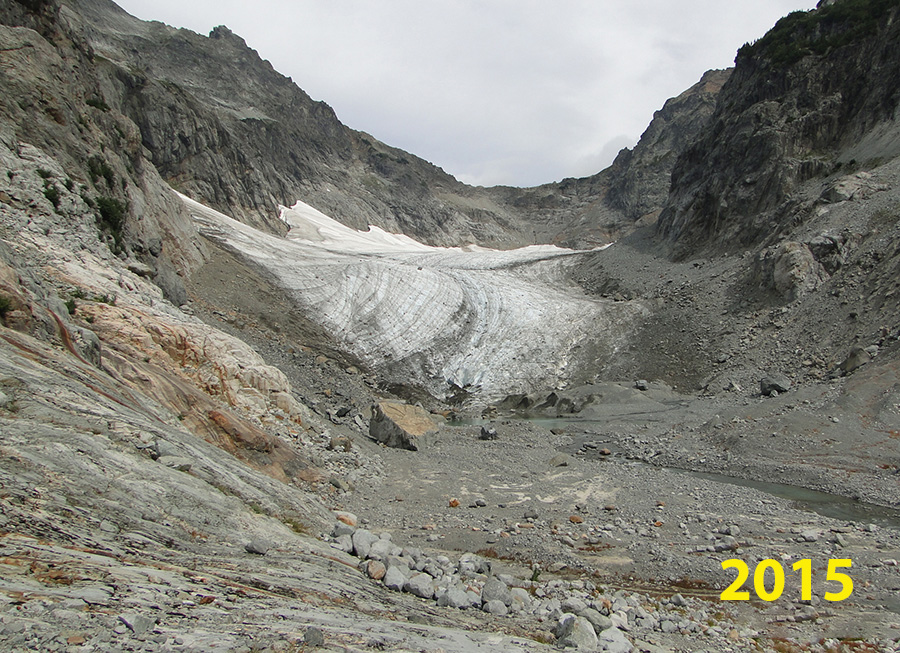
2015-Paris Agreement-Over 10 million acres burned in US by wildfires. The winter was poor and the summer hot leading to no retained snowpack even in avalanche fans and the formation of a new lake at the terminus.
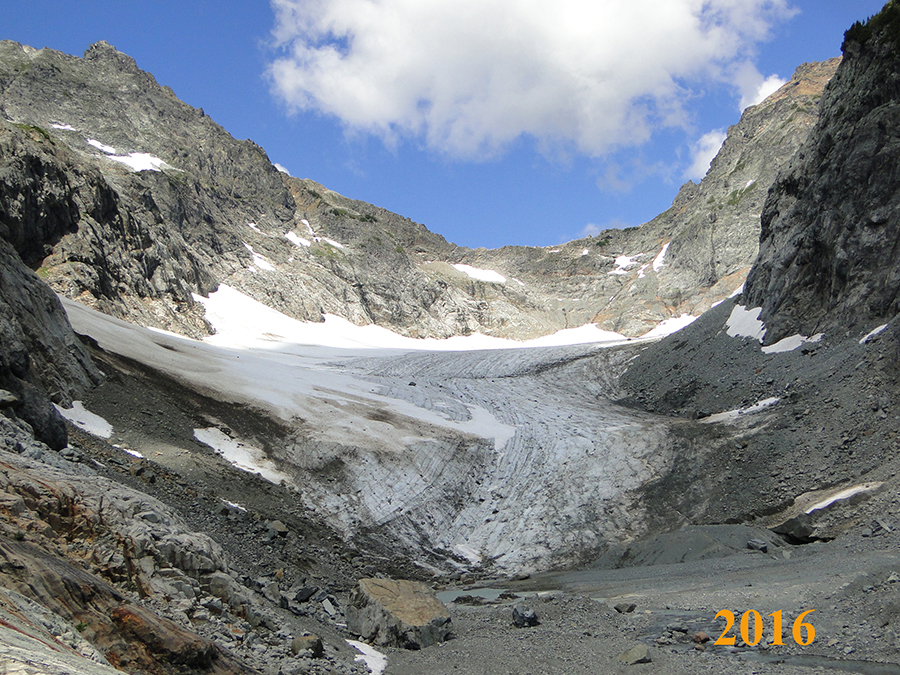
2016-Solar and wind energy economcially competitive. Hottest year on record. High ablation rates and summer forest fire smoke were the story of another poor year, new lake can be seen.
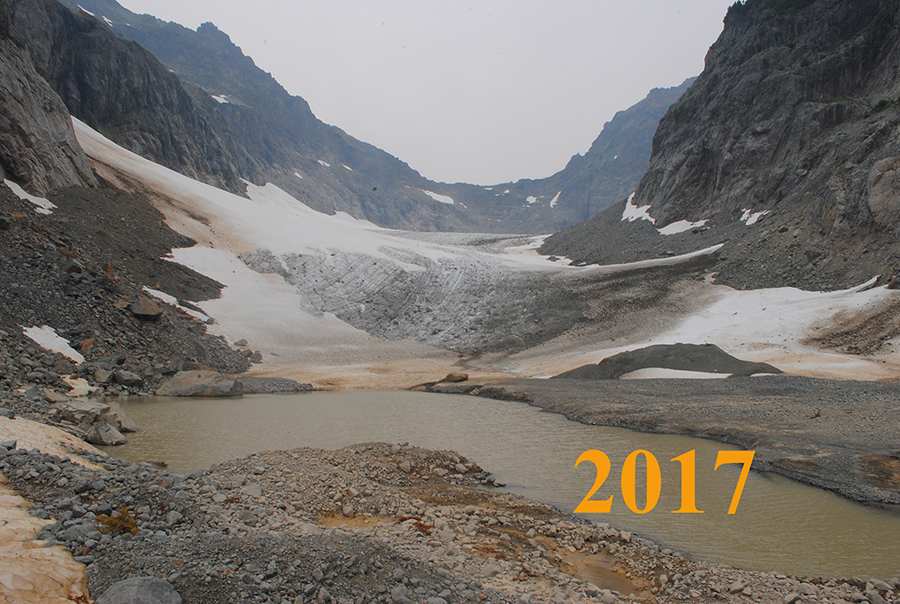
2017-Global Electric Car sales exeed 1.5 million units. Coral Reef Bleaching event impacts 2/3 of Great Barrier Reef. New lake continues to expand as glacier thins and retreats.

2018- Solar and Wind Energy installed capacity both exceed 500 GW. Retreat since 1984 exceeds 200 m. No snowpack retention except in avalanche fans.
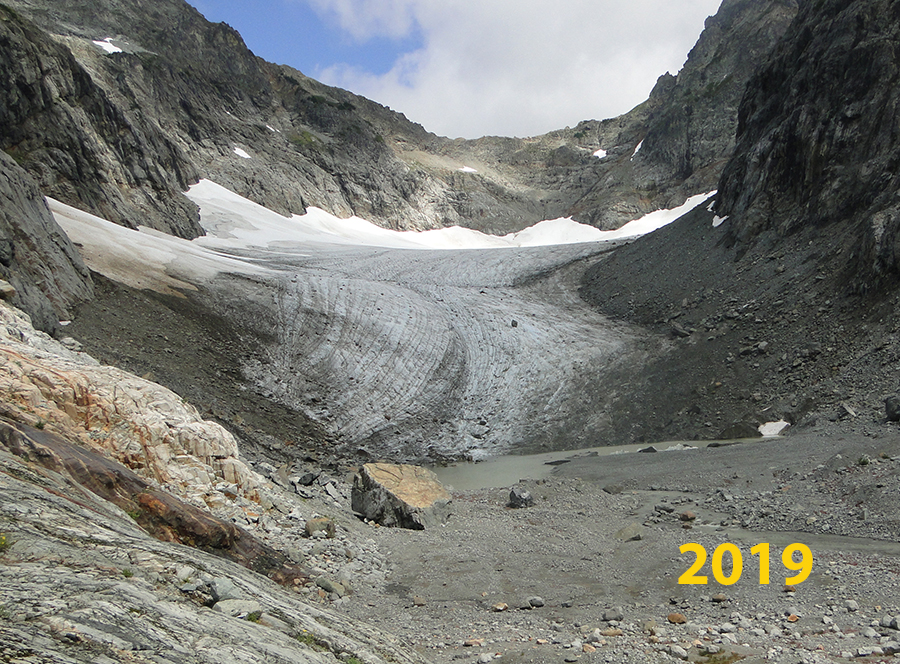
2019-Global Electric car sales exceed 2.2 million units. Only 14% of the glacier retained snowpack by summer’s end.
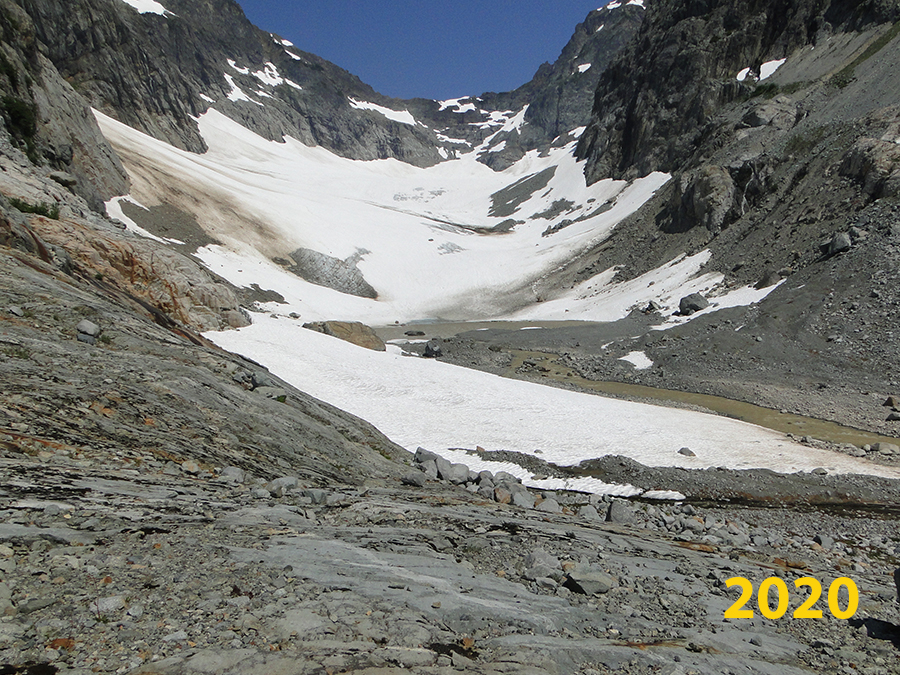
2020- Thirty tropical storms in North Atlantic. The lake expanded substantially with a concave stagnant terminus exposed on its margin.

2021- Over 40 Billion dollar weather disasters in last two years in US. A climax avalanche event in February led to deep snowpack on the glacier. An early season heat wave melted off all snow except in the large avalanche fans.
2022- We will be back in the field for year 39 looking at snowpack depth, melt rate and extent across the glacier.
 Dean of Academic Affairs at Nichols College and Professor of Environmental Science at Nichols College in Massachusetts since 1989. Glaciologist directing the North Cascade Glacier Climate Project since 1984. This project monitors the mass balance and behavior of more glaciers than any other in North America.