June 29, 2021
Pacific Northwest June 2021 Heat Wave Current and Enduring Glacier Impact
Posted by Mauri Pelto
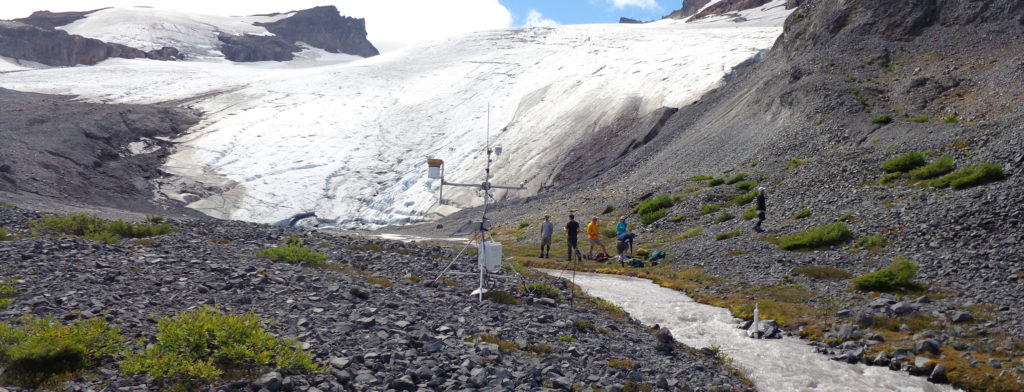
Streamflow observation site below Sholes Glacier on August 6, 2015. We have measured flow at this site for 30 years, the last 10 years in conjunction with the Nooksack Indian Tribe (Grah and Beaulieu, 2013; Pelto, 2015).
The exceptional record breaking Pacific Northwest heat wave of June 2021 had an impact on snow melt both on and off glaciers in the North Cascade Range of Washington and consequently on alpine rivers. Here we examine the specific snow melt, streamflow and stream temperature in the Nooksack Basin, near Mount Baker, from this week. We compare that to our observations of glacier melt and glacier runoff during summer heat waves, that are typically later in summer over the last 37 years.
Glacier runoff is a major source of streamflow during the summer low-flow season and mitigates both low flow and high water temperatures (Pelto, 2015). This is particularly true during summer heat waves, but this ability has been diminishing in the region (Moore et al 2020) For the last 37 summers we have been in the field monitoring North Cascade glaciers response to climate change including during heat waves (Pelto, 2018). In the last decade we have made synchronous observations of glacier ablation and stream discharge immediately below Sholes Glacier, Mount Baker (Pelto, 2015). This in conjunction with observed daily discharge and temperature data from the USGS stations on the ~6% glaciated North Fork Nooksack River (NFN) and the unglaciated South Fork Nooksack River (SFN), contrasts and quantifies the ameliorating role of glacier runoff on discharge and water temperature during 23 late summer heat wave events. Map of the region below indicates the differences including a mean altitude of 1311 m in NFN being vs 914 m for SFN which leads to higher snowpack and glacies in NFN.
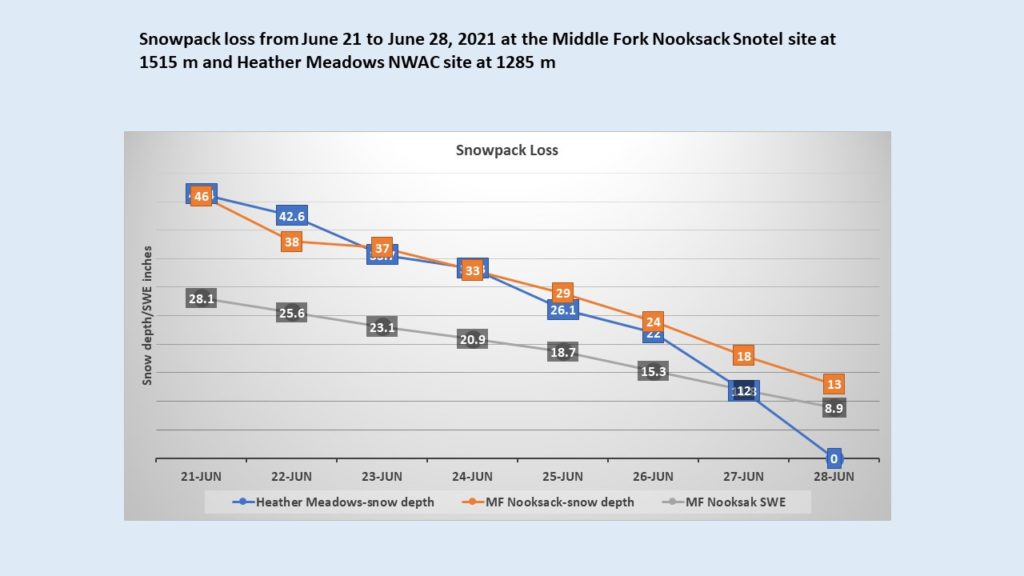
Snowpack loss during the June 21-June 28 period at the Middle Fork Nookack, USDA Snotel site at 1515 m and the Heather Meadows, Northwest Avalanche Center site at 1285 m.
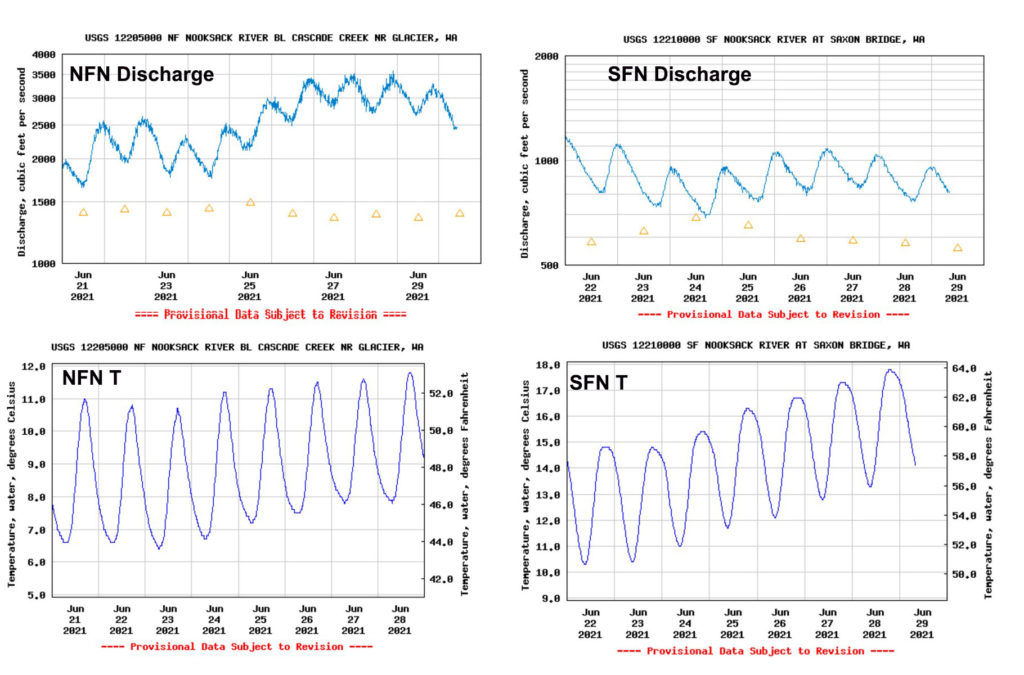
Durng the June 2021 heatwave from June 21-289 maxium daily stream temperature in SFN warmed 3 C, vs 0.8 C for NFN. This illustrates that a greater proportion of snowmelt, which NFN recieves, has limited the temperature rise. This is similar to that observed for 23 summer heat waves occurring from Late July on, where the mean water temperature increase was 0.7o C in the NFN and 2o C in the SFN.
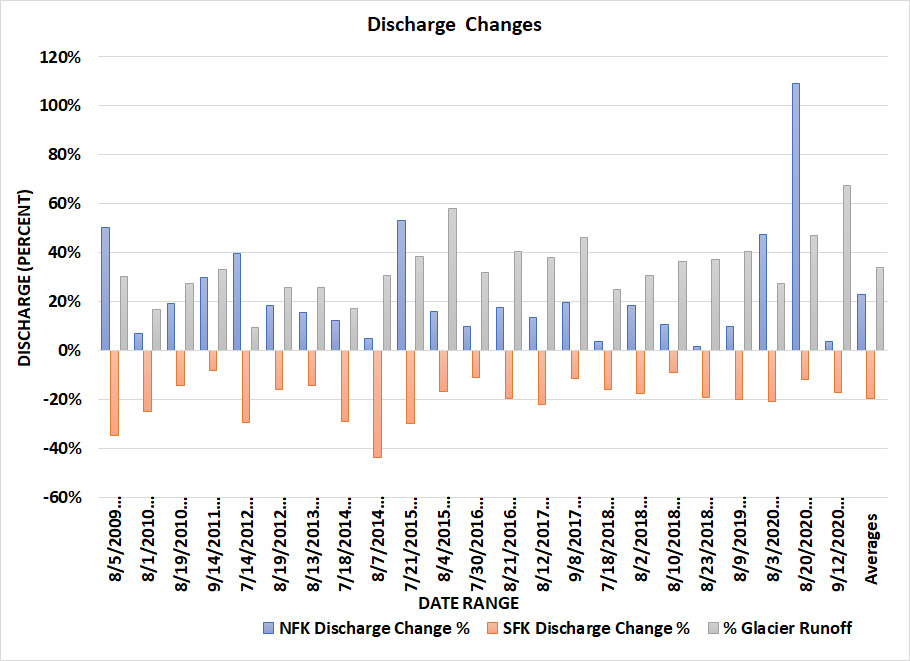
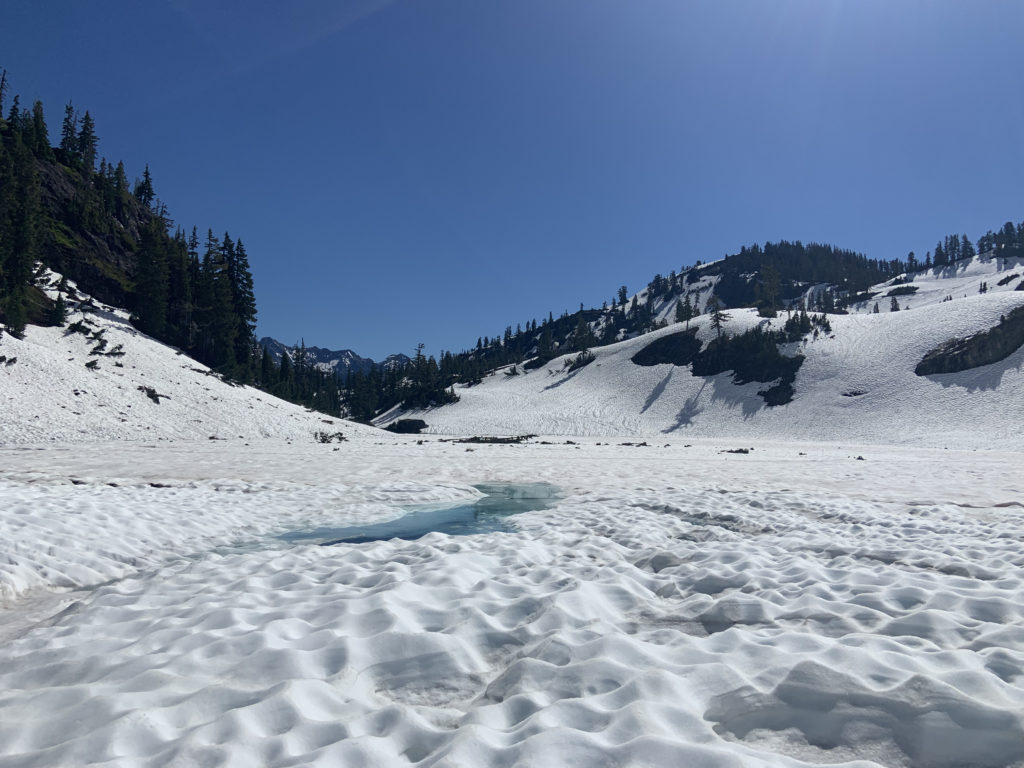
For this period discharge in the SFN first increased 100 cfs from June 23 to June 25 and then by June 28 declined back to the June 23 levels. The initial increase indicated an increase in snowmelt rate as temperatures rose. The decrease by June 28 despite high temperatures indicates a decrease in snowmelt volume as the area of snowcover declined more than the increase snowmelt rate. in SFN. For NFN discharge during the week increased from 2500 cfs to 3500 cfs as snowmelt volume increased due to a higher melt rate, and then began to decline on June 29 as snowcover was reduced. This is a 40% increase in discharge. During the 23 previous summer warm weather events the discharge increased an average of +23% in the NFN and decreased an average of 20% the SFN. For the NFN discharge increased by more than 10% during 18 of the 23 periods. In the SFN discharge decreased by more than 10% during 21 of the 23 periods. For discharge SFN did not decline from start to end of the heat wave, but did rise and then drop to the pre heat wave level. For NFN the 40% increase in discharge exceeds the 23% average increase in discharge for summer heat waves later in the summer when glaciers play a larger role and snowpack much less. Snow melt during the June 2021 heat wave in the 1300-1600 m range averaged 15 cm per day in depth and 8 cm water equivalent per day. Snow cover in the basin on June 21 was nearly complete above 1200 m on June 23, see image below from near 1300 m at Bagley Lakes. This compares to obseved snow melt rates of 4.5 to 6.5 cm water equivalent per day during heat waves on Mount Baker glaciers in the 1600-2000 m range. For ice surfaces with a higher albedo and greater density the observed melt rates are 7-9 cm per day water equivalent.
USGS streamflow data from 6-21-2021 to 6-29-2021 for the North Fork Nooksack River and South Fork Nooksack. Discharge in CFS is above and stream temperature is below.
Change in daily stream temperature in the North Fork Nooksack (NFK) and South Fork Nooksack (SFK) during the 23 warm weather events from the beginning of the period to the maximum observed daily temperature.
Change in discharge in the North Fork Nooksack (NFK) and South Fork Nooksack (SFK) during the 23 warm weather events. The percent of North Fork Nooksack discharge generated by glacier runoff is also indicated.
The identified ablation rate is applied to glaciers across the North Fork Nooksack (NFN) watershed, providing daily glacier runoff discharge to the North Fork Nooksack River. For the North Fork glacier runoff production was equivalent to 34% of the total discharge during the 23 later summer heat wave events. As glacier area declines, this production will decline (Moore et al 2020) . This summer the ability of the heat wave to expose bare glacier ice earlier, which has a higher melt rate than snow will be key to determining how much mass the glaciers lose. The primary response to these summer heat waes is increased discharge in the heavily glaciated NFN, and increased stream temperature in the unglaciated SFN.
For the 38th consecutive summer we will be in the field to determine the specific impact and annual balance of North Cascade glaciers. Certinaly this event represents a significant volume loss in the 10-15% range of typical summer ablation, in one week. We have ablation stakes in place to measure ablation on the glaciers, that will be checked when conditions are safer to work on the glaciers. Ongoing climate change will cause further decreases in summer baseflow and an increase in water temperature potentially exceeding tolerance levels of several Pacific salmonid species (Grah and Beaulieu, 2013).
Snowpack on June 26 at Bagley Lakes Basin, image from Sally Vaux, Western Washington U, who will be working with us in the field this summer.
Map of Nooksack River and Mount Baker glaciers.




 Dean of Academic Affairs at Nichols College and Professor of Environmental Science at Nichols College in Massachusetts since 1989. Glaciologist directing the North Cascade Glacier Climate Project since 1984. This project monitors the mass balance and behavior of more glaciers than any other in North America.
[…] and firn melt ~30% faster than the snowcover for the same weather conditions. Our measurements on Mount Baker during heat waves over the last three decades indicate typical ice melt of 7-9 cm of melt per day. […]