
May 28, 2021
Vista Glacier, Glacier Peak WA Retreat and Snow Line Rise
Posted by Mauri Pelto
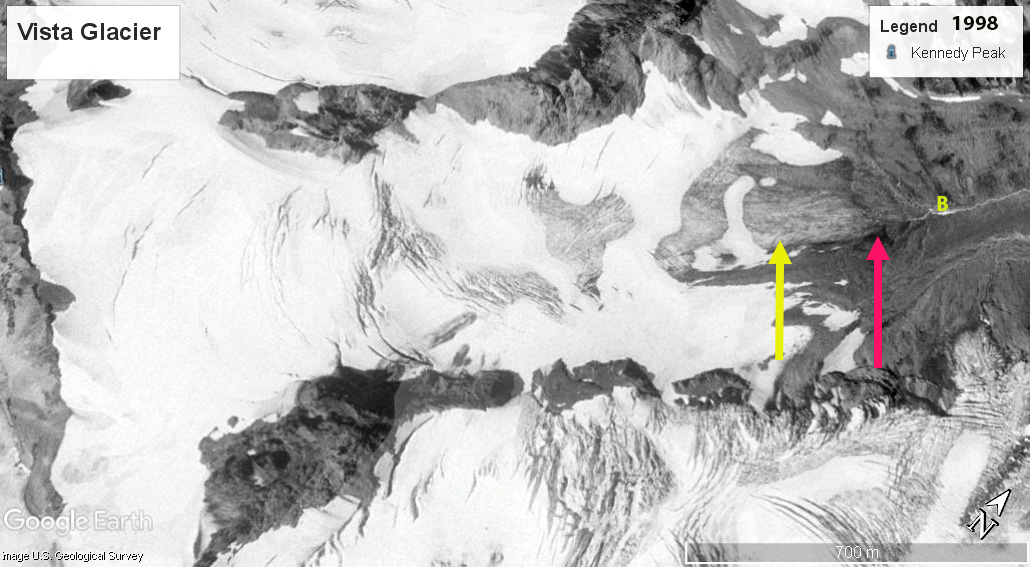
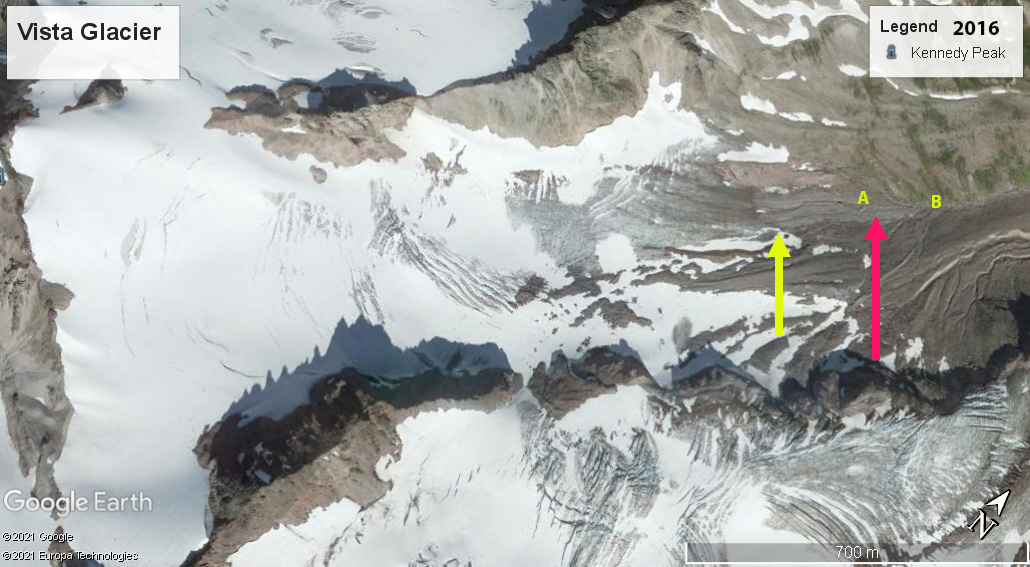
Vista Glacier in 1998 and 2016 Digital Globe images with the the 1984 terminus red arrow and 2015 terminus yellow arrow, Point A is the rock seen below the glacier in 1994 image below and Point B is where the advance moraine reached the valley bottom.
Vista Glacier is a valley glacier flowing down the northeast side of Glacier Peak (Dakobed) that drains into the Suiattle River. The glacier begins at 2475 m beneath Kennedy Peak. We examined all of the glaciers around Glacier Peak in detail from 1993-1997 to document their changes since first closely observed by C.E. Rusk 100 years earlier. The glacier during the LIA joined the Ermine Glacier and extended down to 1345 m. By 1900 when Asahel Curtis photographed this glacier it had retreated 1300 m. By 1946 the glacier had retreated 1900 m from its LIA moraine, separated from Ermine Glacier and terminated at ~1900 m. In 1955 the glacier began a slow advance, all major Glacier Peak glaciers advanced during this period, that had ended by 1975 with a total advance of 105 m (Pelto and Hedlund, 2001).

Vista Glacier in 1988 aerial image illustrating the glacier is still adjacent to advance moraine.
In 1985 at our first visit the glacier was again retreating, total retreat was 10-20 meters from the advance moraine. By 1994 the glacier had retreated 90-100 m with the lower part of the glacier thin and crevassed. By 1997 the glacier had retreated beyond the 1946 position. The retreat accelerated after 2003 and had retreated and by 2016 the retreat from the 1984 mapped position was 410 m, a rate of ~13 m/year. The terminus is now at 1900 m.
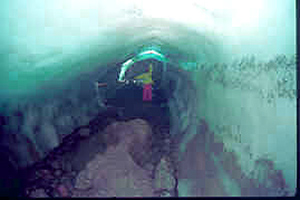
In 1994 Cliff Hedlund and I were surveying the terminus when we found a beautiful ice cave beneath the glacier, see below. The rock just behind Cliff in the cave is apparent now out in the open in the Digital Globe image from 2016 and the LIDAR image from 2015 (Point A). Cliff was ahead of his time with the homemade neon colored gear that is perfect in an ice cave.
The red arrow in the image below looking down glacier in 1997 indicates the ice surface level in 1985, the glacier has thinned 20 meters in this region. Measuring snow depth up the middle of this glacier in 1994 and 1997 we found limited areas with accumulation of greater than 2 m in early August. This glacier is prone to losing most of its snow cover in many years such as occurred 2005, 2009, 2015 and 2019. Overall. This indicates considerable retreat will occur even with present climate. From 2013-2020 the end of summer snowline avearaged 2350 m, leaving just 35% of the glacier in the accumulatioin zone each year. To have an equilibrium balance North Cascade glaciers need an AAR of at least 55%, the percentage of glacier in accumulation zone (Pelto and Brown, 2012). We will back in the field this coming summer for the 38th consecutive year measuring the response of North Cascade glaciers to climate change.

1984 USGS Map of Vista Glacier and 2015 LIDAR (WA DNR) of Vista Glacier. Red line is the 1984 terminus and yellow line the 2015 terminus location. Note lack of crevasses in lower half of glacier.
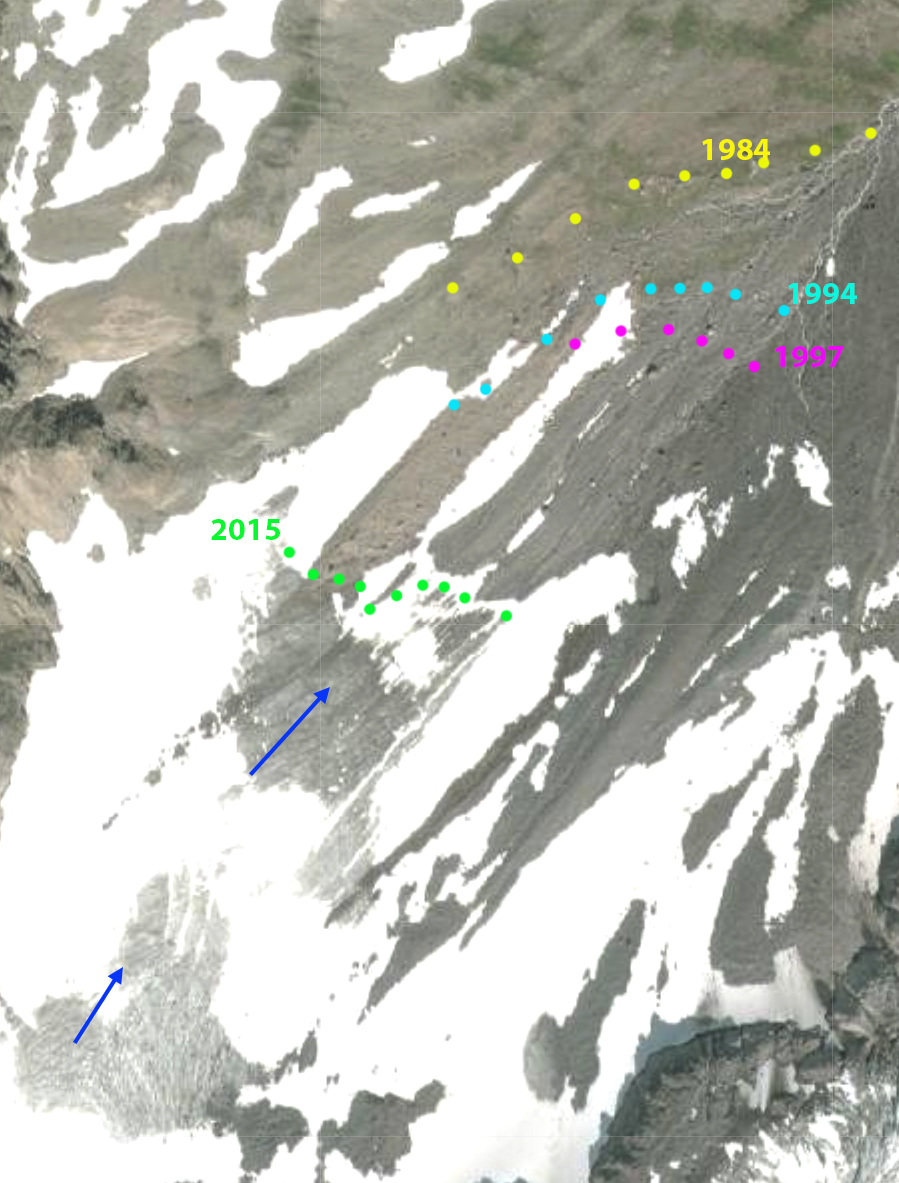
Terminus change map of Vista Glacier from 1984-2015.
 .
.
Cliff Hedlund in subglacial tunnel leading to Rock A in 1994.

View across lower half of glacier in 1997 towards Ermine Glacier indicating limited crevassing and flow of this thin section of the glacier
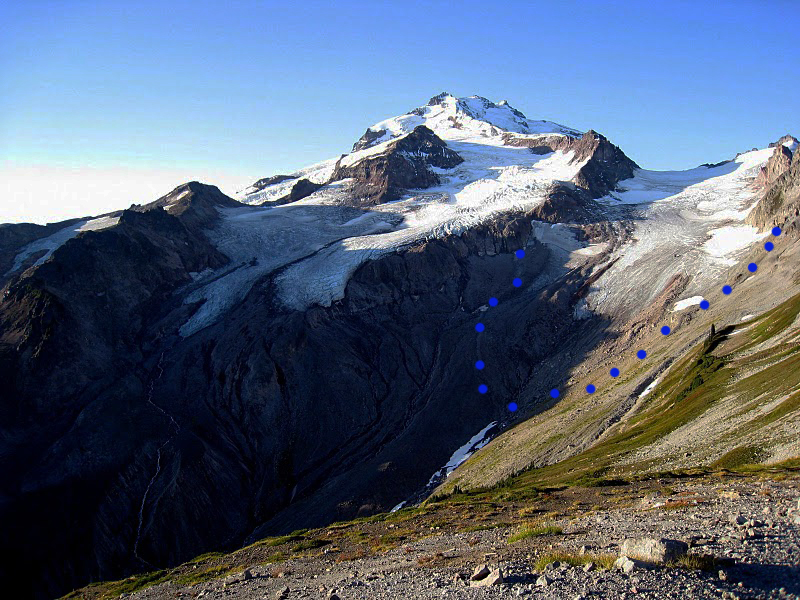
Vista Glacier in 2006 with the blue dots indicating the margin and resulting moraines emplaced by the advance from the 1950’s into the 1970’s.
 Dean of Academic Affairs at Nichols College and Professor of Environmental Science at Nichols College in Massachusetts since 1989. Glaciologist directing the North Cascade Glacier Climate Project since 1984. This project monitors the mass balance and behavior of more glaciers than any other in North America.
That’s a shame. I love glaciers. I picked the wrong lifetime to get in to glacier climbs.