
November 23, 2020
Coley Glacier and Sjögren Glacier, Antarctic Peninsula Exhibit Rapid Melt Feb. 2020
Posted by Mauri Pelto
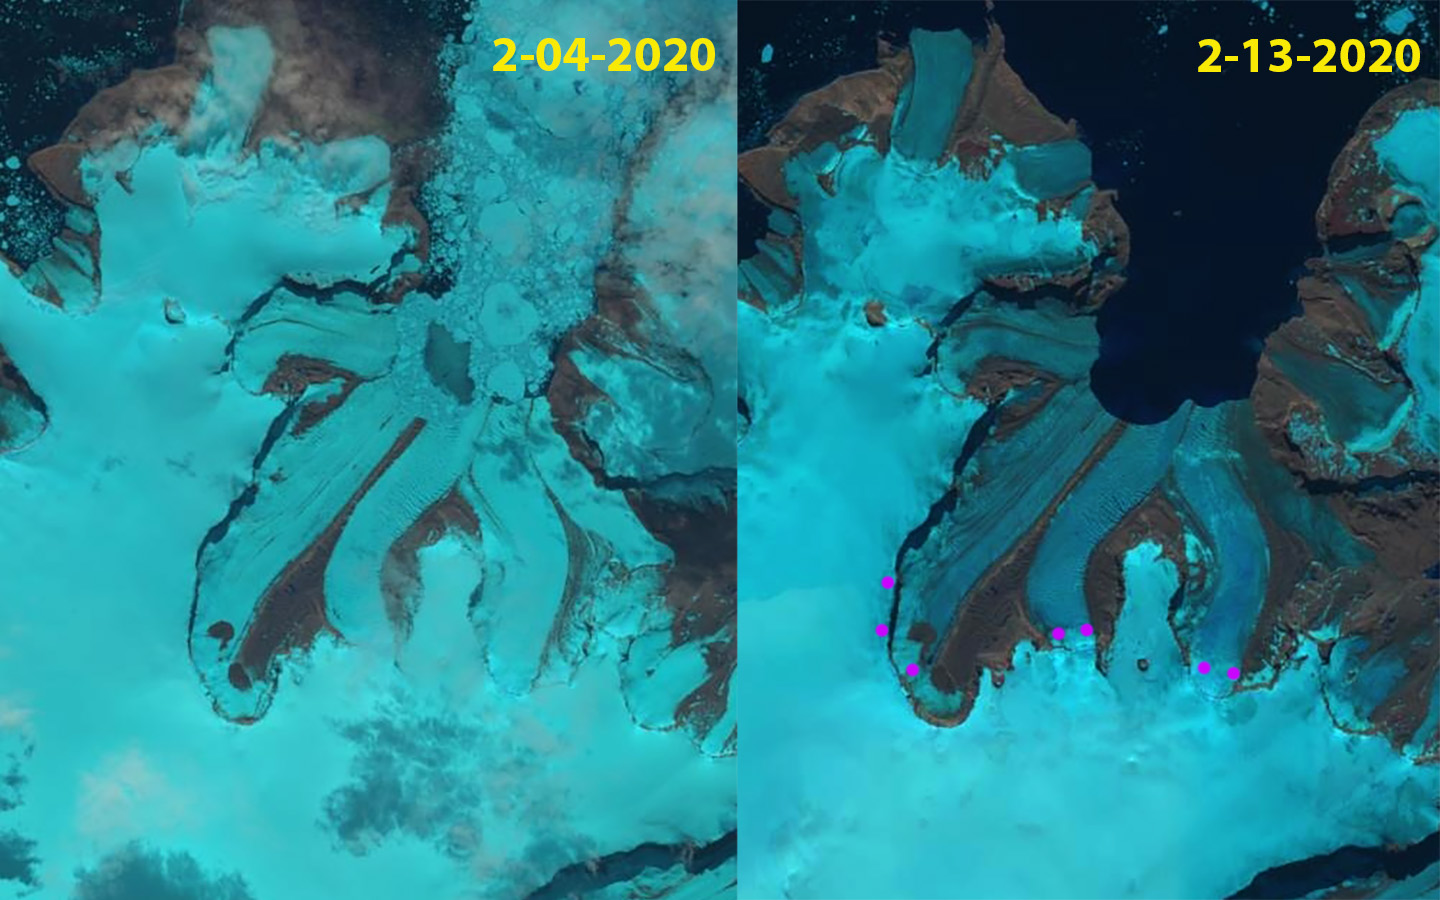
Coley Glacier in Landsat images from Feb. 4, 2020 and Feb. 13, 2020. Magenta dots indicate the snowline
The impact of a period of record warm weather over the Antarctic Peninsula during February 2020 was rapid development of melt features and expansion of melt area on many glaciers near the tip of the Peninsula, where the temperature records were set at Esperenza and Marambio Base. Here we examine Landsat imagery at Coley Glacier on James Ross Island and Sjögren Glacier to identify surface melt extent and surface melt feature development (see map below). Coley Glacier is 30 km west and Sjögren Glacier 120 km west of Marambio Base respectively. Xavier Fettweis, University of Liege Belgium, used the MAR climate model output forced by the Global Forecast System (GFS) to generate daily melt maps for Antarctica, for Esperanza the melt map indicates that daily melt increased to above 30 mm/day on Feb. 6, with a maximum temperature on the warmest day of 18.3 C (65 F). The impact was noted at Eagle Island Ice Cap and Boydell Glacier where melt ponds and melt saturated snowpack quickly developed. On Eagle Island Ice Cap melt averaged 22 mm/day ffrom Feb 6-Feb 11(Xavier Fettweis, 2020).
Coley Glacier retreated ~1.5 km from 2001-2015. On Feb. 4 snowcover extends to the terminus of the glacier, this is a thin snowpack resulting from a recent summer snow event. The bay is also largely filled with sea ice. Nine days late on Feb. 13 the bay is free of sea ice and the snowline has rise to 400 m, at the base or just on top of the escarpment. The loss of snow and sea ice in just nine days is a remarkable melt rate for Antarctica. On March 7 2020 the snowline is also at 400 m and melt plumes are evident at the glacier front indicating ongoing melt conditions.
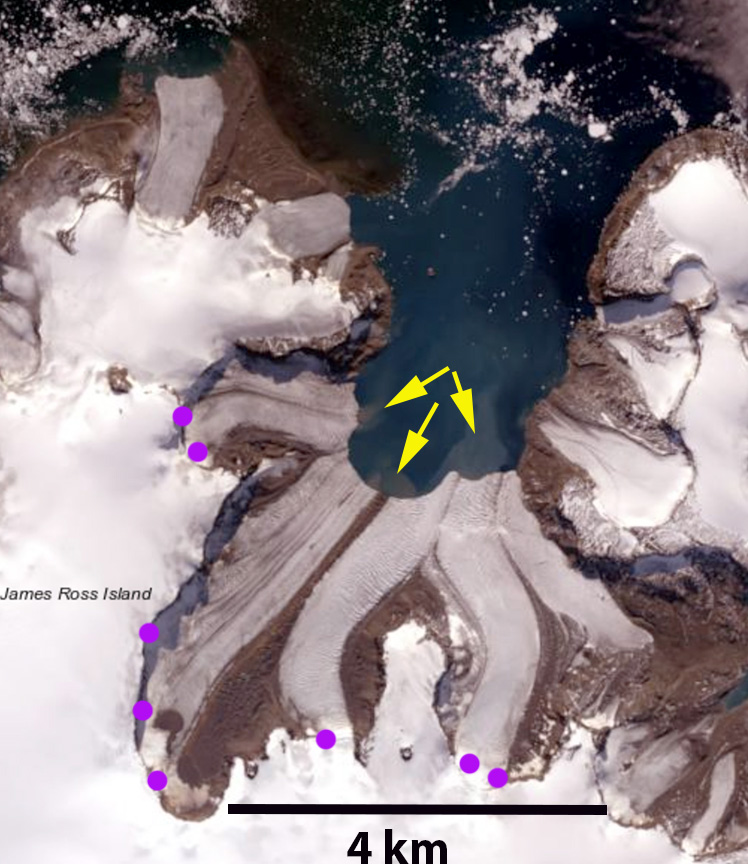
Coley Glacier in March 7, 2020 viewed in the Antarctic REMA Explorer
Sjögren Glacier retreated 10-11 km from 2001-2016. On Sjögren Glacier on Feb. 11 the snowline is at 500 m, compared to ~200 m on January 12, having shifted 8 km upglacier. The false color Landsat image, deep blue coloration below the snowline indicates the presence of meltwater at the surface. Melt plumes are evident at the glacier front, yellow arrows. The snowline is still at 500 m on March 7, with meltwater plumes indicating that significant meltwater is still exiting the glacier. The lower 15 km of the glacier was in the ablation zone for an extended period during the Antarctic summer of 2020.
The above examples added to those at Eagle Island Ice Cap and Boydell Glacier illustrate the extent of the melt event.
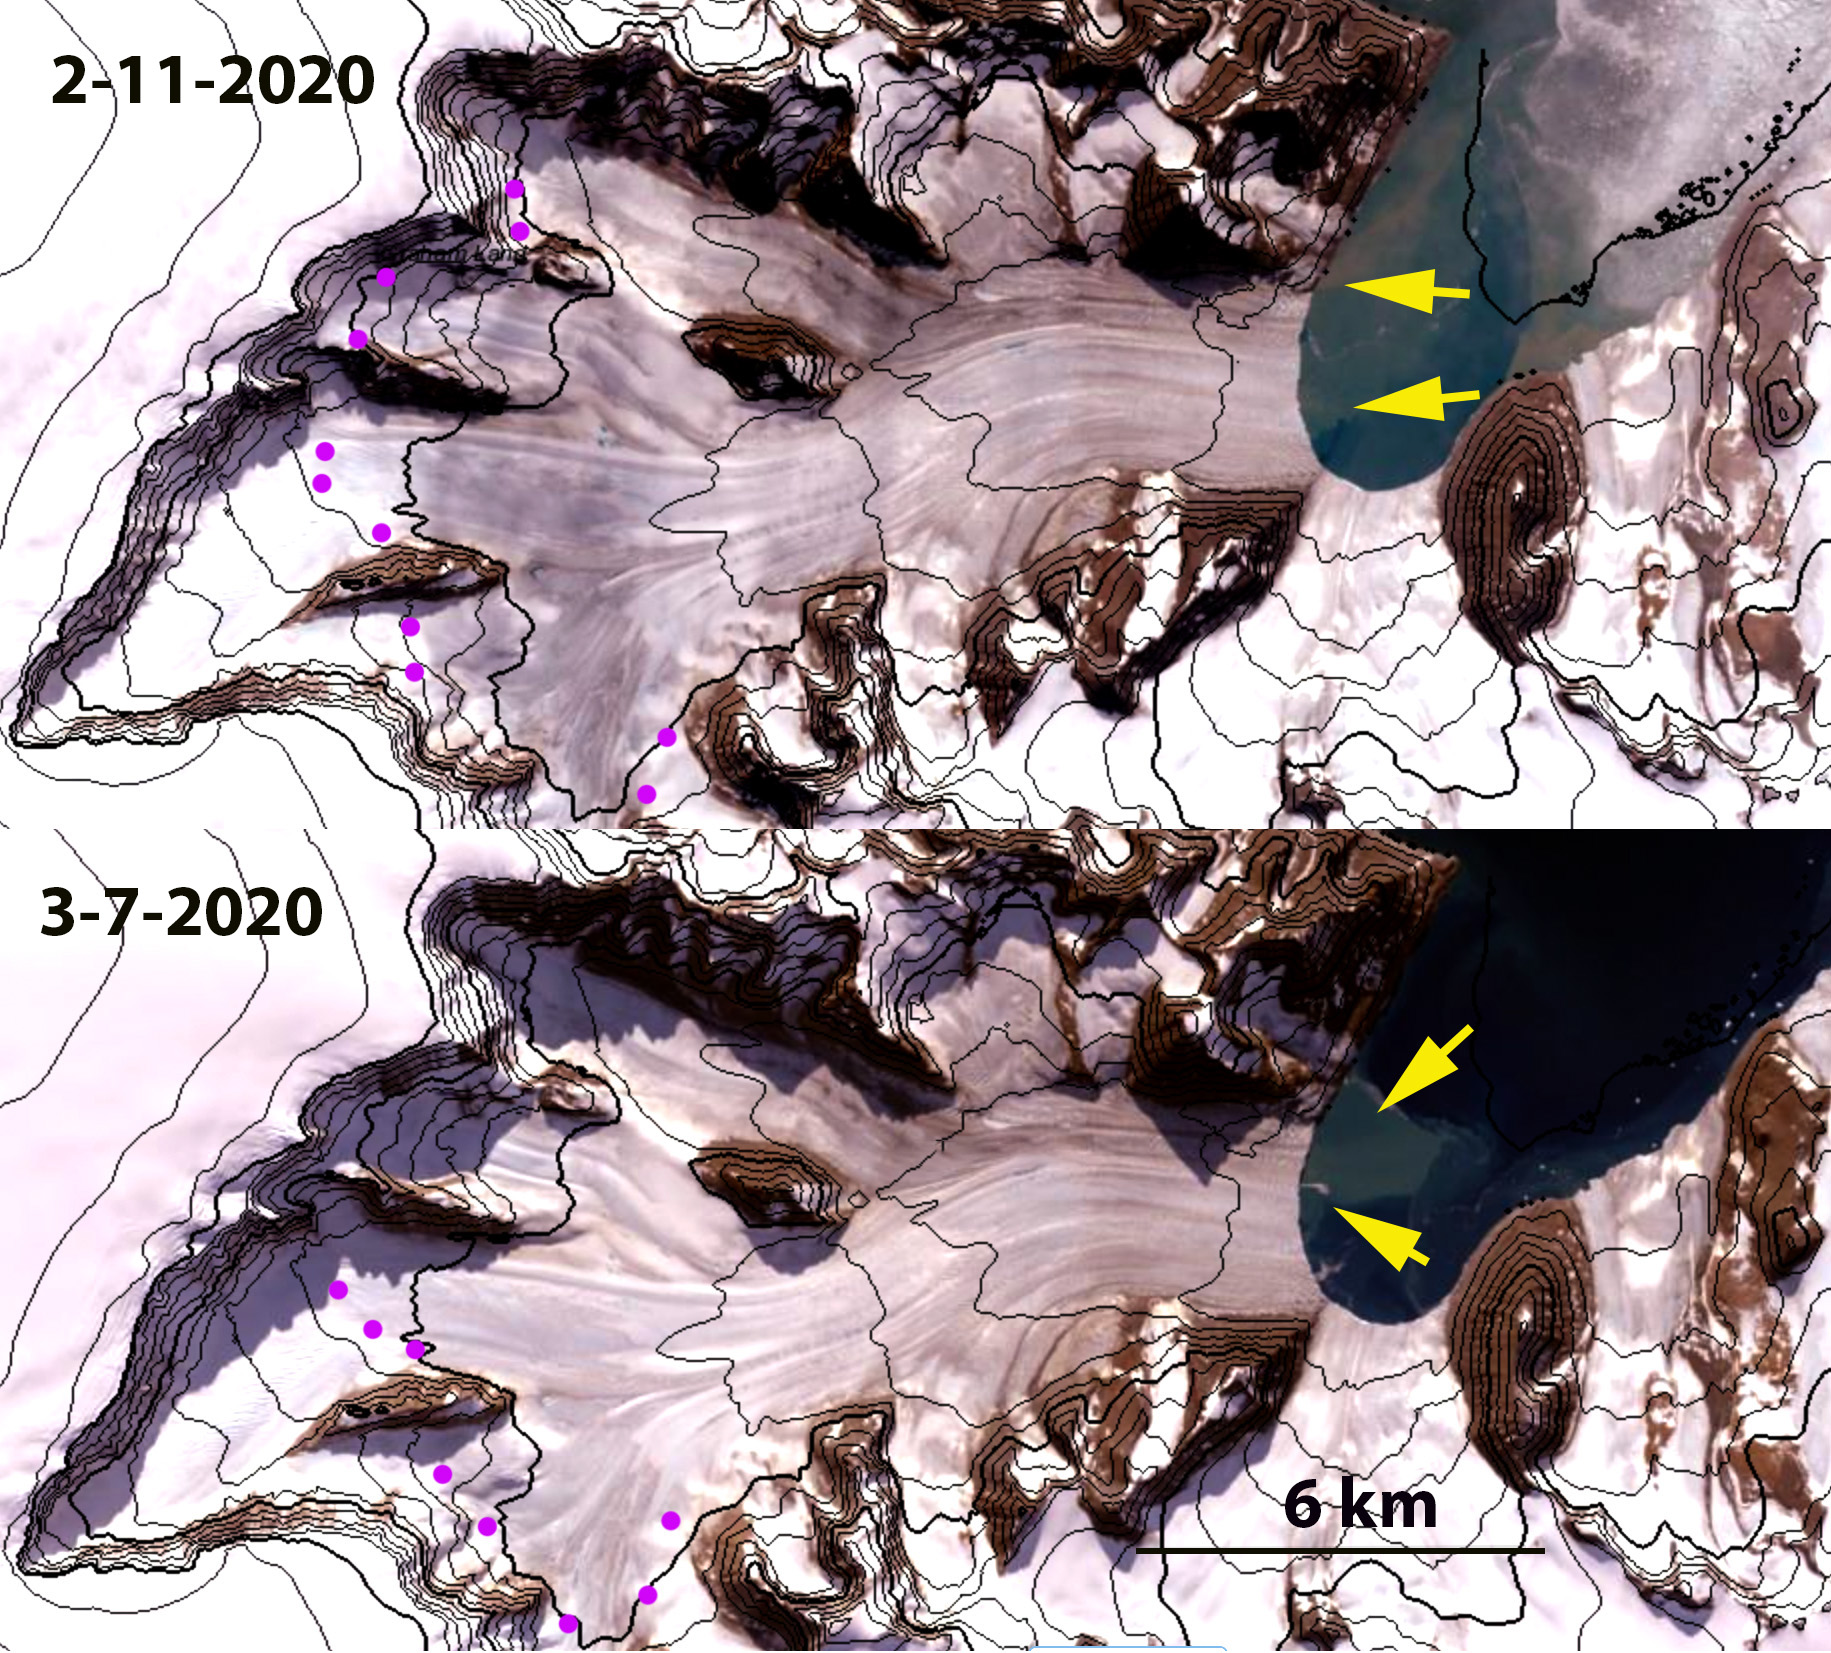
Sjögren Glacier in Landsat images above from Feb. 11, 2020 and below from March 7, 2020 viewed in the Antarctic REMA Explorer. Yellow arrows indicated meltwater plumes and magenta dots the snowline. Contours are at 100 m intervals.
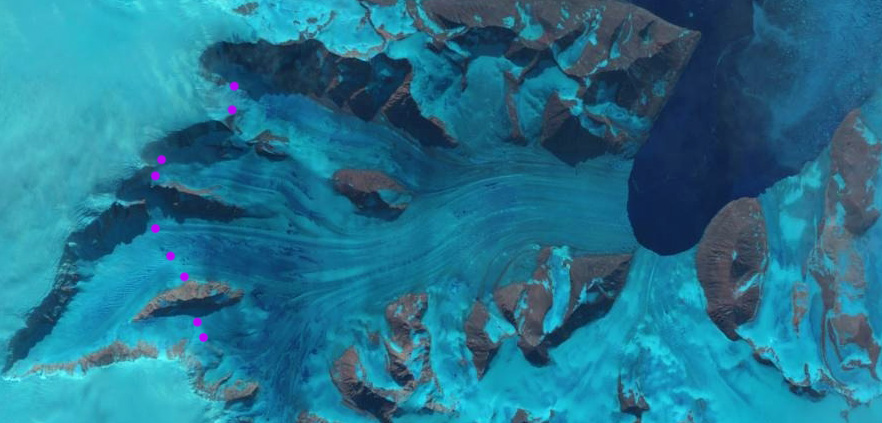
Sjögren Glacier in Feb. 11, 2020 Landsat image indicating snowline with magenta dots. The areas with significant surface meltwater have a deep blue color.
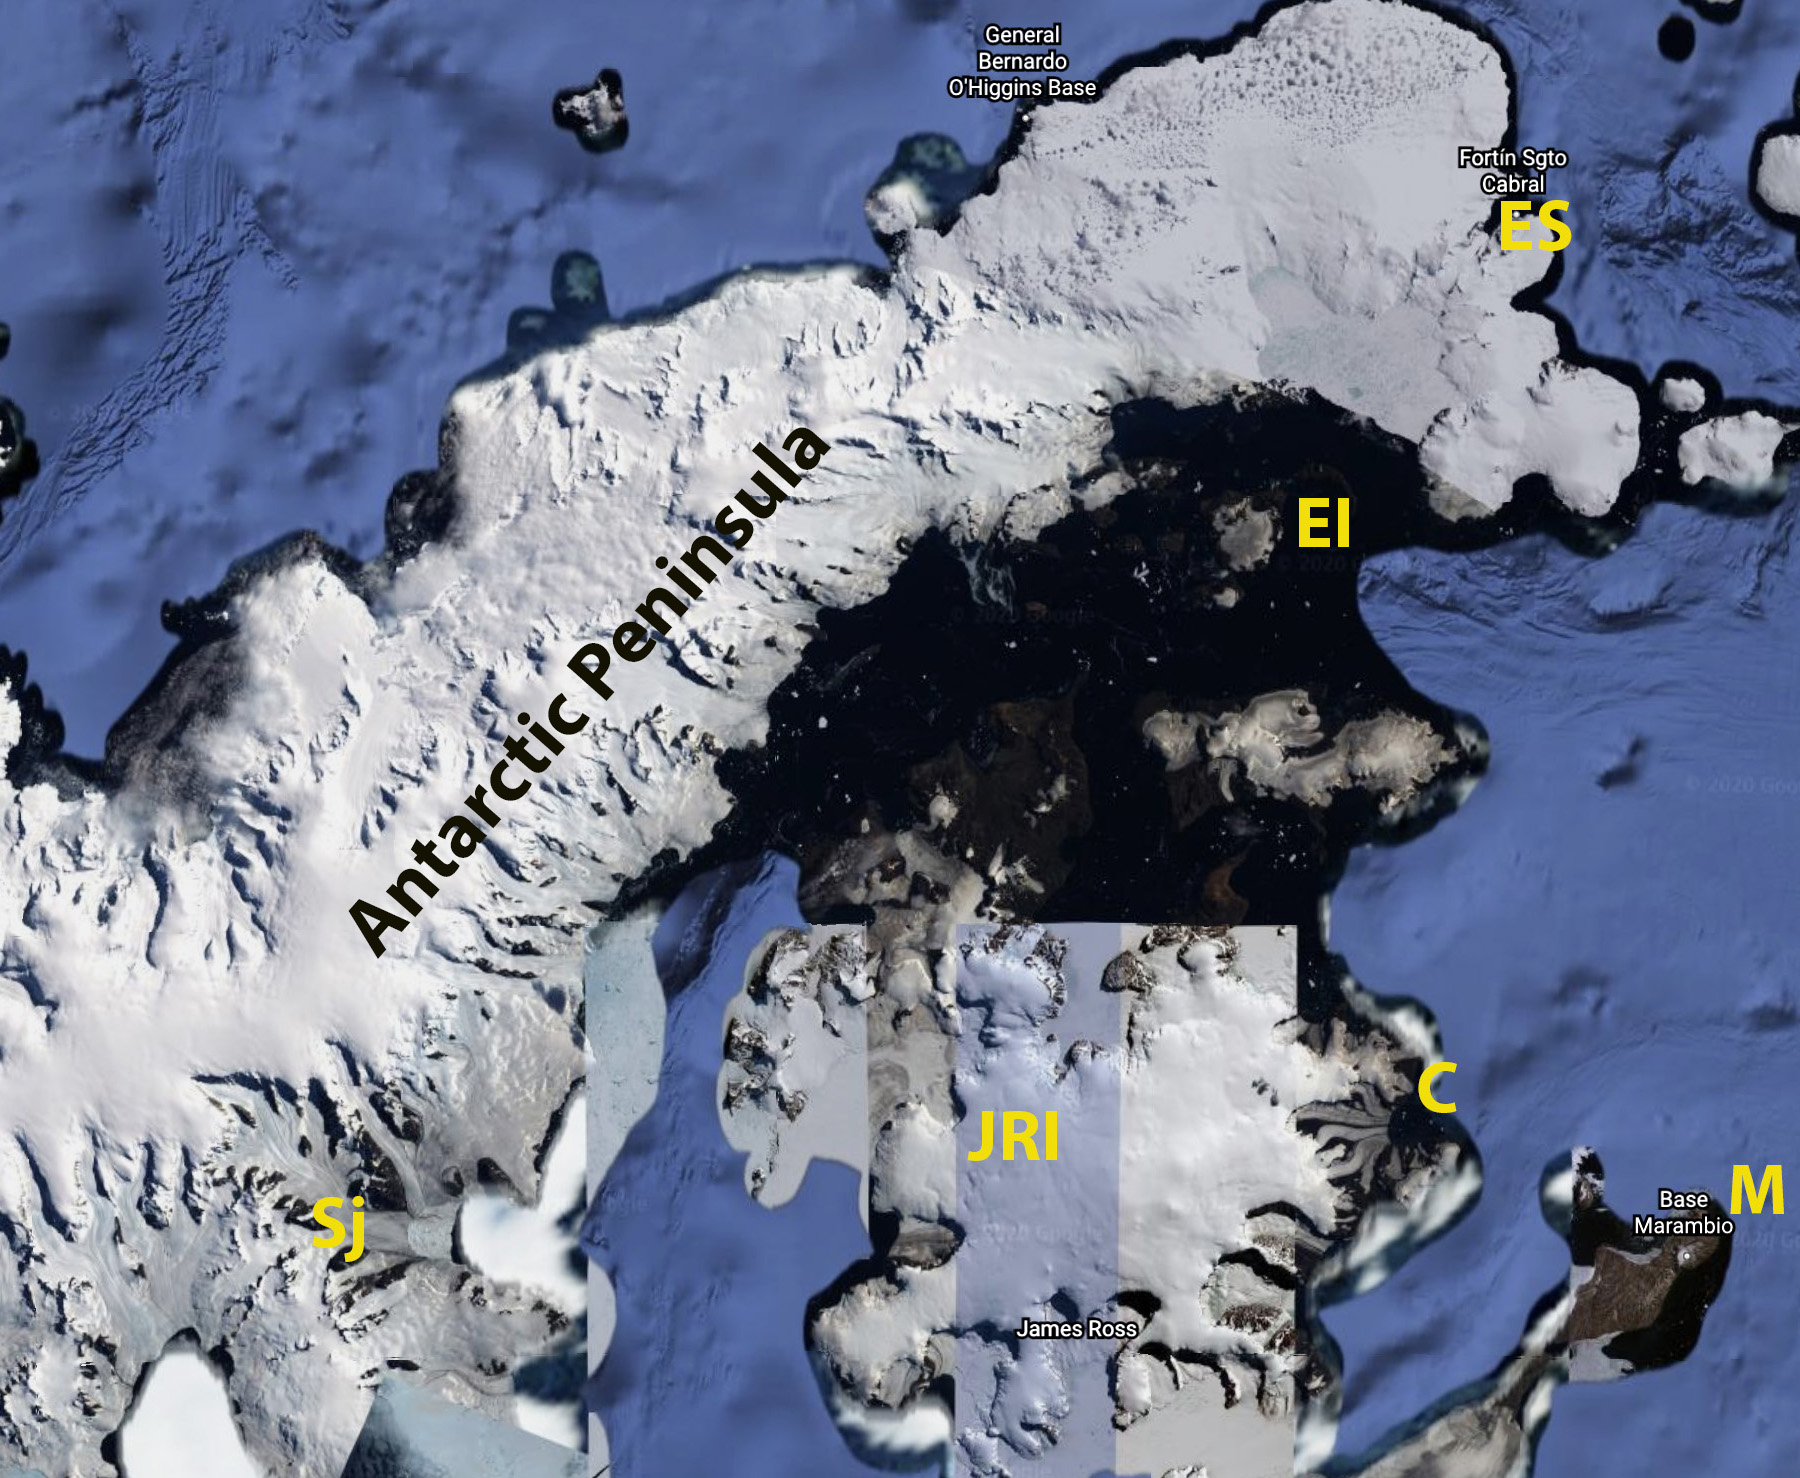
Base map for region indicating Esperanza Base=ES, Marambio=M, James Ross Island=JRI, Coley Glacier=C, Sjogren=Sj and Eagle Island=EI
 Dean of Academic Affairs at Nichols College and Professor of Environmental Science at Nichols College in Massachusetts since 1989. Glaciologist directing the North Cascade Glacier Climate Project since 1984. This project monitors the mass balance and behavior of more glaciers than any other in North America.