July 2, 2020
Global Glacier Change Bulletin 3 (WGMS) Reports Increasing Mass Balance Losses
Posted by Mauri Pelto
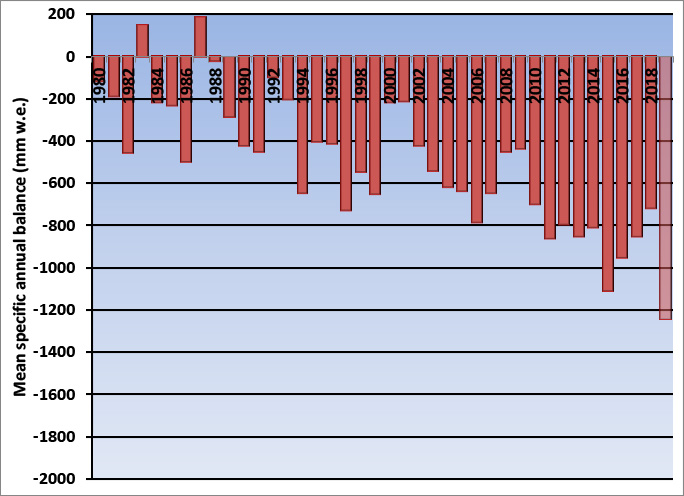
Figure 1. Regionalized mean annual mass balance of WGMS reference glaciers 1980-2018, with 2019 being a mean of reference glaciers.
Glaciers have been studied as sensitive indicators of climate for more than a century and are now experiencing a historically unprecedented decline (Zemp et al, 2015). Glacier fluctuations in terminus position, mass balance and area are recognized as one of the most reliable indicators of climate change. This led to glacier mass balance being recognized during the International Geophysical Year (IGY) in 1957 as a key focus area for developing long term data sets and the need to establish an international data repository.
Today this data reporting system is managed by the World Glacier Monitoring Service (WGMS). WGMS annually collects standardized observations on changes in mass, volume, area and length of glaciers with time, and additionally collecting statistical information on the distribution of glaciers from inventories. WGMS just published their third Global Glacier Change Bulletin, a comprehensive data report covering the 2015/2016 and 2016/2017 hydrologic years. I review some of that information here with updated reference glacier mass balance data from WGMS for 2018 and 2019.
The data set compiled by the World Glacier Monitoring Service has 45,840 measurements on 2540 glaciers (WGMS, 2020). Annual mass balance measurements are the most accurate indicator of short-term glacier response to climate change. WGMS, (2020) data set has 7300 annual balance values reported from 460 glaciers, with 41 reference glaciers having 30+ year consecutive ongoing records. Annual mass balance is the change in mass of a glacier during a year resulting from the difference between net accumulation and net ablation.
The key data set is the annual balance record from the reference glacier network, these glacier have extensive continuous field monitoring programs with at least a 30 year record. For example on Columbia Glacier, Washington I have been in the field 36 consecutive summers, over 120 days taking 4600 measurements with 63 assistants. Figure 1 above illustrates glacier mass balance for the set of global reference glaciers for the time-period 1980-2019. Global values are calculated using a single value (averaged) for each of 19 mountain regions in order to avoid a bias to well observed regions.
In the hydrological year 2016/17, observed glaciers experienced an ice loss of -550 mm, and 2017/18 of -720 mm. For 2018/19 hydrologic year a regionally averaged value will not be available until December 2020, the overall mean of all reference glaciers of -1241 mm, compared to -1183 mm in 2017/2018. This will make 2019 the 32nd consecutive year with a global alpine mass balance loss and the tenth consecutive year with a mean global mass balance below -700 mm. The simple mean mass balance of WGMS records has a slight negative bias compared to geodetic approaches, but this bias has been effectively eliminated with the regionalized approach now used by WGMS, see Figure 2 (WGMS, 2020). 
Figure 2. Glaciological mass balance of all glacier, reference glaciers (mean), regional mean of reference glaciers and regionalized mean geodetic mass balances for the 1930-2017 period. Pay particular note to the 1960-2017 period where the data records are better. Observe the similarity in cumulative mass balance losses regardless of approach.
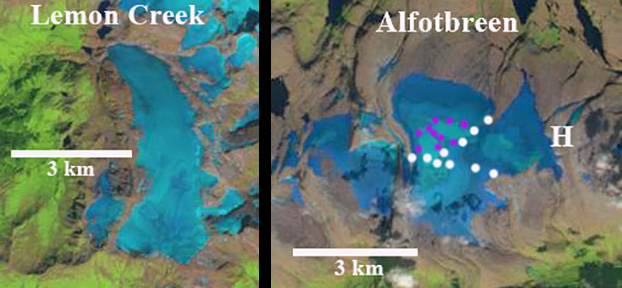
The decadal averaged annual mass balance was -172 mm in the 1980’s, -460 mm in the 1990’s, –500 mm for 2000’s and – 889 mm for 2010-2019. The increasing rate of glacier mass loss, with eight out of the ten most negative mass balance years recorded after 2010, during a period of retreat indicates alpine glaciers are not approaching equilibrium and retreat will continue to be the dominant terminus response (Pelto, 2019; WGMS, 2020). The accumulation area ratio is an indication of the expansion of the ablation areas globally, despite retreat accumulation areas are shrinking. The decline in accumulation area extent, hence AAR has been rapid, the data in 2017/2018 yields a mean of 13%, whereas the average needed to be in balance is 56%. The low AAR in 2019 is illustrated at two reference glaciers Lemon Creek, Alaska and Alfotbreen, Norway below.
Years |
Ba |
AAR |
1980-1989 |
-172 |
47 |
1990-1999 |
-460 |
44 |
2000-2009 |
-525 |
35 |
2010-2019 |
-889 |
28 |
Table 1 Glaciologic annual balance for each decade from the WGMS reference glacier mean of the 19 regions. The AAR is a simple mean of the reference glaciers.
Landsat images of Lemon Creek Glacier, Alaska and Alfotbreen, Norway in 2019. White dots indicate the glacier boundary on Alfotbreen, purple dots the snowline. Lemon Creek AAR=0% Alfotbreen AAR=~15%
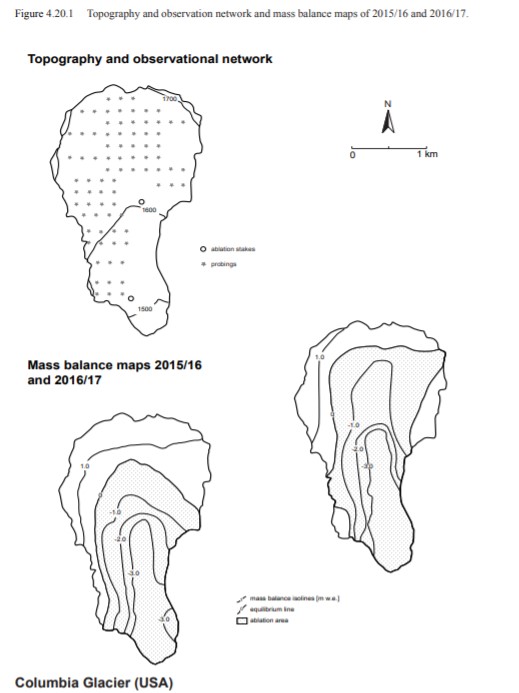
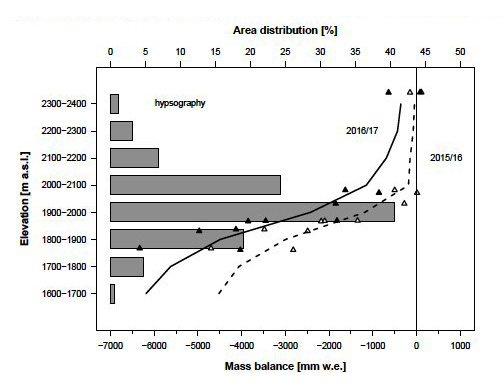
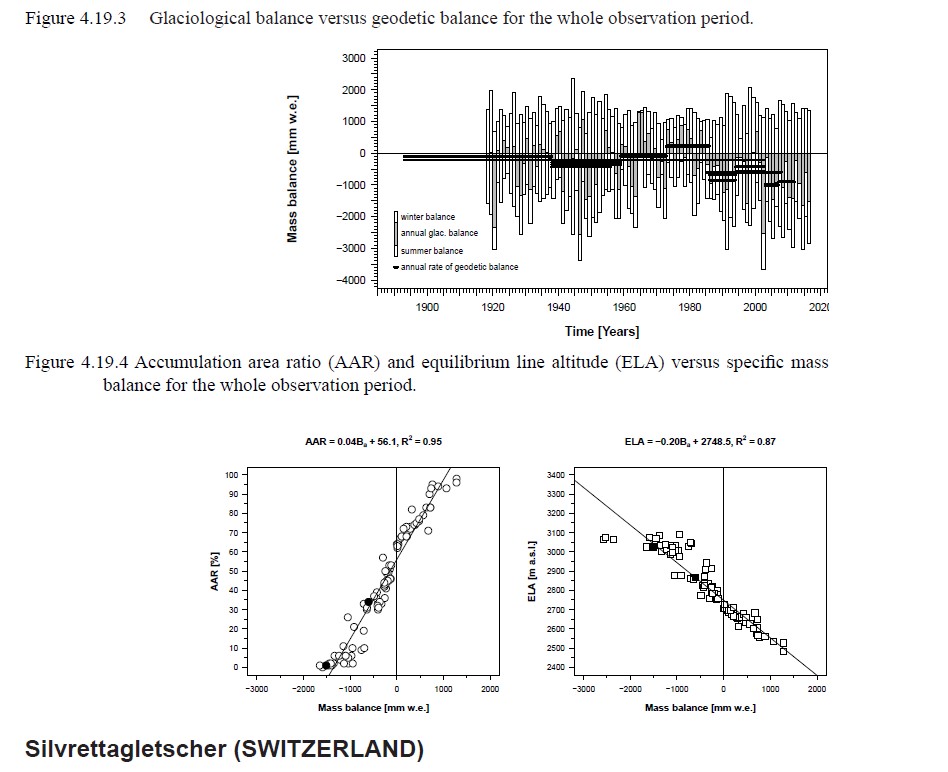
Detailed information is reported for 20 glaciers distributed around the globe that includes annual mass balance maps as illustrated from Columbia Glacier. The relationship between elevatation and annual balance is the balance gradient seen below for Mocho Glacier, Chile. This glacier is in the lake district of Chile at 39.90° S and 72.00° W and did not have significant accumulation in 2016 or 2017. The AAR-annual balance relationship and the ELA-annual balance relationship and annual balance record are reported, as exemplied by Silvretta Glacier, Switzerland, where negative balances occurred in 2016 and 2017.
The result of the rising snowline is mass losses, which drives glacier retreat. This also leads to decreased average albedo and surface lowering, which in turn cause pronounced positive feedbacks for radiative and sensible heat fluxes. This rapid decline in mountain glaciers chronicled by WGMS is expected to accelerate. Huss et al (2017) describe a cascade of effects that are occuring, impacting ecosytems, communites and our economy.
Annual mass balance maps and measurement network on Columbia Glacier.
Annual balance gradient for Mocho Glacier, Chile.
Annual balance record and annual balance relationship to both AAR and ELA on Silvertta Glacier.


 Dean of Academic Affairs at Nichols College and Professor of Environmental Science at Nichols College in Massachusetts since 1989. Glaciologist directing the North Cascade Glacier Climate Project since 1984. This project monitors the mass balance and behavior of more glaciers than any other in North America.