
April 20, 2020
Kolahoi Glacier Retreat and Lidder Watershed Changes, Kashmir
Posted by Mauri Pelto

Kolahoi Glaciers (G1 and G2) in 1993 and 2019 Landsat images. Red arrow indicates 1993 terminus location and yellow arrow the 2019 terminus location. The purple arrow indicates a debris covered area of a tributary to G1 that does not have active flow and will be disconnected. A new terminus is forming at yellow arrow left of purple arrow. Purple dots is snowline.
The Kolahoi Glacier in Kashmir is known as the—”goddess of light”—Gwash Brari. The glacier descends the north side of the mountain with two tongues of the glacier merging above the terminus. The glacier drains into the Lidder River and then the Jhelum River system. A publication out this week in Water from Irfan Rashid, Ulfat Majeed, Sheikh Aneaus at the University of Kashmir and Mauri Pelto at Nichols College examined the retreat of the two largest glaciers on Mount Kolahoi, decline in Lidder River streamflow below the glaciers and changes in agricultural land use in the Lidder watershed.
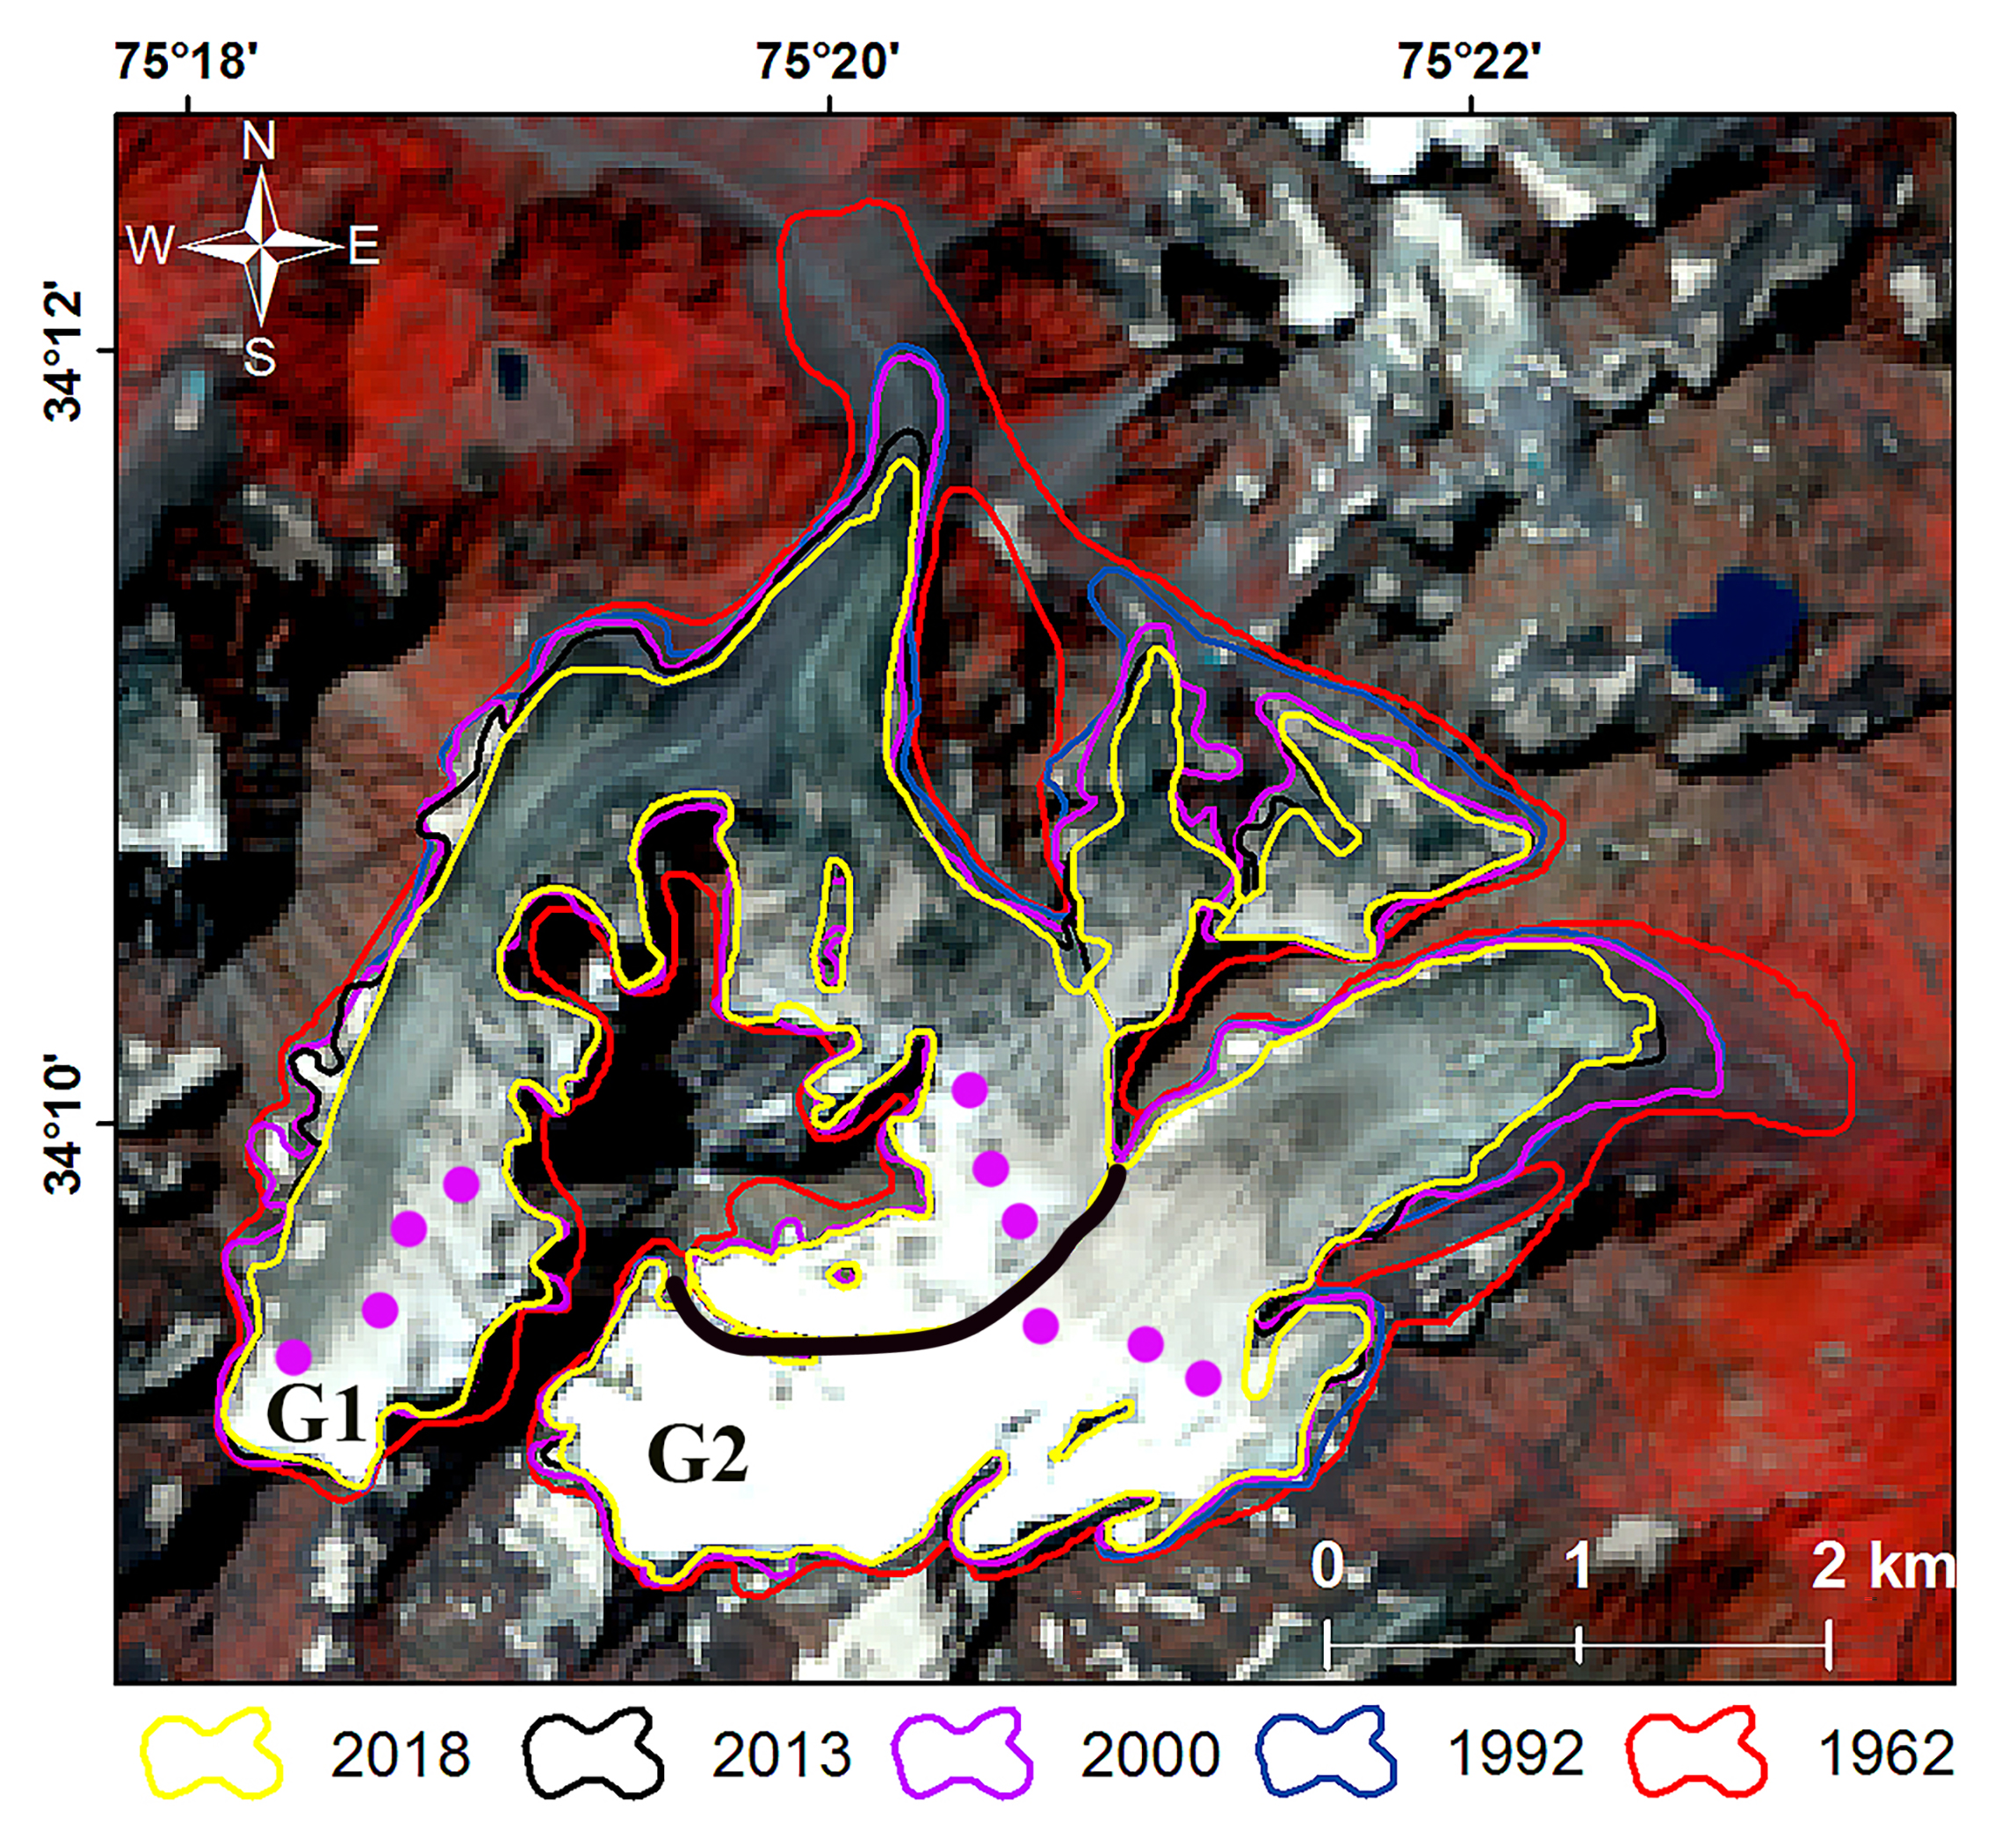
Change in glacier extent of G1 and G2 from 1962-2019 a ~24% decline.
For the Kolahoi Massif climate warming has led to a cumulative deglaciation of ~24% from 1962-2018. The terminus of the two largest glaciers G1 and G2 retreated at a rate of 18.3 m/year and 16.4 m/year from 1962-2018 accelerating substantially after 2000. Our analysis identified an upward shift of ELA (end of summer snowline) by ~120 m that indicates an expanding ablation zone and mass loss from the glacier. The 1993 snowline above is at 4300 m, in 2001 at 4450 m, in 2015 at 4450 m and in 2018 and 2019 at 4650 m, not all of the images are at the end of the melt season. The negative glacier mass balance prevalent over the region will continue to drive the glacier recession and result in growing season glacier runoff declines. The Landsat images from 1993, 2001, 2015, and 2019 indicate retreat, snowline rise and that the east and west branches of G1 are about to separate. G1 has been harder hit because less of the total glacier area has remained above the snowline in the accumulation zone than at G2. The higher snowlines have also driven less ice flow which reduces crevassing as the glacier thins and flow is reduced, note adjacent to Point A between 2006 and 2014.
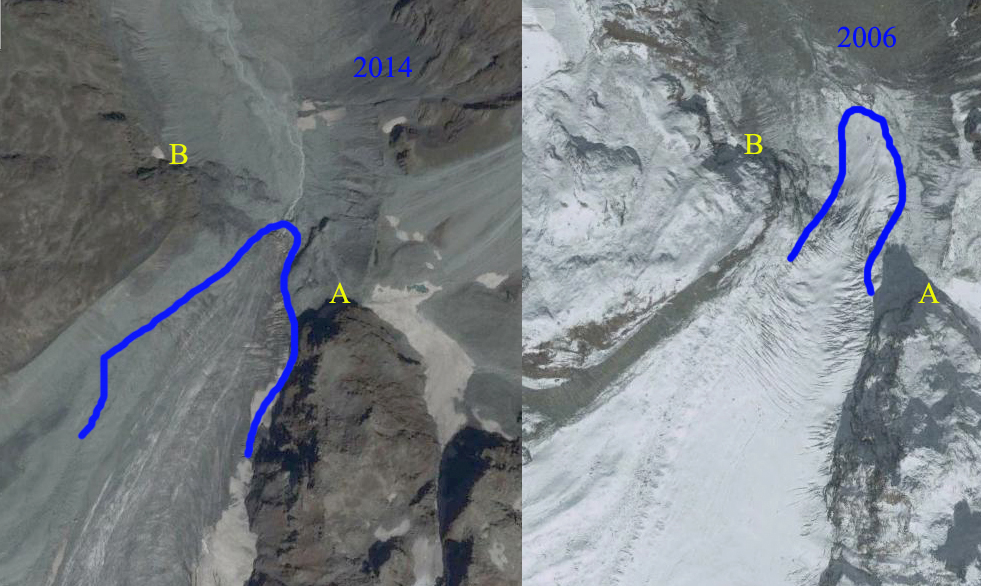
Terminus of G1 in 2006 and 2014 Digital Globe images, thickness is reduced near Point A and creveassing.
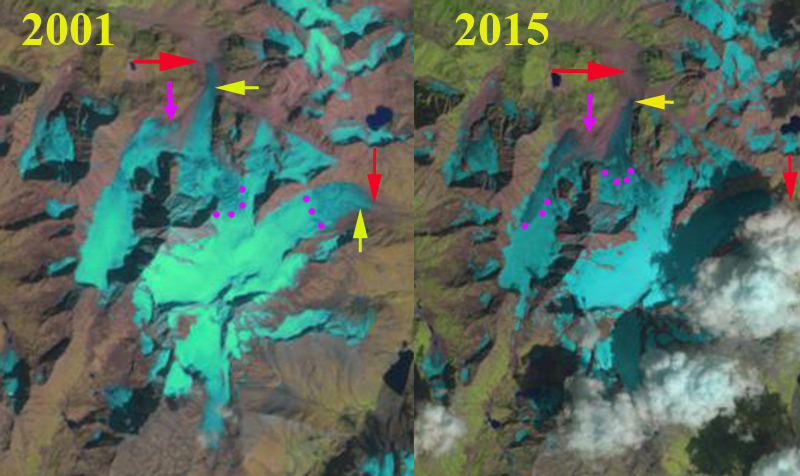
Kolahoi Glaciers (G1 and G2) in 2001 and 2015 Landsat images. Red arrow indicates 1993 terminus location and yellow arrow the 2019 terminus location. The purple arrow indicates a debris covered area of a tributary to G1 that does not have active flow and will be disconnected. Purple dots is snowline.
The streamflow measured at 5 sites in the Lidder watershed show statistically significant depleting trends that have been a factor in forcing extensive land system changes downstream. At Aru station 8 km below G1, 17 of the last 20 years have had streamflow below average of 447 m3/sec. At Gur 68 km downstream from G1 streamflow has been below average 18 of the last 20 years. Stream discharge is reduced here from Aru averaging 183 m3/sec, reflecting the impact of irrigation on reducing flow. Lidder River has a 4.5 MW Pahalgam Mini Hydel Project, located ~30 km downstream of G1 snout. The Jhelum River has several large operating hydropower stations and several more under construction including the Karot Hydropower Project a 720 MW run of river project.
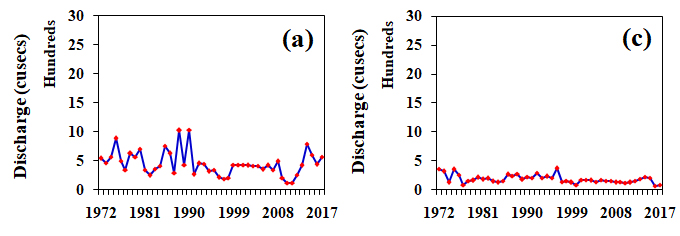
Lidder River Annual Mean Streamflow at Aur 8km from glacier and Gur 68 km from glacier.
The area under agriculture in Lidder watershed shrunk by 39% during the same period. There was a massive expansion of 176% in orchards extent and 476% in built-up areas respectively from 1980-2018. The conversion of irrigation intensive agriculture lands, mainly rice paddy to orchards is attributed to economic considerations and depleting streamflows reported in the region. In the bottom image you can see the appearance of orchards, individual trees evident at Point A-C along with more housing development such as at Point D.
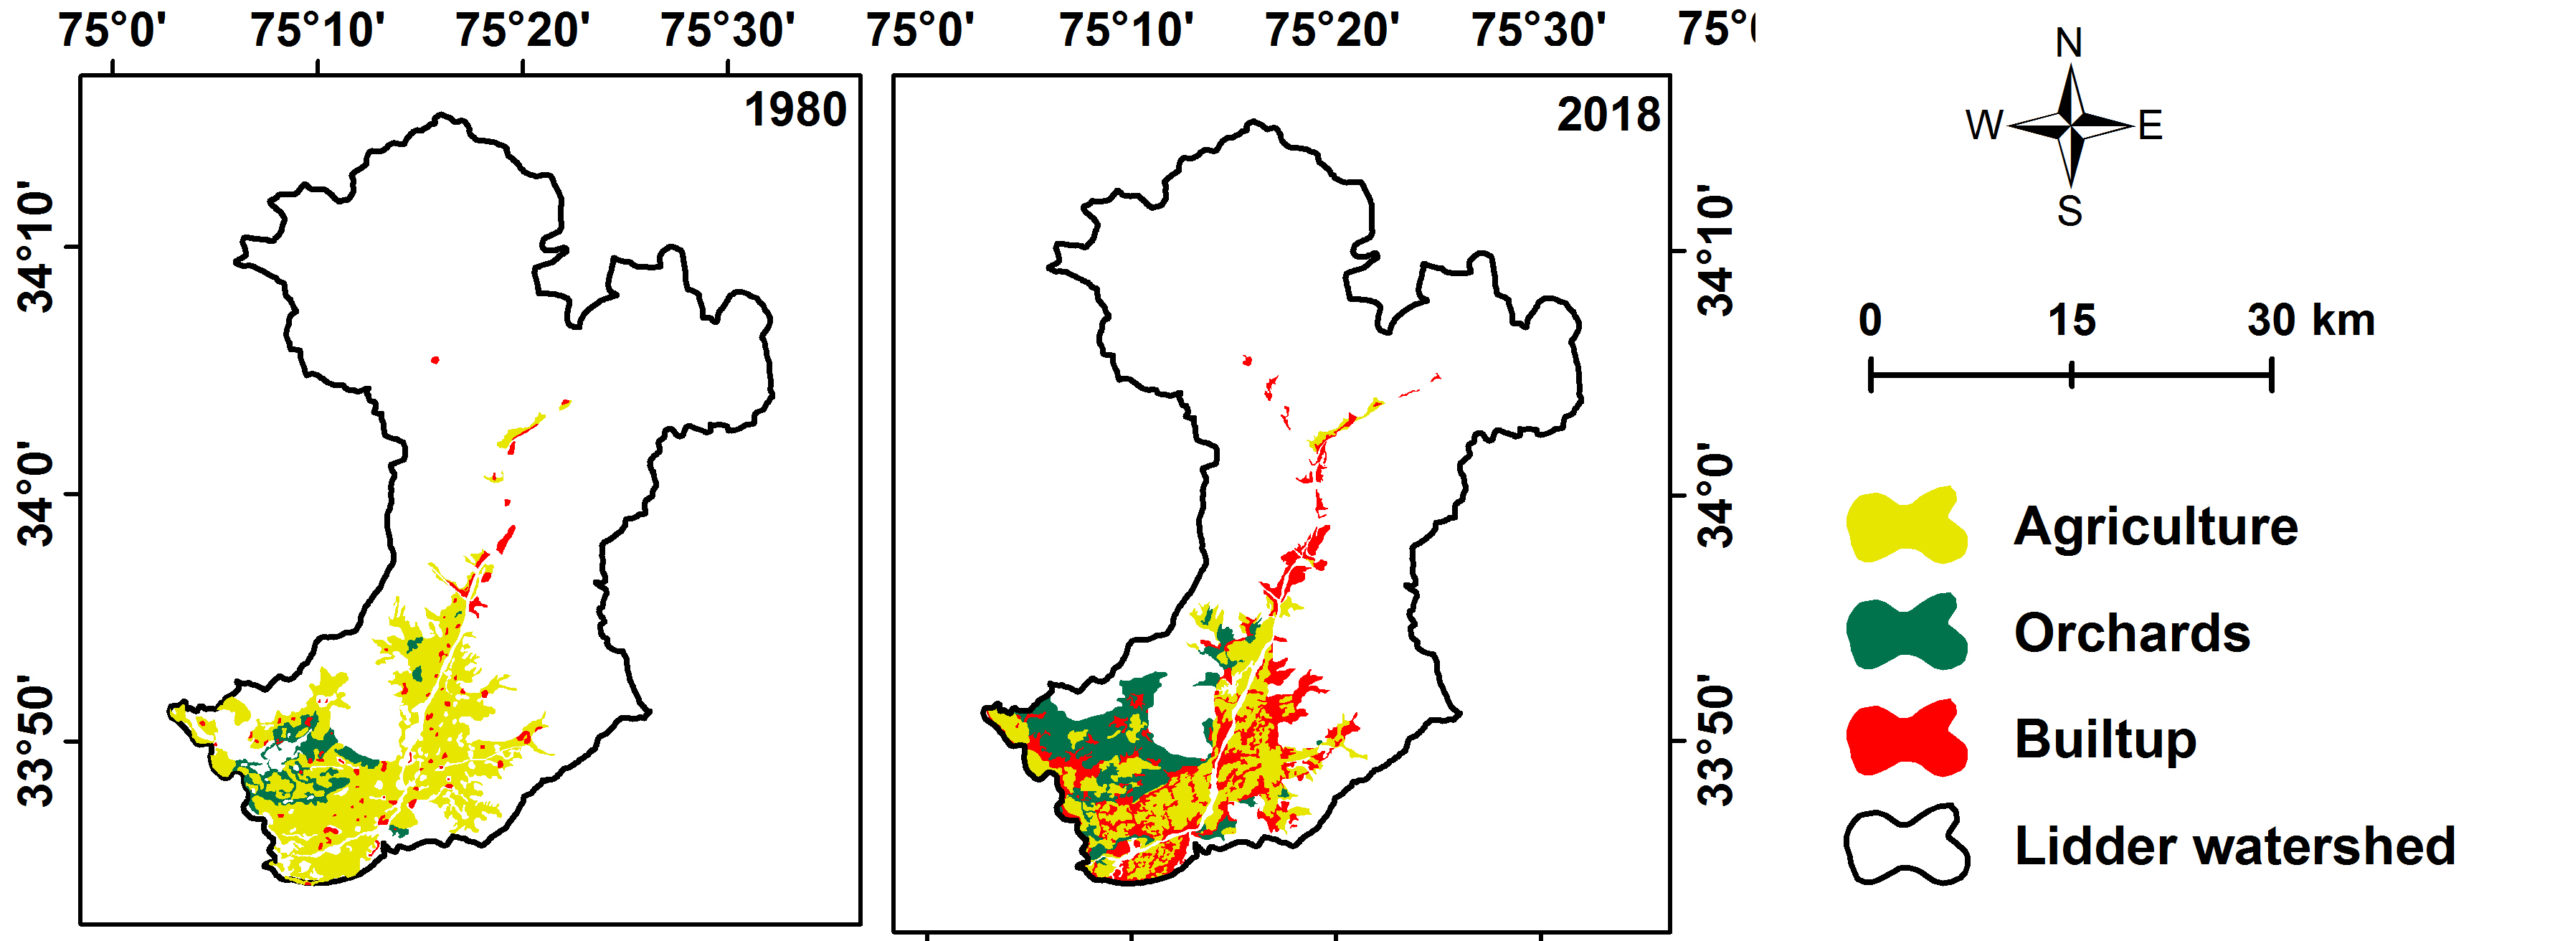
Downstream land-use changes in Lidder watershed between 1980 and 2018.
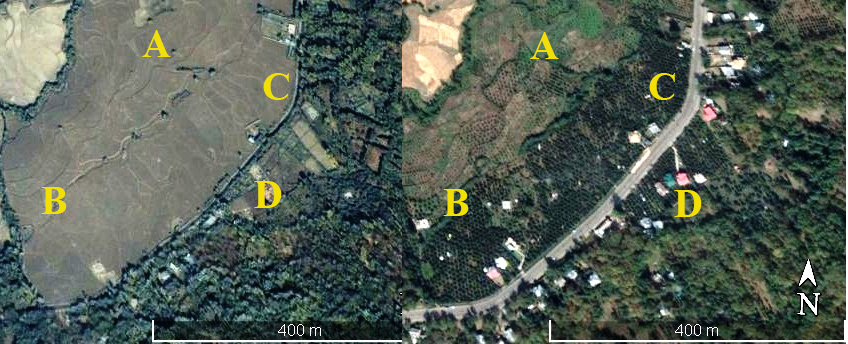
Images of the same location in 2001 and 2019 in the Lidder Valley. Point A-C are locations that were rice paddies and are now orchards. PointD is an area of increased housing development.
 Dean of Academic Affairs at Nichols College and Professor of Environmental Science at Nichols College in Massachusetts since 1989. Glaciologist directing the North Cascade Glacier Climate Project since 1984. This project monitors the mass balance and behavior of more glaciers than any other in North America.
ELA demarcation at 4650 masl in 2019 is highly miscalculated or i guess it may be a typing error.
Firstly, this much of transition from previous studied year is not possible and secondly this glacier constitutes only 20 percent of its area above this particular elevation which seems to be very less. if taken at this much elevation, the AAR will be around 0.2 which will result in very less and miscalculated mass balance figures.
In fact the ELA was quite high in 2019, leading to a low accumulation area ratio, and a mass balance loss. The purple dots on the Landsat image from 2019 marks the snowline which is at ~4650 m.