
October 31, 2019
Ongoing Evolution of Fleming Glacier, Antarctica
Posted by Mauri Pelto
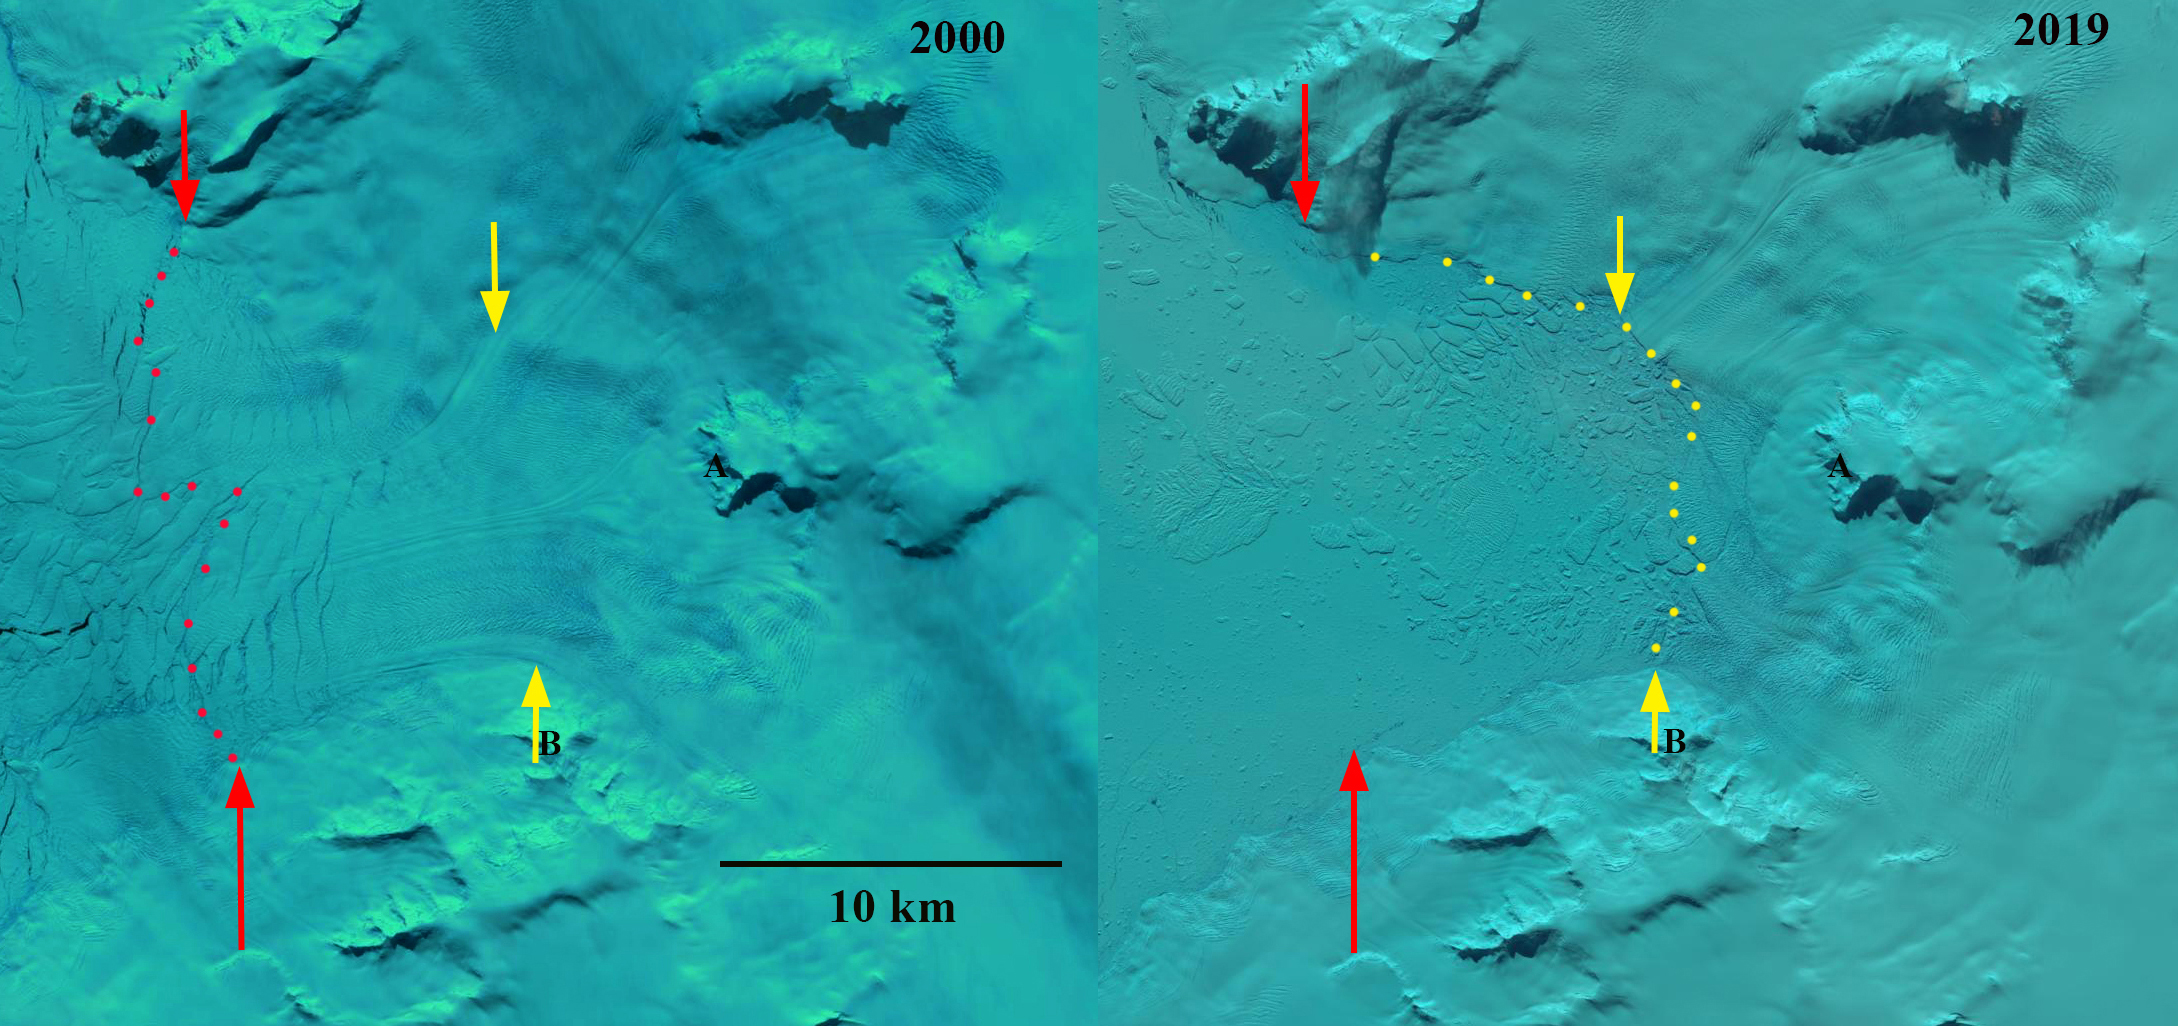
Fleming Glacier in 2000 and 2019 Landsat images. The 2000 glacier front is marked by red arrows on the north and south margin and red dots along the front. The 2019 glacier front is marked by yellow arrows and yellow dots.
During the 1980’s the glaciologic community was focused on increasing our baseline information and monitoring of Antarctic ice shelves. An understanding that ice shelves had a critical role along with a recognition that their specific role was not well understood, resulted in planning for and then having the instrumentation in place to observe the loss of several ice shelves in the next couple of decades. The following is the story of the continuing changes of Fleming Glacier that formerly fed the Wordie Ice Shelf.
Doake and Vaughan (1991) of the British Antarctic Survey reported on the disintegration of the Wordie Ice Shelf resulting from surface crevasses or rifts extending to the bottom of the ice shelf. The ice shelf disintegrated from an area of 1900 km2 in 1970 and to an area of 100 km2 in 2009. They observed that rift formation that led to retreat of the ice front were enhanced by a warming trend recorded in mean annual air temperatures in Marguerite Bay. A few years later Vaughan and Doake (1996) analyzed a 50-year meteorological record that identified significant atmospheric warming on the Antarctic Peninsula and compared that to time-series observations of areal extent of nine ice shelves on the Peninsula. At that time the five northerly ice shelves had retreated dramatically in the past fifty years, and further south there was no clear trend.
Fleming Glacier on the Antarctic Peninsula which had fed the Wordie Ice Shelf was observed to be thinning rapidly from 2004-2008 leading to a velocity increase (Wendt et al, 2010). This led to the production of numerous tabular icebergs from the glacier front as seen in Landsat images from 2000-2019. Freidl et al (2018) updated this research identifying that acceleration coincided with strong upwelling events of warm circumpolar deep water into Wordie Bay. They observed a grounding line retreat of ∼ 6–9 km between 1996 and 2011, resulting in flotation of an additional ∼ 56 km2 of the glacier tongue. This has been driven by thinning of ~3 m/year from 2011-2014. A greater area of flotation will reduce buttressing and friction, which likely led to the observed speedup of ∼ 1.3 m/day between 2008 and 2011 along the glacier centerline (Freidl et al 2018) .
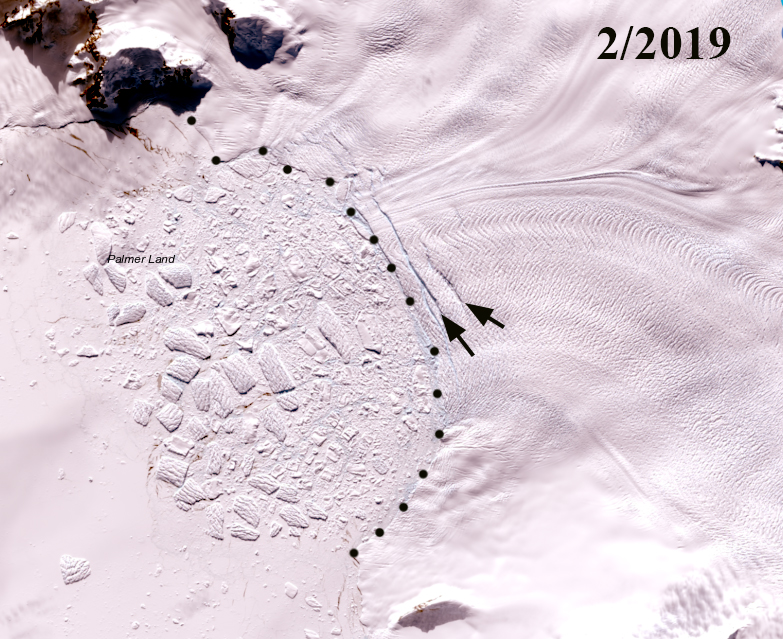
In 1989, image below, the Wordie Ice Shelf is still tenuously connecting several different outlet glaciers. The tabular icebergs are elongated perpendicular to ice front. In 2000 the calving front was near the mouth of an embayment. There is a wide zone of rifted floating ice, with the actual ice front to the south hard to define based on which rift represents full separation. There are two main feeding arms, one between Point A and B, the main Fleming Glacier and the other north of Point A, the Seller Glacier and Airy Glacier. By 2008 the glacier had lost most of the rifted area of the floating tongue seen in 2000. In the 2017 Landsat image the northern arm has retreated towards a series of ice rumples indicating the glacier bed is resting on bedrock rises beneath the glacier. The main Fleming Glacier lacks evident rumples suggesting a deeper bed less interrupted by bedrock rises. There remains a series of tabular icebergs beyond the ice front and a single rift inland of the glacier front. In 2019 there are two rifts near the ice front in February indicating two substantial tabular icebergs will soon be released. The Fleming Glacier ice front has retreated 9.5 km from 2000 to 2019, o.5 km/year. The retreat of the calving front of Airy and Seller Glacier, north of Point A, is less. The area extent loss at the front of the three glaciers from 2000-2019 has been ~125 km2.
Freidl et al (2018) observe that the tongue of Fleming Glacier in 2016 was grounded between ∼ −400 and −500 m below sea level and that 3–4 km upglacier of the grounding line the bed deepens to over 1000 m below sea level 10 km upglacier of the 2016 grounding line. This would suggest the breakup of Fleming Glacier is poised to increase. The speedup of glaciers that had fed and been buttressed by the Wordie Ice Shelf continue to experience acceleration two decades after the major part of the ice shelf disintegrated. This is similar to the pattern seen at Larsen A and Larsen B (Scambos et al 2004). The glaciologic community has more tools and more scientists than 35 years ago to focus on ice shelves. Our increased understanding also allows a look back at events in the past where thanks to the foresight sufficient data/imagery was gathered, for example the recent work of Robel and Banwell (2019) . The ongoing dynamic changes illustrate the glaciologic community was focused on the right place beginning sustained examination of these ice shelves more than 30 years ago.
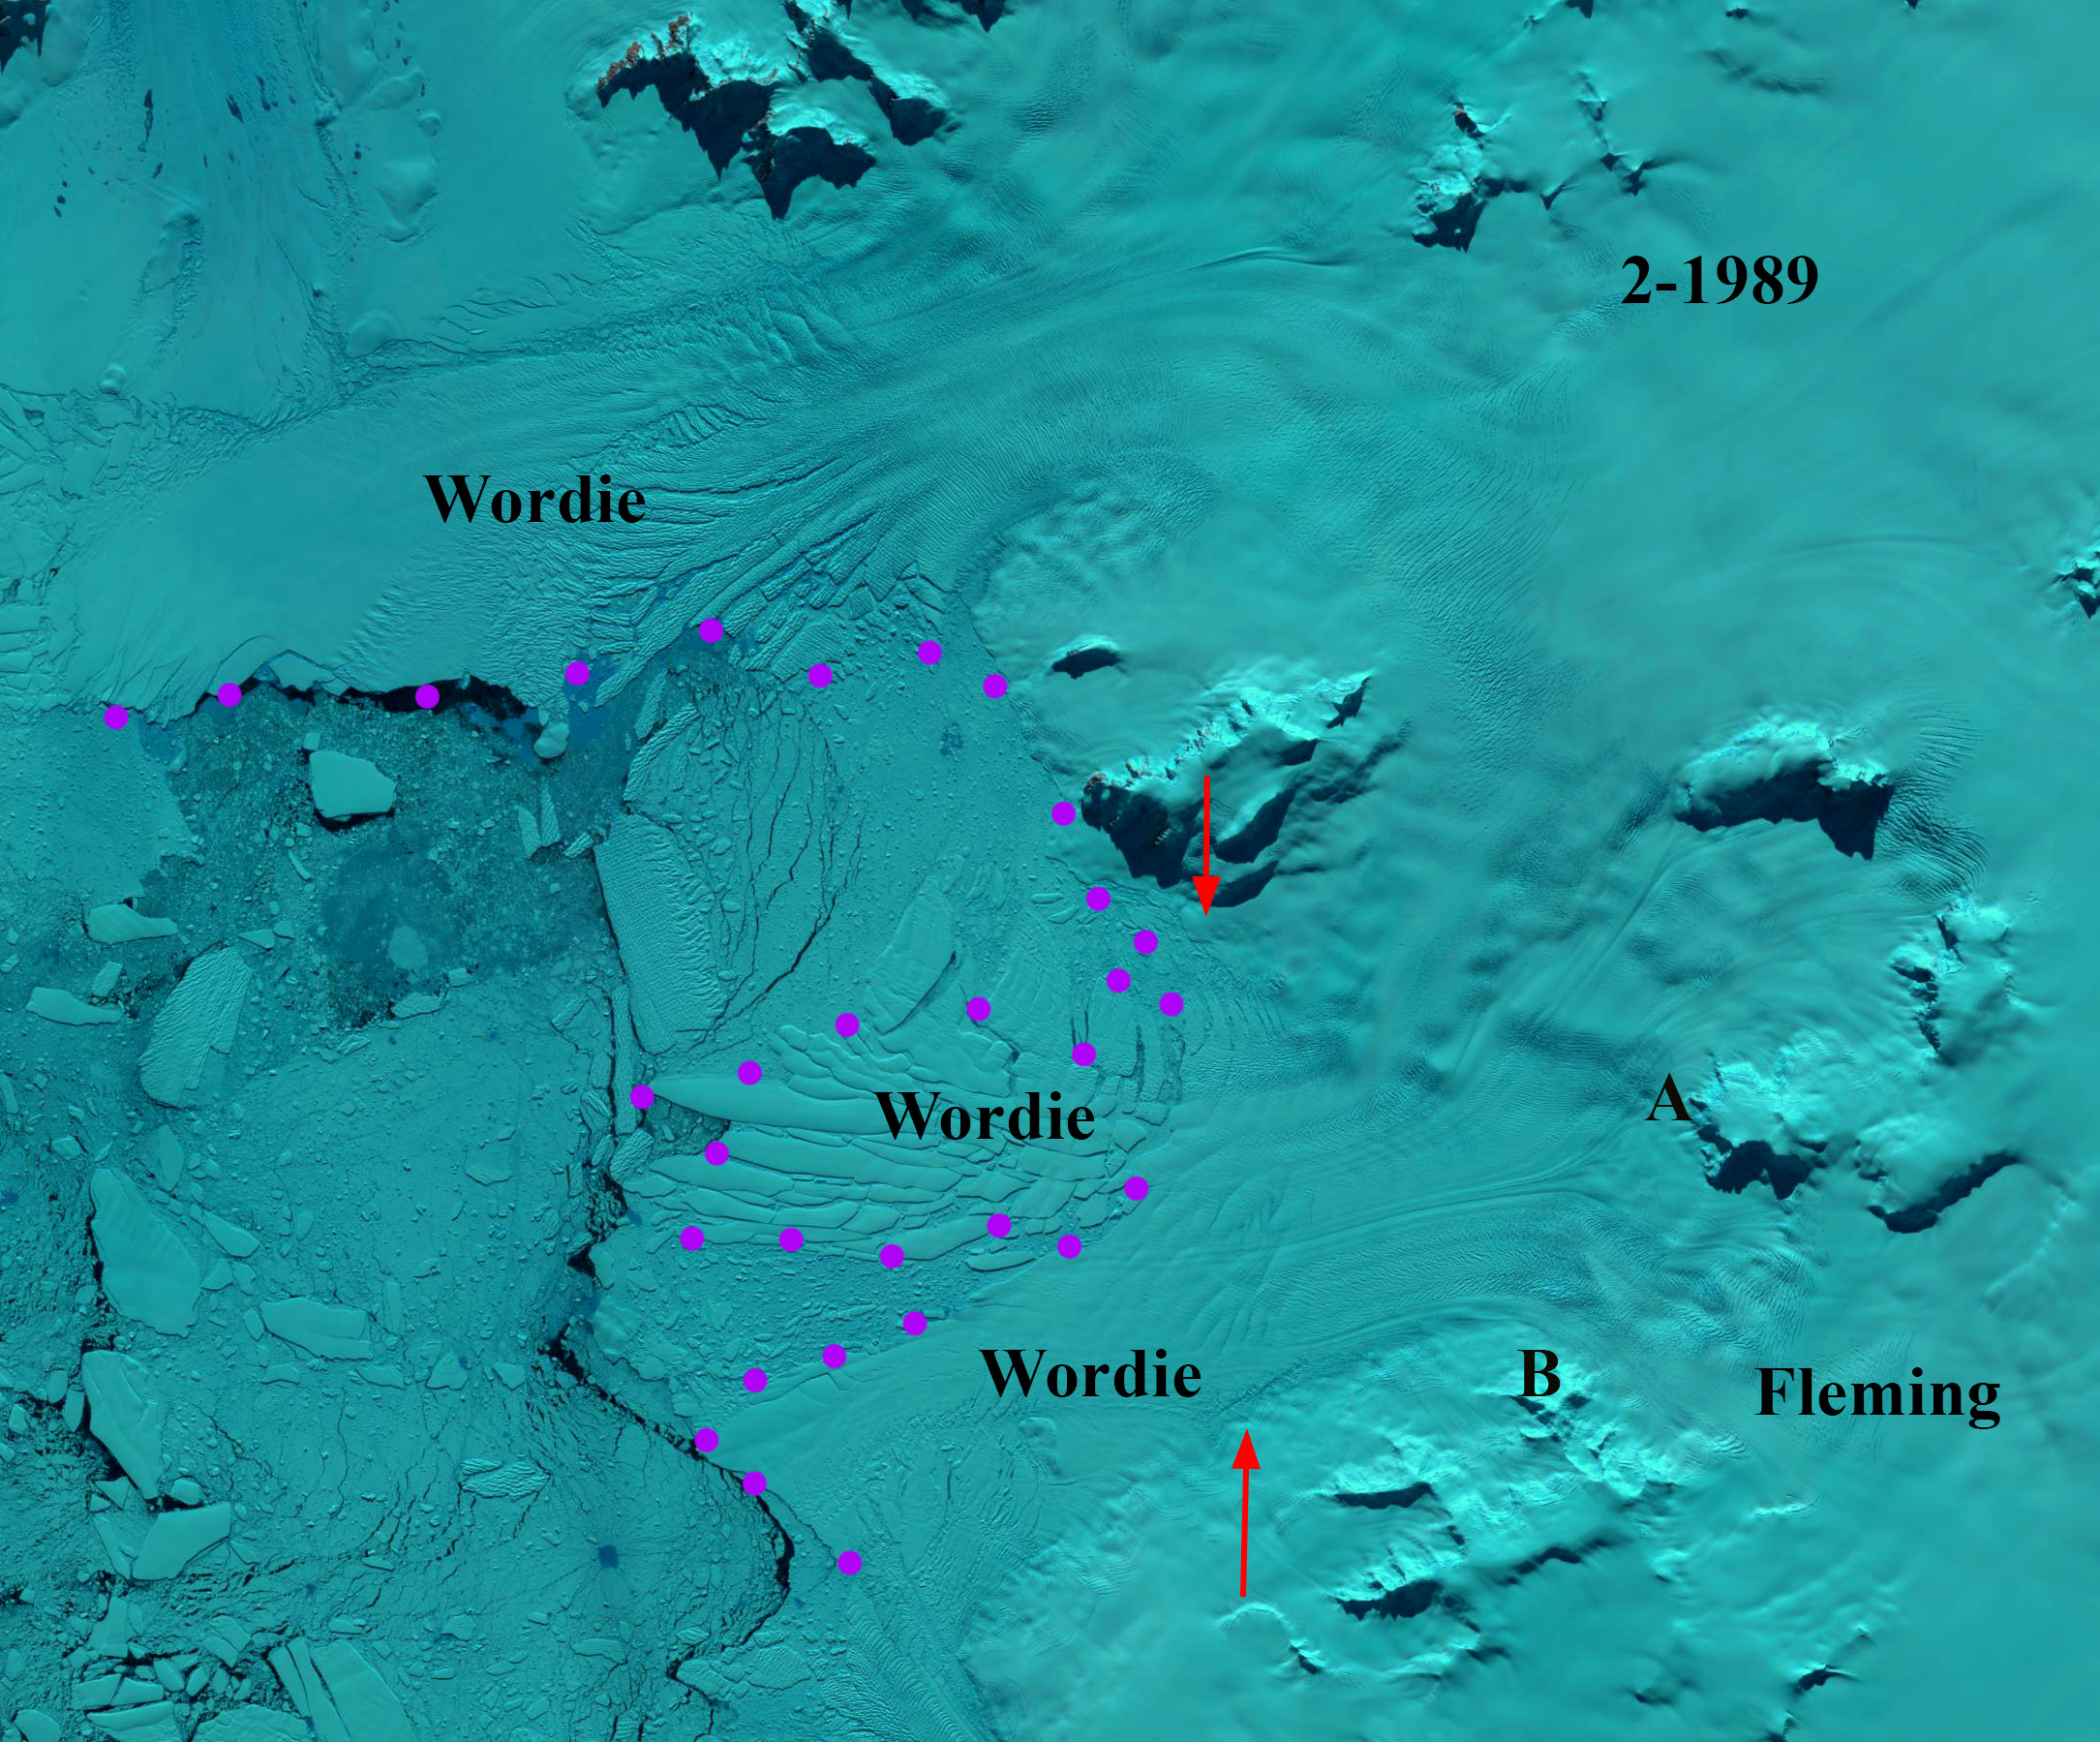
Fleming Glacier and Wordie Ice Shelf in 1989 Landsat image. Pink dots mark the approximate ice shelf front in 1989, certainly there are disintegrating tongues. Red arrows indicate 2000 glacier front location. Point A and B are same location as in other images.
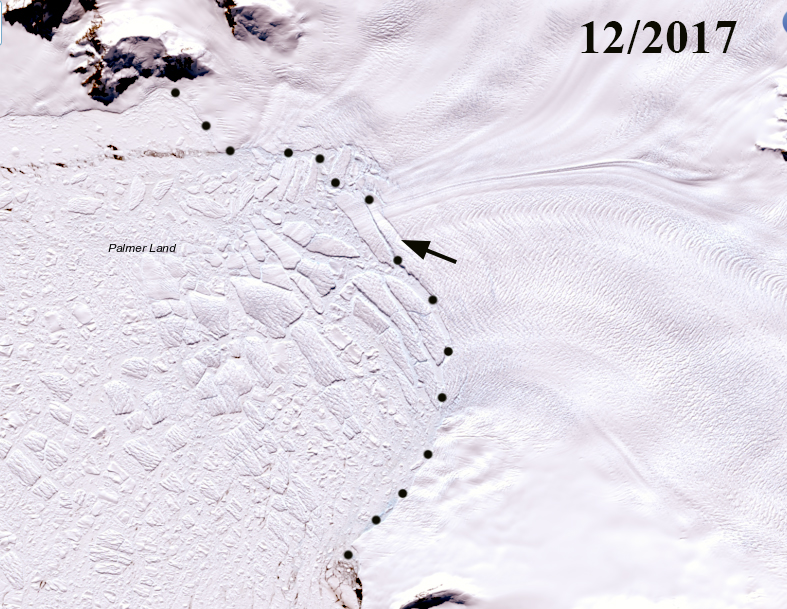
Fleming Glacier in a Dec. 2017 Landsat image viewed using the Antarctic REMA . Black dots indicate the approximate calving front and black arrows rifts behind the calving front.
Fleming Glacier in a Dec. 2017 Landsat image viewed using the Antarctic REMA . Black dots indicate the approximate calving front and black arrows rifts behind the calving front.
 Dean of Academic Affairs at Nichols College and Professor of Environmental Science at Nichols College in Massachusetts since 1989. Glaciologist directing the North Cascade Glacier Climate Project since 1984. This project monitors the mass balance and behavior of more glaciers than any other in North America.
[…] Fonte/Source: https://blogs.agu.org/fromaglaciersperspective/2019/10/31/ongoing-evolution-of-fleming-glacier-antar… […]
[…] Seller Glacier like many others in the region have experience rapid retreat in the last 30 years, Fleming Glacier, Sjogren Glacier and Boydell […]